INTRODUCTION
The use of probability distributions to characterize the spatial pattern of disease occurrence, species composition and species abundance in plant communities is now a well-established technique in plant-disease epidemiology and ecology (Campbell & Noe Reference Campbell and Noe1985; Madden Reference Madden and Jeger1989; Madden & Hughes Reference Madden and Hughes1995; Chen et al. Reference Chen, Shiyomi, Hori and Yamamura2008). In many ecological studies that involve the analysis of count data, the data exhibit variation greater than that predicted by the stochastic component of a model (Richards Reference Richards2008). Such data are referred to as overdispersed with respect to the modelled error distribution. Overdispersion may be due to the model not accounting for important covariates, or to a lack of independence among study subjects or treatments (Williams Reference Williams1975; Cox & Snell Reference Cox and Snell1989). Unfortunately, published studies that adopt model selection often do not report whether their data are overdispersed with respect to their best-fitting models (Richards Reference Richards2008). Moreover, ignoring overdispersion can cause overestimation of the precision of model parameters, which can in turn lead to the selection of overly complex models with more parameters (Anderson et al. Reference Anderson, Burnham and White1994), resulting in poor inference (Burnham & Anderson Reference Burnham and Anderson2002). Some statisticians, following McCullagh & Nelder (Reference McCullagh and Nelder1989), but ignoring their qualification (‘unless the data or prior information indicate otherwise’), suggest that it is wise to assume that overdispersion is always present.
Agricultural researchers usually make efforts to conduct experiments as pre-planned designs with imposed treatment levels and maintain all other conditions consistent across sampling units (e.g. plots) in order to minimize experimental errors and simplify analysis. However, despite taking such precautions to maintain uniformity, some heterogeneity among experimental units will often remain, such as differences in soil fertility, frost severity due to micro-topology, insect–pest density or a host of other possibilities. In such circumstances, there is a high probability of encountering overdispersed data. Therefore, there is a need to test for overdispersion and use appropriate statistical analysis techniques to determine the significance of imposed treatment (e.g. different species) effects in order to make better inferences (SAS 2010) and gain insight into the underlying biological processes (Garrett et al. Reference Garrett, Madden, Hughes and Pfender2004).
One important kind of data resulting from agricultural trials is BN data or data on the counts of just two possible outcomes, such as the number of diseased plants v. the number of disease-free plants or the number of surviving plants v. the number of dead plants. This data is usually measured within a plot or unit of replication comprised of a number of individuals, yielding data such as 15 out of 20 plants died in a particular plot. The standard model for BN data is the BN model, which implicitly assumes no overdispersion beyond standard BN errors (McCullagh & Nelder Reference McCullagh and Nelder1989). A standard model for BN data that does include the possibility of overdispersion is the beta-binomial (BBN) distribution, derived by assuming that the probability of plant death across different plots with the same treatment has a beta distribution (Skellam Reference Skellam1948; Williams Reference Williams1982; McCullagh & Nelder Reference McCullagh and Nelder1989). Using a BBN model allows testing of whether there is overdispersion in the data after accounting for the imposed treatment effects; if there is not, a simpler and more powerful BN model may be used, but if overdispersion is indeed present, it must be accounted for.
In some cases, it may be possible to measure the value of heterogeneous environmental variables across the experimental site and then account for their effect in the analysis as covariates, and if all the important heterogeneous environmental variables can be measured and accounted for in this way, at a detailed enough scale, the analysis should show no remaining overdispersion. However, due to the difficulty or impossibility of measuring all important heterogeneous environmental variables at a detailed enough scale, the analysis will often show some remaining overdispersion, thus indicating that some important ‘hidden’ environmental variables are still causing extra variability in the results. It is possible that the spatial structure in hidden environmental variables occurs within the plots (units of replication) and the variables are not spatially structured beyond the scale of individual plots/replicates. This may be the case when plants within a given plot are all more or less likely to succumb to frost, due to micro-topography, or to disease, due to short-range spore dispersal. If this is the case, then this variability must simply be modelled as overdispersion, with a corresponding reduction in the power and precision of the analysis. However, it is also possible that the hidden environmental variables are spatially structured beyond the scale of individual plots/replicates; due to large areas of increased frost susceptibility or larger-scale spore dispersal that spans multiple adjacent plots (units of replication). In this second case, it may still be possible to account for this environmental heterogeneity in a number of different ways.
For example, in the case of designed field experiments, overdispersion might also be due to environmental heterogeneity that causes correlation among neighbours at the scale of blocks. In such circumstances, correlation could be taken into account by including a random block effect in a BN model (‘G-side’ random effects) (SAS 2010), in which case the marginal responses will be correlated, due to the fact that observations within a block share the same random effect. Observations from different blocks will remain uncorrelated in the spirit of separate randomization among blocks. Alternatively, if the correlations among neighbours occur at a scale lower than the size of a block, smooth-scale spatial components could be taken into account with a BN model (‘R-side’ random effects) (Gotway & Stroup Reference Gotway and Stroup1997; Schabenberger & Pierce Reference Schabenberger and Pierce2002; SAS 2010).
Other approaches such as logistic-normal-binomial (LNB) or correlated BN models can also be used when assessing the effects of explanatory variables in designed experiments with environmental heterogeneity (Hughes et al. Reference Hughes, Munkvold and Samita1998). The former is very useful because it fits into the structure of generalized linear mixed models for discrete data, allowing researchers to deal with hierarchical aspects of experimental or survey designs (Williams Reference Williams1975; Lin & Breslow Reference Lin and Breslow1996; Hughes et al. Reference Hughes, Munkvold and Samita1998). In the LNB approach, an independently distributed standard normal random variable is added into the model to account for spatial heterogeneity (Hughes et al. Reference Hughes, Munkvold and Samita1998).
The spatial heterogeneity observed in a data set can also be explained through principal coordinates of neighbour matrices (PCNM). Even though this approach is currently used in ecological studies it has not, as far as the present authors are aware, been applied in analysing the results of agricultural experimentation (i.e. designed experiments). PCNM was developed to improve on other simpler methods for modelling spatial structures in data, including polynomial regression (trend-surface analysis in the bi-dimensional case) (Legendre Reference Legendre, Garbary and South1990; Borcard et al. Reference Borcard, Legendre and Drapeau1992), and use of Mantel and partial Mantel tests with a matrix of Euclidean (geographic) distances among sampling sites (Legendre & Troussellier Reference Legendre and Troussellier1988). Problems associated with these approaches are that individual terms are highly correlated, which prevents the modelling of independent structures at different spatial scales; having a large number of terms in the model; and coarseness in terms of spatial resolution, such as allowing only monotonic gradients or broad-scale spatial structures such as a single wave or a saddle (Borcard & Legendre Reference Borcard and Legendre2002; Dray et al. Reference Dray, Legendre and Peres-Neto2006). To solve these problems, PCNM takes a different starting point by considering the close neighbourhood relationships among the sampling sites (Borcard & Legendre Reference Borcard and Legendre2002; Dray et al. Reference Dray, Legendre and Peres-Neto2006, and references therein). The procedure can detect and quantify spatial patterns over a wide range of scales; for example, PCNM should be able to detect and account for large-scale trends or gradients across the whole experimental site, several large patches, such as increased death rates in large hollows due to frost or smaller patches, such as smaller patches of increased death rates due to rain-splashed spores being spread to nearby plants but not further. Details of the procedure are given in Borcard et al. (Reference Borcard, Legendre and Drapeau1992), Borcard & Legendre (Reference Borcard and Legendre1994, Reference Borcard and Legendre2002), Legendre & Legendre (Reference Legendre and Legendre1998), Dray et al. (Reference Dray, Legendre and Peres-Neto2006) and Peres-Neto et al. (Reference Peres-Neto, Legendre, Dray and Borcard2006). Other approaches for handling spatial autocorrelation in BN data that are not considered in this paper include generalized linear models with quasi-binomial errors and classification tree analysis (Wedderburn Reference Wedderburn1974; Thuiller et al. Reference Thuiller, Araújo and Lavorel2003).
The present study used an example data set of plant death in individual plots (number of plants that died v. number of plants that survived) obtained from a designed field experiment that included an Australian native perennial pasture legume Cullen australasicum (hereafter ‘Cullen’) and an exotic perennial pasture legume Bituninaria bituminosa var. albomarginata (‘Albo-tedera’). The objectives were to (i) investigate whether overdispersion was present in the data – that is, whether the number of dead plants per plot occurred in an aggregated pattern rather than random, by comparing BN and BBN models, (ii) analyse the observed plant death rate in the designed field experiments using the PCNM approach in order to explore the spatial variability and (iii) compare the results obtained through different statistical approaches (i.e. BN model, LNB model, BN model with random blocks, BN model with smooth-scale spatial components and PCNM) when analysing plant death rates as affected by design variables (i.e. plant variety).
MATERIALS AND METHODS
Site description
Data from an experiment that was originally designed to investigate the productivity and persistence of Cullen and Albo-tedera under a range of environmental conditions in the wheatbelt of Western Australia were used. The experiments were located at Buntine (Liebe Group long-term research site, 20 km west of Buntine (30°00′S, 116°20′E; 317 m asl)), the Department of Agriculture and Food, Western Australia (DAFWA) Research Station at Merredin (31°29′S, 118°13′E; 312 m asl) and the DAFWA Research Station at Newdegate (18 km west of Newdegate town site (33°06′S, 118°49′E; 333 m asl)). Sites were flat and uniform. There were no significant differences (P=0·05) in soil physical (i.e. texture and colour) or chemical (i.e. nitrate and ammonium N, bicarbonate extractable-P, potassium, sulphur, iron, aluminium and organic-C-concentrations, pH and EC) characteristics among blocks in each site (Suriyagoda et al. unpublished data). Sites were established using 4-week-old seedlings, grown in the glasshouse, on 9, 16 and 23 June 2008 (winter establishment) at Newdegate, Buntine and Merredin, respectively. The experiment was established in a blocked design. There were four blocks comprising linear arrays of 16 plots. Plots were 4 m long×1 m wide and were arranged side-by-side with 1 m spacing between adjacent plots. Each species was randomly assigned to eight plots in each block and then to four cutting frequencies of 1, 2, 3 and 4 cuts/yr (two plots for each cutting frequency). Each plot was 4 m2 in size, and consisted of 30 seedlings of either Cullen or Albo-tedera. There were no guard rows. Numbers of dead plants per plot were recorded on 12, 13 and 14 January 2009 (during summer) for Newdegate, Merredin and Buntine, respectively, and used for the analysis.
BN and BBN distributions
If there is a constant probability, P, of a plant being dead across replicate sample units (plots) representing the same experimental treatment, then the number of dead plants, X, out of n in a sample unit has the BN distribution:

in which prob(X=x) represents the probability of X being equal to x, where x takes values 0, 1, 2, …, n. The mean and variance of X according to the BN distribution are then nP and nP(1−P), respectively. Assuming a BN distribution with P, depending on experimental factors only, implicitly assumes, for example, that plots do not differ and the probability of a plant being dead does not depend on the location of other dead plants.
When heterogeneous soil, weather and pathogenicity characteristics make it unreasonable to assume P is constant across replicate sample units representing the same experimental treatment, then it is convenient to assume that P follows a beta distribution:

where Γ is the gamma function over the domain [0,1] and α and β are two positive parameters. In other words, if we let Pi=xi/ni, i=1, 2, …, k, where i indexes different studies (or plots, sites or even repetitions within treatments), and xi and ni are the number of dead plants and the sample size of the ith study, respectively, then using the BN model by itself implicitly assumes that P 1=P 2=…=P n=P, while using the BBN model allows for the possibility that these Pi values will differ due to environmental heterogeneity or other factors. In this case, where one BN distribution cannot adequately describe the additional variation when Pi varies, the variability in actual proportions within the study (plot, site, repetition) is modelled with a number of different BN distributions, while the variability in average proportions among the studies (the variation in the Pi values) is modelled with the beta distribution.
The resulting combination of the BN distribution with the beta density function (the BBN) can be written in the form:
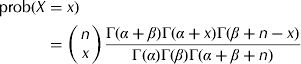
If we now let μ = α /(α + β), θ =1/(α + β), where μ is the mean plant death rate (i.e. the expected value of a variable BN parameter P) and θ is a measure of the variation in P, then, in short, the constructed two-stage model is

The new mean and variance of X are n μ and n μ(1−μ)(1+n θ)/(1+θ), respectively (Griffiths Reference Griffiths1973). Therefore, the term [(1+n θ)/(1+θ)] is a multiplier of the BN variance and the extent that it is greater than one represents the overdispersion. Kleinman (Reference Kleinman1973) used the term γ where γ = θ /(1+θ)=1/(α + β +1) and thus the variance of X is n μ(1−μ)(1−γ+n γ), and thus (1−γ+n γ) is the multiplier of the BN variance. In essence, the same information about the variance of the BBN distribution and the presence of overdispersion can be derived from both θ and γ, as explained below, so it is beneficial to know both and employ whichever is more convenient for computation. Detailed descriptions of parameter estimation for the BBN distribution through maximum likelihood and method of moment approaches are described by Griffiths (Reference Griffiths1973), Kleinman (Reference Kleinman1973) and Smith (Reference Smith1983).
The SAS macro BETABIN, written by Ian Wakelin, can be obtained from Qi-Statistics (http://www.qistatistics.co.uk/index.html, verified 9 June 2011). It borrows the existing SAS procedure NLMIXED to provide a maximum likelihood estimation of μ and θ for the BBN distribution. It provides not only the standard BBN model but also Brockhoff's (Brockhoff Reference Brockhoff2003) corrected BBN model.
Testing overdispersion
Using the BN model when the variability in the data exceeds that which the BN model can accommodate could result in an underestimation of the standard error of the pooled plant death rate and thus increase the chance of a Type I error when comparing treatment effects (McCullagh & Nelder Reference McCullagh and Nelder1989). So before one adopts the BN model for the analysis of a particular dataset, one must first examine whether the data are overdispersed to the extent that the BBN model would be a better fit than the simple BN model (Williams Reference Williams1982; Moore Reference Moore1987). One way to examine overdispersion is to test whether θ is significantly greater than 0 or, alternatively, whether γ is significantly greater than 0. In both cases, this is testing whether the variance of the BBN distribution is significantly larger than the variance of the BN distribution with the same mean. This follows because the variance of the BBN reduces to n μ(1−μ) and thus the BBN reduces to the ‘pure binomial’ when θ=0 or γ=0 (Hughes & Madden Reference Hughes and Madden1993). If θ and γ are close to zero, then there is no significant overdispersion and the BN model will adequately describe the data. The SAS macro BETABIN provides the estimates of θ and γ and their significances, which were used to test the overdispersion in our seedling survival dataset.
Once the parameter P for the BN and α and β for the BBN have been estimated, the expected frequencies for the BN and BBN distributions can be calculated using methods suggested by Skellam (Reference Skellam1948) or McCullagh & Nelder (Reference McCullagh and Nelder1989). The expected frequencies of plant death for a given plot within a site and across sites for the BN distribution were calculated from Eqn (1) based on the estimated P value. Similarly, Eqn (3) was used for the BBN distribution, based on the estimated α and β values. Then the χ 2 goodness-of-fit statistics for both the BN and BBN estimates compared with observed frequencies were calculated. For the BN frequencies, at each site, the number of degrees of freedom is the number of frequency classes, minus two (i.e. 28) and for the BBN frequencies, it is the number of frequency classes, minus three (i.e. 27), since the BBN distribution has one extra parameter. Therefore, at each site, for the BN model the corresponding critical χ 2 at P=0·05 is 41·3 (d.f.=28) and for the BBN model it is 40·1 (d.f.=27). All the BN and BBN model comparisons were made with these critical values.
PCNM approach
One aim of the present paper was to model the variation of the plant death pattern in terms of design (i.e. block, variety and cutting frequency) and the spatial structures that could be represented by PCNM eigenfunctions. The number of dead plants in each of the 64 plots at each site was mapped, and then the similarities among the plots were analysed by variation partitioning (Borcard et al. Reference Borcard, Legendre and Drapeau1992; Borcard & Legendre Reference Borcard and Legendre1994; Legendre & Legendre Reference Legendre and Legendre1998; Peres-Neto et al. Reference Peres-Neto, Legendre, Dray and Borcard2006) with respect to design and spatial variables. As explained by Borcard & Legendre (Reference Borcard and Legendre2002), this approach involves first constructing a matrix of Euclidean distances among the plots in a site. Then, a threshold is defined under which the Euclidean distances are kept as measured, and above which all distances are considered to be ‘large’, the corresponding numbers being replaced by an arbitrarily large value. This large value can be set equal to four times the threshold value (Borcard & Legendre Reference Borcard and Legendre2002). In the present study, several thresholds were tested and the best results were found when all distances larger than the distance between the centres of adjacent plots (i.e. 2 m) were replaced by four times that value (i.e. 8 m). Beyond a factor of four times the threshold for the ‘large’ distances the principal coordinates remain the same to within a multiplicative constant, and so multiple regressions using thresholds greater than four would yield the same proportion of variation (R 2) and the same P-value. The second step is to compute the principal coordinates of the modified distance matrix. This is necessary because the spatial information must be represented in a form compatible with applications of multiple regression or canonical ordination. This procedure results in several positive, one or several null and several negative eigenvalues. In the present example, 23 PCNM eigenfunctions with positive eigenvalues were generated with the first of these reflecting large-scale spatial structures and subsequent ones depicting variation at increasingly finer scales. These positive PCNMs were then used as possible explanatory variables in a multiple regression exploiting forward selection criteria to select important PCNMs. In the PCNM procedure, negative eigenvalues are not used because the coordinates of the sites along these ‘axes’ are complex numbers (Borcard & Legendre Reference Borcard and Legendre2002). First, detrended plant death data were generated considering the number of dead plants per plot as the response and coordinates of each plot as explanatory variables. In the present experiment, no significant trends were observed. Next, detrended plant death data were regressed against design and/or spatial variables. PCNM eigenfunctions and forward selection of PCNMs were computed using the ‘spacemakeR’ and ‘packfor’ packages, available under the ‘sedaR’ project on R-Forge.
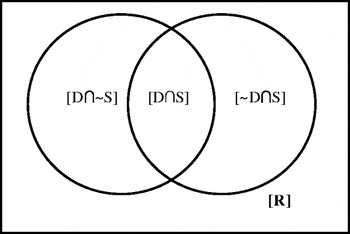
When partitioning variation, R 2 explained by the model (i.e. experimental design and spatial components) is partitioned into unique and common contributions of the sets of predictors by fitting a series of separate models or ‘canonical analyses’. For example, the first canonical analysis uses only the experimental design predictors [D]=([D∩∼S]∪[D∩S]) and thus shows how much variability is explained by just these design predictors, the second uses only the spatial components ([S]=([∼D∩S]∪[D∩S]) and thus shows how much variability is explained by just these spatial predictors and the third uses both sets of predictors (i.e. experimental design and spatial components [D∩S]) and thus shows how much variability is explained by all possible predictors (Fig. 1). All remaining fractions (i.e. experimental design-spatial covariation or ‘overlap’ ([D∩S]) and the residual component ([R]=([∼D∩∼S])) can be obtained by simple subtraction (Fig. 1) (Peres-Neto et al. Reference Peres-Neto, Legendre, Dray and Borcard2006). Variation partitioning and tests of significance of each variation source (i.e. design (block, variety, cutting frequency), spatial and residual) were computed using the ‘vegan’ library (Oksanen et al. Reference Oksanen, Kindt, Legendre and O'Hara2007) of the R statistical language (R Development Core Team 2007). The program provides the significance of the overall model and its components, using F statistics (permutation F test), and the adjusted R 2 for each source of variability (previously explained by Legendre & Legendre (Reference Legendre and Legendre1998) and Peres-Neto et al. (Reference Peres-Neto, Legendre, Dray and Borcard2006)). For each source, the adjusted-R 2 was calculated and expressed as a proportion of the total variability. Note that the ‘overlap’ [D∩S] component of explained variation does not correspond to the interaction component in a standard two-way analysis of variance for an orthogonal design, but rather to the overlapping portion of explained variance due to covariation between spatial and design variables, as would be found in a standard multiple regression analysis.
Schematic representation of the partitioning of pure design [D], pure spatial [S], covariation of design and spatial [D∩R] and residual [R] variability.

Other approaches
Fitting the data using a BN model, a BN model with random blocks and a BN model with smooth-scale spatial components, was done in SAS using Proc GLIMMIX (SAS 2010). In the standard BN model, spatial heterogeneity is accounted for by including ‘block’ in the model as a fixed effect or factor, along with our treatment factors of variety and cutting frequency. The way that spatial heterogeneity is accounted for in the BN model with random blocks and the BN model with smooth-scale spatial components can be summarized as follows.
Suppose Y represents the (n×1) vector of observed data and δ is a (r×1) vector of random effects. Models fitted by the GLIMMIX procedure assume that E[Y|δ]=g− 1(Xτ+Zδ), where g(·) is a differentiable monotonic link function (e.g. logit) and g −1(·) is its inverse. The matrix X is a (n×p) matrix of rank k, where n, p and k are the number of observations, number of independent variables and the maximum number of independent rows (or, the maximum number of independent columns) of matrix X, respectively. Z is a (n×r) design matrix for the random effects. The random effects are assumed to be normally distributed with mean 0 and variance matrix G. This model component η=Xτ+Zδ is then referred to as the ‘linear predictor’. The variance of the observations, conditional on the random effects, is var[Y|δ]=A 1/ 2RA 1/ 2. The matrix A is a diagonal matrix that contains the variance functions of the model. The variance function expresses the variance of a response as a function of the mean. The matrix R is a variance matrix specified by the user. In the model used for the present example, the R matrix used was the exponential spatial covariance matrix as specified in Proc GLIMMIX in SAS (2010). If the conditional distribution of the data contains an additional scale parameter, it can either be part of the A matrix variance functions or part of the R matrix. The GLIMMIX procedure distinguishes two types of random effects. Depending on whether the variance of the random effect is contained in G or in R, these are referred to as ‘G-side’ and ‘R-side’ random effects. R-side effects are also called ‘residual’ effects. Simply put, if a random effect is an element of δ, it is a G-side effect (i.e. random block effects in the present experiment); otherwise, it is an R-side effect (i.e. smooth-scale spatial components in the present experiment). Therefore, the unknown quantities subject to estimation are the fixed-effects parameter vector τ and the covariance parameter vector δ that comprises all unknowns in G and R. The random effects δ are not parameters of the model in the sense that they are not estimated.
This means that when fitting data to the BN model with random blocks, the assumption is made that environmental effects operate at the scale of blocks. Due to the fact that the conditional distribution (conditional on block effects) is BN, the marginal distribution will be overdispersed relative to the BN distribution. Therefore, treating the block effects as random rather than fixed, changes the estimates compared with the standard BN model (SAS 2010). When using the BN model with smooth-scale spatial components, environmental effects are modelled by adjusting the mean and/or correlation structure of experimental units. Therefore, in this approach, spatial coordinates of each plot are considered through an exponential covariance matrix (as mentioned above) and an ‘R-side’ random effects model is fitted. When assuming either random blocks and/or smooth-scale spatial components to the BN model, Proc GLIMMIX does not use maximum likelihood for estimation, but instead uses a restricted (residual) pseudo-likelihood algorithm (SAS 2010).
For the BBN model, it was assumed that the probability of a plant being dead (P i) could be described by a beta distribution. However, this is not the only assumption that can be made about to describe spatial variation in P i. Suppose, instead that logit(P i) (i.e. log(P i/(1−P i))) has a normal distribution: P i then has a logistic-normal distribution (Aitchison & Shen Reference Aitchison and Shen1980) and BN data has an LNB distribution. In this approach, an independently distributed standard normal random variable is incorporated into the model to represent spatial variation, thus reducing the residual d.f. compared with the standard BN model, and a dual quasi-Newton method is used as the optimization technique. Fitting an LNB model to the data was done in SAS using Proc NLMIXED. Details of this LNB approach can be found elsewhere (Hughes et al. Reference Hughes, Munkvold and Samita1998; SAS 2010).
Comparison of different testing approaches
Due to the fact that different approaches used different test statistics when fitting models and testing the significance of the overall model, direct comparisons among all the different approaches at this level were not possible (e.g. BN and LNB models used the Akaike information criterion (AIC), PCNM used AIC-like criterion (Dray et al. Reference Dray, Legendre and Peres-Neto2006), while the BN model with random blocks and the BN model with smooth-scale spatial components used a generalized χ 2 statistic (SAS 2010). However, this generalized χ 2 statistic was used to generate an AIC statistic (AIC=χ 2+2×number of estimated parameters) and present this information, which enables some comparison.
The main aim of the original experiment was to search for any difference in survival between the two species under field conditions. Therefore, the size of the species effect was calculated and the significance of the effect tested, using the different approaches described above, and then the results obtained were compared. The species test statistic was the species χ 2 statistic, a measure of the amount of variability explained by the species effect. The probability or significance associated with the estimated χ 2 of species effects obtained using each method was recorded and compared. These tests of the significance of the species effects are Wald-type tests, not likelihood ratio tests (Engle Reference Engle, Intriligator and Griliches1984; SAS 2010). In addition, the species χ 2 statistic from each of the alternative models was compared with that of the standard BN model (a model with blocks, varieties and cutting frequencies as fixed effects), and referred to the difference in species χ 2 between the standard BN model and each alternative model as Δχ 2.
Due to the absence of significant differences in plant death among the different cutting frequencies, the effects of cutting frequencies were not compared between models.
RESULTS
BN, BBN parameter estimates and the test for overdispersion
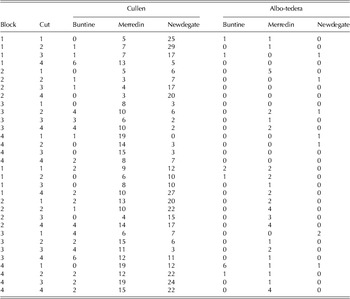
The data used for the analyses are given in Table 1. The plant death rate from different plots varied from 0·0 to 0·97, with the highest proportion at Newdegate for Cullen.
Number of dead plants in each block and cutting frequency (Cut=number of cuttings/yr) of Cullen and Albo-tedera at three sites. n=30

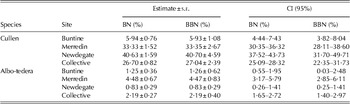
Estimated death rates of Cullen and Albo-tedera at each of the three sites, as well as across sites, under BN and BBN models are given in Table 2. Cullen had death rates of over 0.30 at Merredin and Newdegate. The mean death rates estimated by BN and BBN models for a given species and site did not differ greatly. However, standard error estimates for the mean plant death rates for the BN model were much smaller than those for the BBN model. This resulted in narrower confidence intervals for the BN model, so conclusions based on this model were likely to be over-confident and therefore misleading. For example, when comparing the sites using results derived from the BN model, the proportional plant death at all three sites differed significantly. In contrast, when comparing the sites using results derived from the BBN model, the proportional plant death at Merredin and Newdegate did not differ significantly. This highlights that the probability of the Type I error occurring is higher with the BN model than with the BBN model.
Estimates and confidence intervals (CI) of the proportion of plant death for different sites and across sites for Cullen and Albo-tedera through BN and BBN models

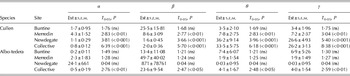
Model parameters for the beta distribution (α and β) are given in Table 3. For Cullen at Buntine and for Albo-tedera at all three sites, both α and β were not significantly different from zero. However, for Cullen at Merredin and Newdegate and for both Cullen and Albo-tedera during collective estimation across sites, α and β were different from zero. Consequently, testing for the overdispersion becomes important as it is the basis for preferring the BBN model in these situations. Results of the overdispersion test are also presented in Table 3. As discussed earlier, α and β are model parameters for the beta distribution and θ and γ are indicators of overdispersion. For Cullen at Buntine, where the death rates were very low, overdispersion was not evident. However, at Merredin and Newdegate, both θ and γ were significantly different from zero, indicating overdispersion. Furthermore, when death rates across three sites were considered (with increased heterogeneity), the significance of θ and γ increased further compared with analysis within sites (higher t 0·05 values). For Albo-tedera when individual sites were considered, both θ and γ were not significantly different from zero at any site, indicating the absence of overdispersion among plots within a site. However, when death rates were tested across all three sites, θ and γ became significant, indicating overdispersion. At all times, information on overdispersion obtained through θ and γ was consistent.
Estimates (Est; ±s.e.m.) of the beta distribution parameters (α and β), variance of the BBN distribution (θ) and a measure of the overdispersion (γ) together with s.e.m. for Cullen and Albo-tedera tested at three sites, as well as for aggregated data across sites (Collective). The significance of each parameter estimate is also given in parentheses; ns, not significant

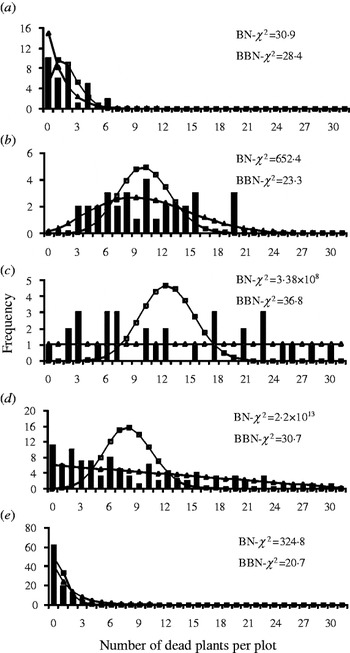
Expected plant death frequencies calculated from BN and BBN models using the parameters estimated in Tables 2 and 3 are presented in Fig. 2. For Cullen, goodness-of-fit of BN and BBN models were tested for all three sites as well as for the analysis across three sites. For Albo-tedera, since overdispersion was found only during the analysis across sites, goodness-of-fit of the BN and BBN models was tested only at this level. For Cullen at Buntine, with very low plant death rates, both BN and BBN models described the death rates equally well (χ 2=30·9 and 28·4 for the BN and BBN models, respectively) and were below the critical χ 2. However, for Merredin, the BBN model described the death rates much better than did the BN model (χ 2=652·4 and 23·2 for the BN and BBN models, respectively). The BBN model also described the death rates better for Newdegate (χ 2=3·4×108 and 36·8 for the BN and BBN models, respectively). Comparison across sites also revealed that the BBN model fitted the Cullen data better than did the BN model (χ 2=2·2 ×1013 and 30·7 for the BN and BBN models, respectively). Furthermore, for Cullen, the BN model overestimated death rates at the centre of the distribution and underestimated the death rates towards the end in most instances. This caused the BN model to provide expected frequencies further from observed frequencies. Similar to the explanation for Cullen across sites, the BBN model provided a much better description of the Albo-tedera death rates across sites than did the BN model (χ 2=324·8 and 20·7 for BN and BBN models, respectively).
Observed (black bars), BN (line with squares) and BBN (line with triangles) frequency of dead plants of (a) Cullen at Buntine, (b) Cullen at Merredin, (c) Cullen at Newdegate, (d) Cullen across sites and (e) Albo-tedera across sites. Goodness-of-fit statistics for the BN and BBN are also given, where the critical values were χ 0·05,292=42·6 and χ 0·05,282=41·3 for the BN and BBN models, respectively.

PCNM approach
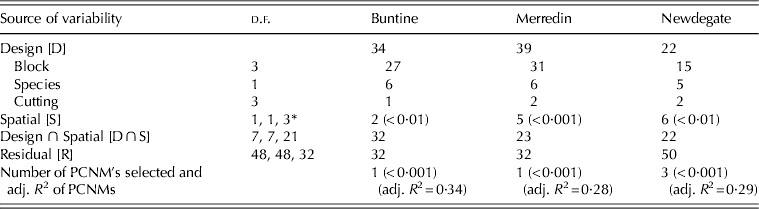
Twenty-three eigenvectors with positive eigenvalues were retained as spatial descriptors to be used in the variation partitioning of the plant death rate data at each site (data not shown). However, among those spatial descriptors, only one PCNM for each of Buntine and Merredin (V23 (adj. R 2=0·34), and V2 (adj. R 2=0·28), respectively) and three PCNMs for Newdegate (V5, V7 and V23 (adj. R 2=0·29)) were identified as having a significant positive spatial correlation with the de-trended plant death data through the forward selection criteria (Table 4). The proportions of variance explained by each source of variability at the three sites are given in Table 4. Design variables explained 0·34, 0·39 and 0·22 of the total variability at Buntine, Merredin and Newdegate, respectively, with a higher contribution from blocks. The components of the total variability explained by pure species effects were 0·06, 0·06 and 0·05 and cutting frequency were 0·01, 0·02 and 0·02 at Buntine, Merredin and Newdegate, respectively. The variability explained by both design and spatial components (design ∩ spatial) were 0·32, 0·23 and 0·22, while those explained by pure spatial effects were 0·02, 0·05 and 0·06 at Buntine, Merredin and Newdegate, respectively. The ‘overlap’ in explained variability with spatial components were calculated for each design variable (i.e. block ∩ spatial, species ∩ spatial and cutting frequency ∩ spatial), but only the block ∩ spatial effect was significant, while other effects were close to zero and insignificant (data not shown).
Proportion of variance explained by each source of variability at the three sites. Design variables used in the experiment were block, species and cutting frequency. For ‘spatial’ component of variability and PCNM selected; values within parenthesis are the probability derived through permutation F tests
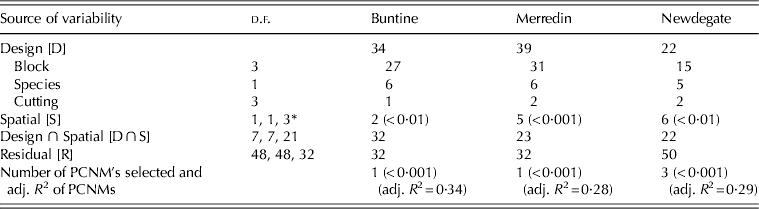
* Indicates the number of PCNM's selected (d.f.) for Buntine, Merredin and Newdegate, respectively.
Comparison of different approaches when testing ‘species’ effects
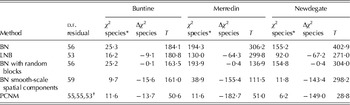
When comparing the overall model predictions using AIC at Merredin and Newdegate, the two sites with higher plant death rates, the LNB model was an improvement over the BN model. At all three sites, predictions made under PCNM were an improvement according to the AIC-like criteria (Table 5). Due to the fact that the BN model with random blocks and the BN model with smooth-scale spatial components used a generalized χ 2 statistic (SAS 2010), direct overall model comparisons with the standard BN and LNB models were not possible. However, when comparing the BN model with random blocks and the BN model with smooth-scale spatial components, model prediction was improved with the BN model with smooth-scale spatial components while conserving more residual d.f. (Table 5).
Residual d.f., test statistic for ‘species’ effect (χ2-species), improvement of the prediction of species effect compared with standard BN model (Δχ2-species) and the overall model test statistic (T) under different methods. Note: Model fit statistics (T) are AIC for the BN and LNB; AIC-like criterion for PCNM; AIC, derived from generalized χ2, for the BN model with random blocks and the BN model with smooth-scale spatial components

*χ 2 species at three sites for all the methods were significant at P<0·001.
† d.f. are 55, 55 and 53 for Buntine, Merredin and Newdegate, respectively.
When testing for species effects at all three sites, under the standard BN model, a significant difference in plant death rate between the two species was found (χ 2 of 25·3, 194·3 and 155·2 at Buntine, Merredin and Newdegate, respectively, P<0·001 in all cases) (Table 5). In general, incorporation of spatial variability into the model (e.g. random blocks, smooth-scale spatial components, PCNM eigenvectors or an aggregation parameter at LNB), reduced the estimated species χ 2 statistic compared with that of the standard BN model, but the species effect remained highly significant. For example, when the species effects were compared using the LNB model, they still remained significant, although species accounted for less of the overall variation (Wald test species χ 2 lowered) at all three sites compared with that under the standard BN model (Table 5). The use of the BN model with random blocks, to account for spatial variability at the scale of blocks (‘G-side’ random effects), showed species accounting for a similar amount of the overall variation compared with that of the standard BN model. However, using the BN model with smooth-scale spatial components (‘R-side’ random effects) showed species accounting for a smaller amount of the overall variation (lower Wald test species χ 2 than those with the BN model, LNB model and the BN model with random blocks) (Table 5). In the PCNM approach, the spatial component also accounted for some of the variability attributed to species in the standard BN model, meaning a reduced species χ 2 (Δχ 2 of −13·7, −182·7 and −149·0 at Buntine, Merredin and Newdegate, respectively). Furthermore, at Merredin the species effect obtained through the PCNM approach was even smaller than that obtained using the BN model with smooth-scale spatial components (Δχ 2=−27·3), while at Buntine and Newdegate the predictions made through both approaches were similar.
DISCUSSION
Testing for overdispersion
Overdispersion in plant death rates was found for Cullen at Merredin and Newdegate: both sites with high mean death rates. Overdispersion was also found for Cullen and Albo-tedera when analyses were performed across sites. The descriptions provided by the BBN distribution were a significant improvement over the BN distribution. This was true over a range of data from single sites (at Merredin and Newdegate for Cullen where death rates were relatively high and diverse) as well as across sites (for both Cullen and Albo-tedera). These results highlight that although randomized trials have been established as the ‘gold standard’ for agricultural evaluations, comprehensive assessment is required when combining BN data from different sites and/or plots.
The standard errors of the mean death rate derived for the BN distribution are generally not trustworthy for making inferences when overdispersion prevails. This was very clearly illustrated when comparing the Merredin and Newdegate sites as the BN model showed a difference in plant death rates between sites, while the BBN model did not (Table 2). It is also illustrated by the fact that the BN model tended to overestimate plant death rates at the centre of the distribution and underestimate plant death rates towards the end when overdispersion was present. In general, narrow standard errors for the BN distribution, not supported by data, will tend to lead to the over-detection of real treatment effects (i.e. increase the chance of Type I error occurring) in designed experiments (e.g. species, sites and densities).
Plant death rates at Buntine for Cullen and at all three sites for Albo-tedera were very low and overdispersion was not detected, suggesting a truly random pattern of plant death. In such instances the BBN model did not perform better than the BN model, and the use of the BBN distribution was therefore superfluous.
The main reason for adopting the BBN distribution would be for estimating overall mean plant death rates with correct confidence intervals for given species at given sites or across a number of sites in a given region. The present results show that estimates based on a simple BN model will not be valid for heterogeneous BN data. However, one might also wish to examine whether, and to what extent, specific attributes of the study (e.g. species, cutting, site and within-site spatial variability) had a meaningful impacts on death rates. This is discussed below.
PCNM approach to explore the spatial variability (variation partitioning) in designed field experiments in agriculture
The PCNM analysis is a powerful tool for analysing spatial variation in the occurrence of plant death in designed experiments. When applying the PCNM approach in ecology, ‘environmental’ variables (e.g. soil characteristics, elevation and weather) are considered as explanatory variables. For the present application, ‘design’ variables (i.e. blocks, species and cutting frequencies) were considered instead of environmental variables. Apart from this, there was no difference in the way this technique was applied to designed agricultural experiments to the way it has been applied in ecological studies.
Even though the source ‘block’ itself accounts for a certain level of spatial variability at a relatively coarse scale (i.e. 0·27, 0·31 and 0·15 at Buntine, Merredin and Newdegate, respectively), by incorporating the block effect as a design variable in the model (as a separate source) an exploration of the extra spatial variability explained by the PCNM approach which was not taken into account by relatively coarse-grained blocks was possible. The significance of this ‘pure spatial variability’ detected by the PCNM approach (Table 4) highlights the existence/occurrence of spatial variability at a finer scale than does the scale of blocks. Furthermore, the high proportion of variability that was explained by both the design and spatial effects (design ∩ spatial) (0·32, 0·23 and 0·22 at Buntine, Merredin and Newdegate, respectively) is probably associated with the spatial arrangement of species and cutting frequencies across a site. However, it is important to note that the pure spatial variability was still significant (Table 4). After partitioning the total variability of plant death to spatial and design sources, a considerable proportion still remained unexplained (i.e. 0·32, 0·32 and 0·50 at Buntine, Merredin and Newdegate, respectively). This unexplained variability must be due to other biological or environmental factors that were not measured and were either non-spatially structured or structured at too fine a resolution to be detected with the number of eigenvectors available. Ultimately, the PCNM approach was able to explain a significant proportion of the total variability (i.e. pure spatial and spatial-design covariance), which could not be explained by other sources (e.g. blocks, species and cutting frequency).
Testing for design variables is done against the residual in a standard ANOVA. In a standard block design, ‘nuisance’ variability due to coarse-grained spatial variability is removed from the residual, at the cost of a few d.f., which increase the power of the test if there is indeed spatial variation at the scale of blocks. In the PCNM analysis here, another portion of finer-scaled ‘nuisance’ spatial variability could be accounted for, resulting in a further reduction in the residual variability compared with the conventional method, and thus increased power and a corresponding increase in the significance of design variables.
Inflated type I error is caused when both response and design variables are autocorrelated (Dutilleul Reference Dutilleul1993). If hidden covariates (e.g. soil physical and chemical characteristics) are correlated with the design matrix then again an inflated type I error can occur, but this is due to their effect on the response rather than directly due to hidden covariates. However, if the hidden covariates affect the response but do not correlate with the design matrix and the design is not autocorrelated, then there is no type I error (Dutilleul Reference Dutilleul1993). In the present experiment, no spatial heterogeneity was detected in soil physical and chemical characteristics (e.g. covariates) among plots in a site. Also, there was no correlation between these covariates and design variables. This indicates that there was no spatial autocorrelation in environmental variables studied and only the response variable (i.e. number of dead plants out of total number in a plot) was autocorrelated in the present experiment. For this reason, no inflated type I error was expected to occur in the present experiment and therefore the test of significance in the experiment is valid, as explained by Legendre et al. (Reference Legendre, Dale, Fortin, Gurevitch, Hohn and Myers2002) and Peres-Neto & Legendre (Reference Peres-Neto and Legendre2010). However, when design and response variables are autocorrelated, and/or covariates are correlated with design matrix one should consider the occurrence of inflated type I error in the analysis and adjustments should be made (Dutilleul Reference Dutilleul1993). However, PCNMs reflect or represent the effects of missing covariates. One missing covariate can be represented by the mix of one to several PCNMs and therefore the d.f. may be too conservative and decrease statistical power. In designed field experiments, one way to reduce this drawback is through increased replication. However, further testing of this method for agricultural experimentation is warranted.
Comparison of different approaches when testing the species effects
Due to the fact that different approaches used different test statistics when fitting models (i.e. BN and LNB approaches used AIC, PCNM used AIC-like criterion as the test statistic, while the BN model with random blocks and the BN model with smooth-scale spatial components used generalized χ 2), direct comparison of the significance/improvement of the overall model generated under different approaches was not possible. However, when comparing the BN model and LNB model, LNB model was an improvement over the BN model as explained by Hughes et al. (Reference Hughes, Munkvold and Samita1998). Similarly, the BN model with smooth-scale spatial components was an improvement over the BN model with random blocks. Interestingly, across all models, a Wald-type χ 2 statistic of species effects could be generated, and therefore the species effect could be tested and compared. This is an important consideration, because in field experiments in agriculture the prime objectives are to differentiate the treatment effects (e.g. species) to make better inferences (SAS 2010) and to understand the underlying biological processes (Garrett et al. Reference Garrett, Madden, Hughes and Pfender2004). It is interesting to note that in all cases the species effect was highly significant, despite the fact that the size of the effect was greatly reduced in some of the models that took spatial variability into account (i.e. LNB, PCNM and the BN model with smooth-scale spatial components).
The size of the estimated species effect was greatly reduced when using the BN model with smooth-scale spatial components and PCNM compared with the standard BN model. However, assuming blocks to be random rather than fixed effects did not account for any extra-spatial variability, and thus did not reduce the estimated species effect. These results provided further evidence for the occurrence of finer-scale spatial patterns in plant death, smaller than the size of a block, and for the ability of the BN model with smooth-scale spatial components and the PCNM approach to capture it. From the coarse layout of the experimental area, it is not surprising that using the BN model with random blocks alone did not account for the overdispersion of the data. As far as the present authors are aware, this is the first attempt to use the PCNM approach to explore the spatial variability in a designed agricultural field experiment. As observed in the present paper, results obtained through the PCNM approach are similar (even better at Merredin) to the alternative best approach, the BN model with smooth-scale spatial components (Table 5). Therefore, the PCNM approach seems to provide a novel way to partition variation in plant death data and identify design effects in agricultural experimentation, and it could be a useful alternative to the other better-known approaches such as BN model with smooth-scale spatial components. Model prediction of species effects obtained through the LNB model was also satisfactory (better than the BN model prediction although not as good as the PCNM and BN model with smooth-scale spatial components approaches). It is also important to note that, even though the BN model with smooth-scale spatial components and PCNM approaches generated better predictions of species effects than other approaches, the PCNM approach used more d.f. in the model (depending on the number of PCNMs selected into the model), while smooth-scale spatial components with the BN model conserved the highest residual d.f. because this approach models the covariation directly (SAS 2010) (Table 5).
The survival of a plant under different environmental conditions is a major determinant used in selecting and breeding crops and pastures for diverse environments. One way to evaluate the performance (survival) of species is to conduct experiments in different environments and evaluate their performances (survival) (Li et al. Reference Li, Lodge, Moore, Craig, Dear, Boschma, Albertsen, Miller, Harden, Hayes, Hughess, Snowball, Smith and Cullis2008). In the present experiment, plant death was assumed to occur for various reasons, including unfavourable weather (drought during the summer and frost during the winter) and soil characteristics (acidity, nutrient imbalances), as well as, to a lesser extent, the occurrence of disease. Spatial variability in the degrees of severity of these factors during the study period is, presumably, responsible for some of the differences in death rate among plots and sites. The results show the advantage of using appropriate statistical analysis techniques in such circumstances.
Concluding remarks
When studying the occurrence of plant death rates in crops or pastures across multiple plots/sites, one must consider the possible existence of overdispersion and the adequacy of the BN distribution. This is equally true for any BN data set, such as survival rates, germination rates or disease rates. Results generated using models that do not account for overdispersion are not valid when overdispersion remains after the effects of design variables are accounted for. The BBN distribution can be used to detect overdispersion in the data, and to analyse overdispersed data when overdispersion cannot be accounted for by using methods that take autocorrelation into account. PCNM can be used to account for autocorrelation by partitioning the variance into experimental factors, and large- and small-scale spatial effects, and results in the present case indicate, for the first time, that the method may be useful for designed experiments. The BN model with smooth-scale spatial components also showed promise as a method for detecting experimental effects, while accounting for spatial variation. The performance of the LNB model was better than that of the simple BN model. Finally, it is concluded that a range of models that account for spatial patterns should be used to explore spatial variability of plant death in designed field experiments, including LNB, BN model with smooth-scale spatial components and PCNM. Only by testing and comparing a number of such models, can the best model for a particular data set be identified.
We thank two anonymous reviewers for their constructive comments. The study was supported by the School of Plant Biology and the Future Farm Industries Cooperative Research Centre at The University of Western Australia. L. D. B. Suriyagoda also appreciates the SIRF/UIS Scholarship awarded by the University of Western Australia and further scholarship support from the late Frank Ford. B. L. Peiris assisted in installing SAS Macro-BETABIN and Daniel Real and Richard Bennett provided the seeds of Albo-tedera and Cullen as well as assistance in field works.