The traditional definition for ventilator-associated pneumonia (VAP) is neither sensitive nor specific.Reference Klompas 1 Approximately 50% of patients with a diagnosis of VAP do not have pneumonia (the gold-standard being pathologic diagnosis at autopsy) but rather a variety of other pathologies such as acute respiratory distress syndrome (ARDS), pulmonary edema, atelectasis, pulmonary emboli (PE), hemorrhage, contusion, malignancy, or pneumonitis, among others.Reference Tejerina, Esteban and Fernandez-Segoviano 2 – Reference Rao, Ritter and Kollef 4 Furthermore, a third of mechanically ventilated patients with autopsy-confirmed pneumonia were not identified as having pneumonia by traditional VAP criteria.Reference Tejerina, Esteban and Fernandez-Segoviano 2 Public reporting, benchmarking, and pay for performance programs have amplified concerns about traditional VAP surveillance definitions. These initiatives generate substantial explicit and implicit pressures to lower VAP rates. These pressures may bias infection preventionists’ (IP) interpretations, consciously or unconsciously, of subjective clinical VAP criteria. Furthermore, initiatives directed at stricter surveillance may lead to lower rates of VAP despite no actual change in patient care.Reference Klompas 5 Many report that implementing VAP bundles results in improved VAP rates but no other patient outcomes such as survival, hospital length of stay, or ventilation days. Thus, reductions in VAP might reflect changes in surveillance methods or criteria as opposed to actual reductions in pneumonia rates.Reference Klompas 5
Due to limitations of traditional VAP surveillance, the Centers for Disease Control and Prevention (CDC) developed new surveillance criteria focusing on complications of mechanical ventilation in general termed (as opposed to pneumonia specifically) ventilator-associated events (VAEs). VAEs represent respiratory deterioration after a period of baseline respiratory stability or improvement has been established. VAEs encompass a broad spectrum of complications among ventilated patients in addition to pneumonia, including atelectasis, ARDS and pulmonary edema.Reference Klompas, Khan and Kleinman 6 , Reference Hayashi, Morisawa and Klompas 7
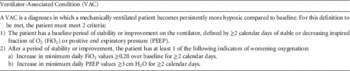
VAEs are categorized into 4 types of events.Reference Magill, Klompas and Balk 8 A ventilator-associated condition (VAC) is defined by an increase in fraction of inspired oxygen (FiO2) or positive end-expiratory pressure (PEEP) after a period of respiratory stability. Infectious ventilator-associated conditions (IVACs) occur when a VAC includes infectious characteristics such as fever or elevated white blood cell count and the initiation of antimicrobial treatment. Possible and probable VAPs are IVACs with more specific respiratory criteria such as purulent secretions and positive respiratory cultures or serologies (Table 1). It is important to note that the VAE possible and probable VAP definitions are distinct from the traditional CDC VAP definition.
Ventilator-Associated Condition Definition

The new VAE surveillance definitions focus on ventilator-related patient complications in general, and surveillance criteria are relatively objective and reproducible, making surveillance more objective and reproducible. This method allows for more meaningful comparisons among different institutions. It also affords automated surveillance opportunities, which can reduce the time and resources needed for conducting surveillance by IPs.
Because VAE surveillance is based primarily on objective data, VAE data collection is significantly less time-consuming than traditional VAP data collection. As part of the CDC Prevention Epicenters Program, Klomas et alReference Klompas, Khan and Kleinman 6 compared traditional VAP surveillance to surveillance for an event similar to VAC. In the 2 hospitals that recorded time required for surveillance, the VAP reviewer required 260 hours to assess 400 patients (a mean of 39 minutes per patient). The VAC reviewer required 12 hours to assess 400 patients (mean, 1.8 minutes per patient). Notably, VAC surveillance conducted in this study was manual. Automatic data collection processes can further reduce the time needed for VAC surveillance.
Many components of VAE surveillance have the potential to be performed using automated hospital data; however, the optimal methods for abstracting, charting, and analyzing automated data with regard to VAC surveillance remain unclear. To perform VAC surveillance optimally and efficiently, reliable automated algorithms are needed. The objectives of this study were to develop and implement an automated method for VAC surveillance that is objective and reliable, and to compare the accuracy and efficiency of automated VAC surveillance with manual VAC surveillance.
METHODS
Study Setting
This study was conducted from August to October 2013. The Detroit Medical Center (DMC), located in Midtown Detroit, Michigan, has more than 2,000 licensed beds, 3,000 affiliated physicians, and more than 12,000 employees. The DMC is affiliated with the medical schools of Wayne State University and Michigan State University. The DMC includes 8 sites. The following sites were utilized for this study: DMC Detroit Receiving Hospital (273 beds), DMC Harper University Hospital (470 beds), DMC Sinai Grace Hospital (383 beds), and DMC Huron Valley-Sinai Hospital (153 beds). These sites had a total of 128 intensive care unit (ICU) beds. In the DMC system, all patient data are charted electronically via an electronic medical record system (CIS). The study was approved by the Wayne State University Institutional Review Board.
Surveillance for VAC using manual data collection was performed by IPs, who reviewed daily minimal FiO2 and PEEP values for every ventilated patient and establishing whether VAC criteria according to NHSN were met.
Gold Standard for VAC Events
All episodes of mechanical ventilation were reviewed by an intensivist. All data pertaining to changes in FiO2, PEEP, and other mechanical ventilation parameters in study hospitals during the study period were reviewed by an intensivist who determined whether or not a VAC was present.
Development of the Automated VAC Algorithm
A work group was formed to develop and refine a system for VAC surveillance. The work group consisted of intensivists, IPs, respiratory therapists, ICU nurses, infection control (IC) specialists, and programmers. The work group established the most accurate source for ventilator data. At the beginning of the study period, ventilation data, as recorded by both nurses and respiratory therapists, were entered manually into the patient charts. Although respiratory therapist data were more accurate, the accuracy of manual charting of daily minimal PEEP and FiO2 was inconsistent. Subsequently, an EMR module was developed for the RTs to chart data directly into the EMR. Data collected directly from the electronic chart were deemed the most accurate. The automated VAC algorithm was developed using the RT data entered directly into the EMR.
A program was created to extract the minimal daily FiO2 and PEEP values from the EMR (Cerner Power Chart, Cerner, Kansas City, MO), which generated a weekly report for all ventilated patients in every unit. The development of this program required approximately 40 hours of programming time. SAP Business Objects software SAP AG, Walldorf, Germany) was used to abstract minimal FiO2 and PEEP data from the EMR. This software is a relational database-based query and analysis tool. It is incorporated into the EMR and is used to query and analyze specific data from the EMR using structured query language SQL script. All of the fields for queries are chosen by identifying specific clinical event codes (eg, for PEEP and FiO2). Initial queries pull all of the PEEP and FiO2 values into a table, including patient identifiers and dates for which the values were obtained. From the table, the minimal PEEP and FiO2 values for patients on a given calendar day are abstracted. This report is automatically run by InfoView software (InfoView Systems, Inc., Livonia, MI) once per week. At this point, data for the prior 10 days are abstracted. The 10-day abstraction period is used to avoid missing VACs for initial 3 days of the week because VAC needs a sequence of 4 days to establish a period of stability and a period of worsening oxygenation and/or PEEP. These data are exported to an Excel (Microsoft, Redmond, WA) table and then are imported into Access software (Microsoft). Analytic algorithms are run within Access to identify VACs.
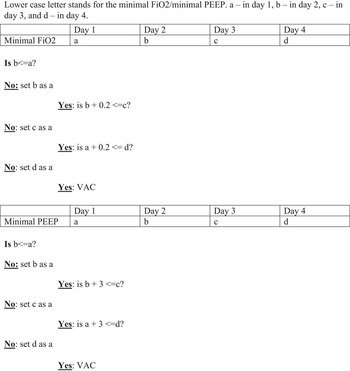
The VAC work group implemented precise definitions for “baseline stability” and “deterioration” through careful review of CDC documents and through direct correspondence with CDC personnel when clarification was needed for VAC criteria. A mathematical algorithm was developed to identify all VACs according to the NHSN criteria (Figure 1). Days 1 and 2 represent the baseline period; days 3 and 4 represent the respiratory deterioration period. This algorithm was implemented into an Access database query. The query was run weekly on the minimal FiO2 and PEEP report abstracted from the EMR.
Mathematical VAC algorithm.

Analysis and Statistics
The automated VAC algorithm was implemented and utilized for 1 month on all study hospitals (September 2013) on a total of 992 ventilation days. Data regarding PEEP and FiO2 were collected and reviewed separately for each patient to simplify the analysis. For each patient, there were 2 sets of data (1 for FiO2 and 1 for PEEP). Each data set was defined as a case. The results of the automated algorithm were validated by an intensivist. Concurrently, VAE surveillance was conducted by 2 IPs and 1 IC fellow, who were blinded to one another’s findings and to the automated VAC algorithm results. The VACs identified by the 2 surveillance processes were compared and contrasted, and the time spent conducting surveillance was also recorded. Interobserver agreement was quantified using the κ statistic.
RESULTS
During the study period, ventilation data for the entire month of September 2013 were used from all the study hospitals. During this month, 110 patients were mechanically ventilated and evaluated for VAC for a total of 992 ventilator days. Because PEEP and FiO2 data were analyzed separately, a total of 220 cases were evaluated for VAE. The automated VAC algorithm identified 39 VACs (Table 2). Compared to the gold standard of intensivist review, the automated VAC algorithm had a sensitivity, specificity, positive predictive value (PPV) and negative predictive value (NPV) of 100%. In comparison, only 46.2% of VACs were identified by IP 1; 82% were identified by IP 2; and 48.7% were identified by the IC fellow. In addition, 2 VACs were falsely identified by IP2 and 5 VACs were falsely identified by the IC fellow. No true VACs were identified by the IPs or the IC fellow that were not identified by the automated VAC algorithm.
Comparison of Automated and Manual Ventilator-Associated Condition (VAC) SurveillanceFootnote a

NOTE: IP, infection preventionist; IC, infection control.
a Total validated VACs=39; total ventilated patients=220.
b κ values were as follows: IP 1 and IP 2=0.656; IP 2 and IC fellow=0.605; IP 1 and IC fellow=0.911.
Compared to the automated VAC algorithm, the combined manual surveillance efforts of the IPs and IC fellow resulted in an average detection rate of 58.9%, with a PPV of 91% and an NPV of 92%. Whereas the automated system had a sensitivity and specificity of 100%, the manual surveillance had a sensitivity of 59% and specificity of 99%. In addition, there was a great deal of variability in VAC reporting by different team members. An analysis using κ statistics was performed (Table 2). The most common error made by IPs and the IC fellow involved incorrectly using the highest values for PEEP or FiO2 at baseline (instead of lowest). Another common error occurred when FiO2 requirements improved in a given patient from the previous day but remained above baseline by more than 20%. Such instances were not counted as VACs, but they should have been.
Automated surveillance was extremely efficient from a time perspective: on average, it took only 1 minute to run the automated software on the entire month’s FiO2 and PEEP results. In contrast, the average time spent by an IP on those same results was 60.7 minutes.
DISCUSSION
We have described an automated algorithm used to detect VACs from patient electronic ventilator records charted in the EMR. The charting of these data is part of the routine workflow for respiratory therapists. This study demonstrates that the automated process is more efficient, reproducible, and accurate than manual processes.
The major advantages of the automated process are the notable IP time saved and the improved accuracy of surveillance. The automated VAC report is uniform and objective and is not subject to individual interpretation. This objectivity and reproducibility are essential when quality control is sought; they will aid in meaningful comparisons of VAC rates among different units within a hospital and of VAC rates among different hospitals, and they will facilitate evaluation of VAC rates over time for an individual ICU or hospital.
Through the process of automating VAC surveillance, important lessons were learned. When determining whether a VAC has occurred, changes compared to stable baseline should be taken into account, as well as changes from day to day during a period of decompensation. When developing our automated algorithms, we confirmed with the CDC that the increase should be above the highest value of the baseline period and not the last day of the baseline period. We also noted that manual entry of ventilator data was more accurate as recorded by respiratory therapists than by nurses. However, when manual data were extracted by IPs, ventilator values were missed or transcribed inaccurately. Direct entry of ventilator data into the EMR by respiratory therapists, and utilization of these automated data for VAC surveillance was the most efficient, accurate, and reliable process. Another issue pertained to the CDC limiting the occurrence of VAC events to 1 for every 14-day interval. For an individual patient, if VAC criteria are met twice within 14 days, only the first episode should be reported.
The automated algorithm has limitations. Duplicate events (ie, VACs occurring twice within a 14-day period in the same patient) were included in this study. The time that would have been needed to manually remove these duplicate events was not captured. The algorithm system was not completely automated, as respiratory therapists manually entered ventilator data into the EMR. Technology exists to automate ventilator data directly into the EMR, and future automated algorithms should take advantage of this technology. In addition, the automated algorithm flags all events, so IPs have to manually remove VACs that occur within this 14-day refractory period. We did not create an automated algorithm for IVAC because IPs do this manually once they receive the VAC list. However, development of a fully automated IVAC process is under development.
In terms of objectivity and reproducibility, surveillance for VACs provides significant improvement compared to that for traditional VAP. Implementation of an automated algorithm for VAC surveillance can optimize the sensitivity and specificity of VAC identification and can also decrease the amount of IP time needed to conduct surveillance. Although adjustments in the automated VAC algorithm will be needed if criteria are modified by the CDC, this study demonstrates that automated VAC surveillance is an optimal surveillance method and is ready for extensive implementation.
ACKNOWLEDGMENTS
Financial Support: This project was supported in part by a grant from CareFusion.
KSK was supported by the National Institute of Allergy and Infectious Diseases (NIAID; DMID No. 10-0065).
Potential conflicts of interest: All authors report no conflicts of interest relevant to this article.