It is commonly known that the size of the pupil increases and decreases with changes in luminance (i.e., the light reflex). Unknown to many, however, is the fact that dilation of the pupil in the magnitude of less than a millimeter also occurs as a result of cognitive activity. This may not be remarkable but many studies now have shown that the magnitude of dilation is correlated with the amount of mental effort associated with solving a particular task. For example, Hess and Polt (Reference Hess and Polt1964) observed the pupil size of subjects solving arithmetic problems. They found that solving more difficult problems was consistently associated with a larger increase in pupil diameter than solving relatively easy problems. This and similar observations by researchers in the 1960s showed that pupil dilation is a reliable dependent variable in cognitive and linguistic research.Footnote 1
The first studies using pupillometry, however, were rather time consuming, as they required photographing the pupil in 0.5 to 1.0 s intervals, which is a rather low temporal resolution, and then measuring the pupil diameter of each image with a ruler by hand. Because this procedure could result in 20,000 to 100,000 measurements for one experiment, many hours of labor had to be invested (Beatty & Lucero-Wagoner, Reference Beatty, Lucero-Wagoner, Cacioppo, Tassinary and Berntson2000, p. 147). This may explain why pupillometry never became popular with researchers until recently. Today, most eye-trackers also record the pupil diameter and this with a temporal resolution of 60 to 1,000 Hz, which has made pupillometry a viable option for those studying cognitive processes. However, in the field of second language acquisition (SLA) the method is still virtually absent and so the purpose of this review is to introduce pupillometry for those unfamiliar with this method and to provide an overview of linguistic studies that have employed pupillometry to give an idea of the kinds of research questions the method can address. The advantage of pupillometry over other methods is that changes in pupil size provide a continuous measure of cognitive activity with high temporal resolution while the cost is much lower compared to electro-physiological recording equipment, especially for departments that already possess eye-tracking equipment. In addition, pupillometry can be combined with many tasks that SLA researchers already use and so it can provide data in addition to response times (RTs) and accuracy judgments.
PHYSIOLOGICAL BACKGROUND
This section provides a brief overview of how changes in pupil diameter relate to cognition. Constriction and dilation of the pupil is controlled by the autonomic nervous system. Activation of the sympathetic system leads to an increase in pupil diameter by ways of the radial dilator muscles of the pupil and decreased activity causes relaxation of these muscles. By contrast, the sphincter muscle, responsible for active constriction of the pupil, is controlled by the parasympathetic system. Thus, the pupil diameter at any point in time reflects the combined activity of the sympathetic and parasympathetic systems (Beatty & Lucero-Wagoner, Reference Beatty, Lucero-Wagoner, Cacioppo, Tassinary and Berntson2000). The pupil diameter can vary between 1 mm and 9 mm in humans as a function of ambient light (Beatty, Reference Beatty1982).
It is generally assumed that pupil dilation in response to cognitive activity is modulated by the brainstem nucleus locus coeruleus (LC) via its connection to both sympathetic and parasympathetic pathways through projections to the spinal cord and the Edinger Westphal nucleus (Samuels & Szabadi, Reference Samuels and Szabadi2008a, Reference Samuels and Szabadi2008b; Wang & Munoz, Reference Wang and Munoz2015), although it may also be that LC and autonomic circuits receive input from a common source, possibly the nucleus paragigantocellularis (Gilzenrat, Nieuwenhuis, Jepma, & Cohen, Reference Gilzenrat, Nieuwenhuis, Jepma and Cohen2010; Joshi, Li, Kalwani, & Gold, Reference Joshi, Li, Kalwani and Gold2016). Evidence for the link between LC activity and pupil dilation comes from electrophysiological and neuroimaging studies that have found a strong correlation between LC activity and pupil size (Aston-Jones, Rajkowski, & Cohen, Reference Aston-Jones, Rajkowski and Cohen1999; Murphy, O’Connell, O’Sullivan, Robertson, & Balsters, Reference Murphy, O’Connell, O’Sullivan, Robertson and Balsters2014); and, more recently, researchers showed that electrical microstimulation of the LC evoked changes in pupil size in monkeys (Joshi et al., Reference Joshi, Li, Kalwani and Gold2016). The LC is the primary source of the neuromodulator norepinephrine (NE; also called noradrenaline) to the neocortex (Aston-Jones & Cohen, Reference Aston-Jones and Cohen2005; Gilzenrat et al., Reference Gilzenrat, Nieuwenhuis, Jepma and Cohen2010; Joshi et al., Reference Joshi, Li, Kalwani and Gold2016; Murphy et al., Reference Murphy, O’Connell, O’Sullivan, Robertson and Balsters2014; Nassar et al., Reference Nassar, Rumsey, Wilson, Parikh, Heasly and Gold2012; Samuels & Szabadi, Reference Samuels and Szabadi2008a). NE, in turn, has been implicated in several cognitive functions such as memory consolidation and retrieval, working memory, and attention (Cohen Hoffing & Seitz, 2015; Sara, 2009; Sara & Bouret, 2012). Recently, a role of the superior colliculus in mediating the pupil response concomitant with cognitive activity has also been implicated (Wang & Munoz, Reference Wang and Munoz2015).
Two different states in the LC-NE system can be distinguished, tonic and phasic (Aston-Jones et al., Reference Aston-Jones, Rajkowski and Cohen1999). Tonic activity is believed to reflect arousal state or fatigue in an individual, whereas phasic activity reflects cognitive and emotional processes (Granholm & Steinhauer, Reference Granholm and Steinhauer2004). With respect to experimental research, slow changes in absolute pupil diameter during an experiment may indicate the level of fatigue an individual is experiencing in response to the cognitive demands of a task (McGarrigle, Dawes, Stewart, Kuchinsky, & Munro, Reference McGarrigle, Dawes, Stewart, Kuchinsky and Munro2016). However, researchers are usually interested in phasic changes in pupil diameter, which occur rapidly in response to the demands of a situation or task. As suggested by the studies cited in the preceding text, NE levels are correlated with pupil dilation and phasic LC activity can be inferred by subtracting the pupil diameter during a task (e.g., naming a picture, listening to a sentence) from a baseline value, which usually is the pupil diameter right before a participant engages in a certain task. Thus, what researchers are interested in is the magnitude of pupil dilation associated with a cognitive task, also referred to as task-evoked pupil response.
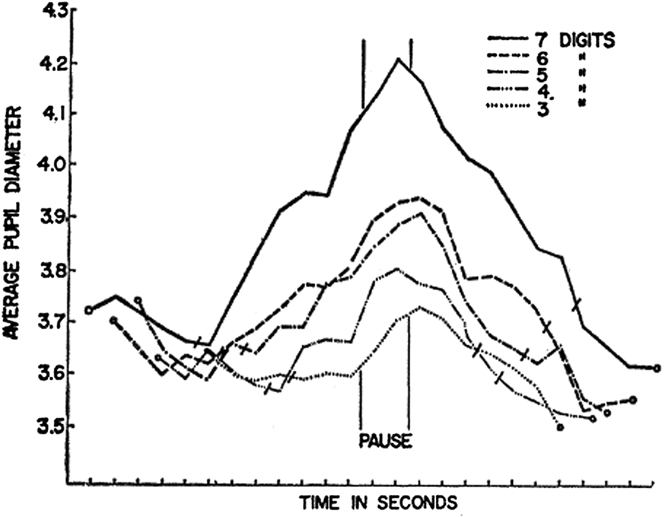
Even though the whys and hows of cognition-mediated pupil responses are not yet completely understood, it is now widely accepted that it is possible to reliably infer cognitive effort associated with different mental activities by measuring changes in pupil diameter. These changes are tiny in magnitude (somewhere between 0.1 and 0.5 mm) but can be reliably measured with the right equipment. In an early and now seminal study, for example, researchers showed that when participants were asked to remember strings of digits, the pupil diameter increased with each additional digit and then decreased again when participants recalled the digits (Kahneman & Beatty, Reference Kahneman and Beatty1966), suggesting a link between memory load and pupil dilation (see Figure 1; also see Klingner, Tversky, & Hanrahan, Reference Klingner, Tversky and Hanrahan2011, Exp. 2). Furthermore, increased pupil dilation (relative to a baseline value) may indicate a state of heightened attention such as during selective listening (Klingner et al., Reference Klingner, Tversky and Hanrahan2011, Exp. 3), memory consolidation (e.g., Goldinger & Papesh, Reference Goldinger and Papesh2012), expectancy violations (Hochmann & Papeo, Reference Hochmann and Papeo2014; Scheepers, Mohr, Fischer, & Roberts, Reference Scheepers, Mohr, Fischer and Roberts2013), and general mental effort associated with a task (e.g., Zekveld, Kramer, & Festen, Reference Zekveld, Kramer and Festen2010) (see next section). Readers interested in a more in-depth discussion of the physiological and cognitive underpinnings of pupillometry are referred to the following review articles: Beatty (Reference Beatty1982), Eckstein, Guerra-Carrillo, Singley, and Bunge (Reference Eckstein, Guerra-Carrillo, Singley and Bunge2016), Goldinger and Papesh (Reference Goldinger and Papesh2012), Laeng, Sirois, and Gredeback (Reference Laeng, Sirois and Gredeback2012), and Sirois and Brisson (Reference Sirois and Brisson2014).
Average pupil diameter (in mm) of five subjects who were asked to remember and recall strings of digits of varying lengths (3 to 7 digits). Trials are aligned to a 2-second pause that always occurred between remembering and recalling the digits (the figure appeared in Kahneman and Beatty, Reference Kahneman and Beatty1966; used with permission).

PUPILLOMETRY IN LINGUISTIC RESEARCH
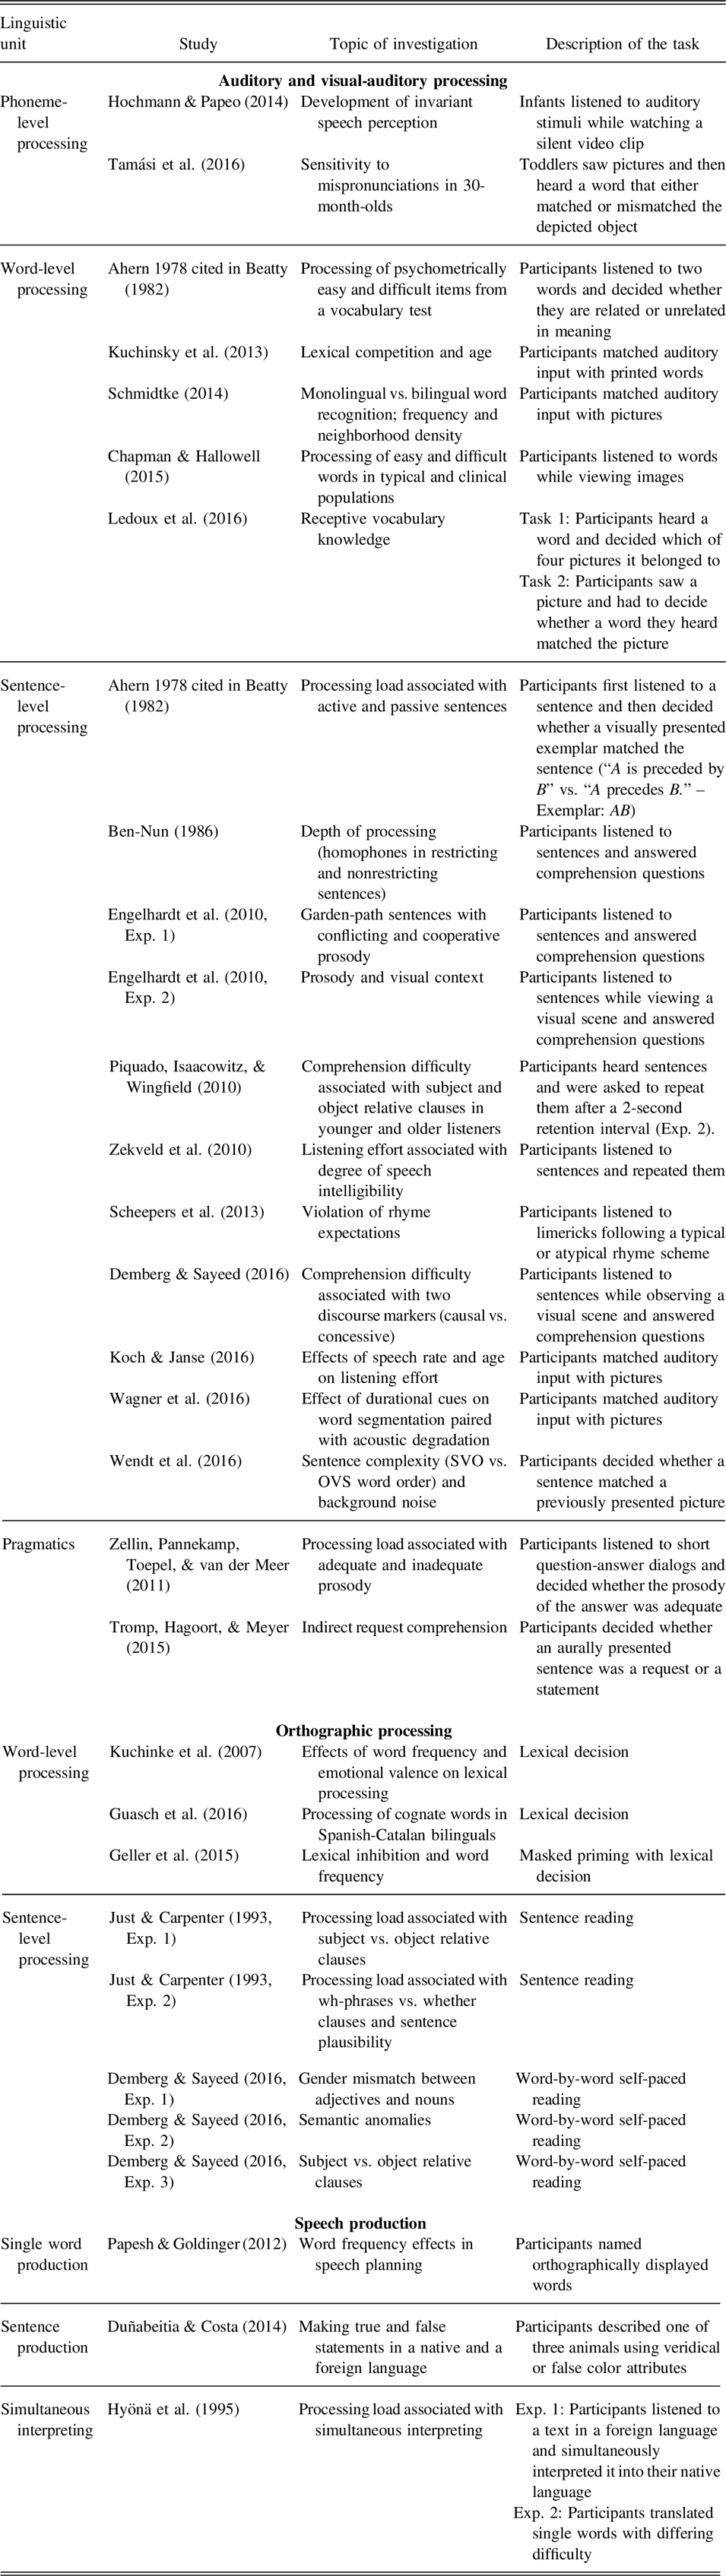
Table 1 shows how pupillometry has been used in linguistic research. As can be seen by the publication years of these studies, pupillometry as a research paradigm has been in use for quite some time but research has only really taken off since 2010 or so. Studies reviewed here are categorized into three broad areas, auditory and orthographic language processing, and speech production, and some potential applications to SLA are discussed. How pupil data are collected and analyzed will then be described in a separate section. Briefly, researchers look at the magnitude of pupil dilation associated with a task (i.e., the difference in dilation between the pupil diameter before the start of a trial and during a trial) to gauge mental effort. For example, when comparing the peaks in Figure 1, one can see that remembering seven digits was associated with a larger dilation than remembering three digits. Based on this and similar findings, linguistic phenomena as diverse as speech perception and pragmatics have been investigated.
An overview of studies in language research that have employed pupillometry

AUDITORY AND AUDITORY-VISUAL PROCESSING
Hochmann and Papeo (Reference Hochmann and Papeo2014) tested infants at 3 and 6 months of age with the purpose of determining whether infants could distinguish between [d] and [b] in different phonetic contexts by taking advantage of the fact that the pupil not only responds to processing difficulty but also to the novelty of a stimulus. Infants heard four syllables with the same initial consonant (either [d] or [b]) but in 25% of trials the last syllable had a deviant initial consonant (e.g., /boo/ instead of /due/; Exp. 2). Results showed that the pupil dilated more in the deviant-stimulus condition compared to the same-stimulus condition but only in 6-month-olds, suggesting that speech perception becomes more adultlike between the ages of 3 and 6 months.
Speech perception was also the focus in Tamási, McKean, Gafos, Fritzsche, and Höhle (Reference Tamási, McKean, Gafos, Fritzsche and Höhle2016) who demonstrated that 30-month-old toddlers were sensitive to different degrees of mispronunciation. When toddlers saw a picture of a baby and heard daby, their pupils dilated more compared to when they heard baby and their pupils dilated even more in response to hearing shaby, presumably because /∫/ is more dissimilar from /b/ than is /d/. Based on their results, Tamási et al. interpreted the pupillary response in this task as indicating cognitive effort associated with establishing a link between stimulus and lexical representation (p. 7).
Although the methodology may have to be adapted for adults, these studies show the potential to use pupillometry to study speech perception in second language learners. For example, many studies have looked at the effect of perceptual training on discrimination ability of nonnative speech sounds (e.g., Hardison, Reference Hardison2005) with the dependent variable being recognition accuracy. Pupil response data could supplement accuracy and RT data because the pupil response can be recorded while participants are performing a task. In addition, in the case of perceptual training, based on the two studies reviewed in the preceding text one would expect that increased sensitivity to nonnative sound contrasts may be observed in the pupil response. A further advantage is that the pupil response is an implicit measure of cognitive processing, as it does not require an overt response.
At the word and sentence level, pupillometry has been employed to investigate various research questions. Several studies (Demberg & Sayeed, Reference Demberg and Sayeed2016; Kuchinsky et al., Reference Kuchinsky, Ahlstrom, Vaden, Cute, Humes and Dubno2013; Ledoux et al., Reference Ledoux, Coderre, Bosley, Buz, Gangopadhyay and Gordon2016; Schmidtke, Reference Schmidtke2014; Wagner, Toffanin, & Baskent, Reference Wagner, Toffanin and Baskent2016) have demonstrated the feasibility of combining pupillometry with the visual-world paradigm (Conklin & Pellicer-Sanchez, Reference Conklin and Pellicer-Sanchez2016; Tanenhaus, Spivey-Knowlton, Eberhard, & Sedivy, Reference Tanenhaus, Spivey-Knowlton, Eberhard and Sedivy1995). In this paradigm, participants see pictures, usually four, while they hear a sentence that directs them to one of the pictures. These studies have shown greater pupil dilation in response to infrequent or unknown words compared to frequent words (Ledoux et al., Reference Ledoux, Coderre, Bosley, Buz, Gangopadhyay and Gordon2016; Schmidtke, Reference Schmidtke2014), suggesting that the ease of retrieving words from memory is dependent on how often a word has been encountered. This has potential application in SLA vocabulary research (e.g., Schmitt, Reference Schmitt2014) as it provides a way for researchers to assess receptive vocabulary knowledge but also the development of lexical representations. The paradigm is not dependent on pictures, as it can also be combined with printed words (e.g., Kuchinsky et al., Reference Kuchinsky, Ahlstrom, Vaden, Cute, Humes and Dubno2013), but the true advantage of pupillometry in auditory processing may be the fact that no visual material is needed at all as seen in the following examples of auditory sentence processing.
In Engelhardt, Ferreira, and Patsenko (2010, Exp. 1) participants listened to garden-path sentences of the kind When Roger leaves(,) the house is dark. When the prosody of the sentence mismatched the syntactic structure (no pause after leaves), comprehension appeared to be more difficult compared to a condition in which a pause was inserted between the two clauses as indexed by a larger pupil response in the mismatch condition. Another study found that differences in syntactic complexity were associated with differences in the pupil response. Wendt, Dau, and Hjortkjaer (Reference Wendt, Dau and Hjortkjaer2016) presented native listeners with sentences in Danish following SVO or OVS word order. While OVS sentences are grammatical in Danish, they are less frequent than canonical SVO sentences and therefore may be more difficult to process. This was confirmed by the pupil data as processing OVS sentences was associated with a larger pupil dilation compared to processing SVO sentences. While both studies also assessed comprehension to ensure that participants paid attention to the stimuli, this was done after the listening part. This is an advantage over other methods such as self-paced listening as listening is more natural when no concurrent task such as pressing a button is required.
While the two previous studies investigated listening effort associated with parsing a sentence, another source of increased listening effort is a suboptimal speech signal. Several studies now have shown that increased background noise levels, for example, are associated with an increase in pupil size, suggesting that the presence of noise requires greater processing resources (e.g., Kramer et al., Reference Kramer, Lorens, Coninx, Zekveld, Piotrowska and Skarzynski2013; Zekveld et al., Reference Zekveld, Kramer and Festen2010). At the same time, listening is more difficult in a second language, be it in noise (e.g., Bradlow & Pisoni, Reference Bradlow and Pisoni1999; Meador, Flege, & Mackay, Reference Meador, Flege and Mackay2000) or quiet (Weber & Broersma, Reference Weber, Broersma and Chapelle2012), and pupillometry may offer a way to investigate general listening effort in a second language. For example, what are the effects of topic familiarity, selective versus global listening, accent familiarity, or a suboptimal speech signal (as it occurs in and outside the classroom) on listening effort in a L2? The advantage of pupillometry is that longer passages could be used because pupil dilation can be tracked during listening without requiring button presses or other responses. Results from such studies may inform SLA pedagogy because they may show how listening effort can be reduced.
ORTHOGRAPHIC LANGUAGE PROCESSING
In studies that investigated orthographic language processing, pupillometry has been combined with lexical decision, self-paced reading, and eye-tracking. Lexical decision (i.e., deciding whether a string of letters is a real word in a particular language) is usually used by psycholinguists who investigate properties of the mental lexicon, that is, how words are stored and retrieved. Likewise, SLA researchers use the paradigm to investigate properties of the developing L2 mental lexicon (e.g., Foote, Reference Foote2015). Studies that combined lexical decision with pupillometry have shown that effects that show up in RT studies can also be observed in the pupil response. Kuchinke, Võ, Hofmann, and Jacobs (Reference Kuchinke, Võ, Hofmann and Jacobs2007) showed that low-frequency words elicited a larger pupil response than high-frequency words, suggesting a processing advantage for regularly encountered words (also see Haro, Guasch, Vallès, & Ferré, Reference Haro, Guasch, Vallès and Ferré2016). Guasch, Ferré, and Haro (Reference Guasch, Ferré and Haro2016) showed that Spanish-Catalan bilinguals processed cognate words (translation equivalents that share a similar form) with greater ease than words that do not have a cognate in the other language. One recent lexical-decision study suggests that results from RT data and pupillometry can sometimes diverge. Geller, Still, and Morris (Reference Geller, Still and Morris2015) sought evidence for lexical competition during orthographic word recognition with a masked-priming lexical decision paradigm. This paradigm is similar to a regular lexical decision experiment with the difference that a word is shown for ∼40 ms so that participants only process it at a subconscious level. The idea behind this paradigm is that orthographically similar words compete during recognition, which is believed to impede the recognition process. For example, when primed with bark, participants are slower to decide whether back is a word in English or not compared to a condition in which they are primed with an unrelated word. In Geller et al.’s study, the authors found evidence for competition in the RT data only when the lexical frequency of target words was low but not when it was high. The pupil response, however, suggested lexical competition for low- and high-frequency targets. This study suggests that collecting pupil response data may provide additional information that is not evident in traditional RT experiments.
Self-paced reading is a paradigm widely employed in SLA research (Jegerski & VanPatten, Reference Jegerski and VanPatten2014; Keating & Jegerski, Reference Keating and Jegerski2015) and is often used to measure sensitivity to grammatical violations (e.g., VanPatten & Smith, Reference VanPatten and Smith2014) or to test the predictions of certain theories regarding L1-L2 processing differences (e.g., Leal, Slabakova, & Farmer, Reference Leal, Slabakova and Farmer2016). Recently, self-paced reading was also combined with pupillometry. In three experiments, Demberg and Sayeed (2016, Exp. 1, 2, 3) tested participants in their native language German on three different tasks for which processing differences had previously been established: gender mismatches between adjectives and nouns, semantic anomalies, and processing of locally ambiguous subject versus object relative clauses. The results suggested that sensitivity to grammatical and semantic violations as well as processing difficulty can be inferred from the pupil response.
Participants in these self-paced reading experiments could only read one centrally displayed word at a time to avoid possible confounds of eye movements. By contrast, in Just and Carpenter (Reference Just and Carpenter1993) participants read sentences that were fully displayed on the screen while pupil size and eye movements were recorded. However, the latter methodology seems to be trickier because the pupil response cannot be easily aligned to what participants are reading when they can move back and forth with their eyes in the sentence. A further challenge associated with sentence reading will be discussed in the section “Designing an Experiment.”
SPEECH PRODUCTION
In speech production, pupillometry has been used to investigate production of single words (Papesh & Goldinger, Reference Papesh and Goldinger2012), sentences (Duñabeitia & Costa, Reference Duñabeitia and Costa2014), and paragraphs (Hyönä, Tommola, & Alaja, Reference Hyönä, Tommola and Alaja1995). An advantage of pupillometry is that the pupil response provides a moment-to-moment index of cognitive activity whereas RTs only show the sum, as it were, of all cognitive processes associated with a task. This was exploited in Papesh and Goldinger (Reference Papesh and Goldinger2012), who investigated the effect of word frequency on single word production. In their experiment, participants saw high- and low-frequency words and were asked to name them when prompted by an acoustic cue. In a simple RT experiment in which researchers would measure the latency between the onset of the cue and the onset of the response, differences in naming latencies between high- and low-frequency words could be due to different sources. It could be that for low-frequency words, lexical access takes longer or it could be that executing the speech-motor plan is more effortful (or both). Papesh and Goldinger found frequency effects in the response preparation phase, that is, between the cue and the onset of the response and after a response was made. Because the cue was given at a time when lexical access is believed to be complete (the participant had enough time to retrieve the word from memory), the observed frequency effects showed that preparing and executing a response is more effortful for low-frequency words compared to high-frequency words.
The paradigm used by Papesh and Goldinger (Reference Papesh and Goldinger2012) may also be useful for SLA. Many studies have shown that picture naming, for example, is delayed in a L2, even when the L2 was learned early in life as is the case with bilinguals (e.g., Gollan, Montoya, Cera, & Sandoval, Reference Gollan, Montoya, Cera and Sandoval2008; Ivanova & Costa, Reference Ivanova and Costa2008). As noted earlier, RTs, in this case the latency from stimulus appearance to the naming response, reflect the sum of various processes and so pupillometry may provide data that could identify at what stages of speech production differences between L1 and L2 arise (cf. Runnqvist, Strijkers, Sadat, & Costa, Reference Runnqvist, Strijkers, Sadat and Costa2011). This, in turn, can inform theories of lexical access in L2.
Speech production was also investigated in Duñabeitia and Costa (Reference Duñabeitia and Costa2014). In this study, participants had to make truthful or false statements in their L1 (Spanish) or L2 (English). When speaking in their L2, participants’ pupils dilated significantly more than when they spoke in their L1, while the effect of veracity was the same in both languages. This study suggests that speaking in an L2 is more effortful and that the associated effort can be reliably and objectively measured by using pupillometry. This creates opportunities for SLA researchers interested in various speech production–related issues.
To summarize the benefits, measuring the pupil response is a noninvasive technique that can be combined with a range of experimental paradigms that are already standard in SLA research to provide additional data. As this review of recent research has shown, several studies replicated effects that had already been known from other methods (e.g., word frequency effects). This can be seen as a form of triangulation so that researchers can have greater trust in certain effects. Furthermore, an advantage of pupillometry over other methods is that changes in pupil dilation can be measured while a participant is engaged in a task without requiring an overt response. This was exploited in the two studies on speech perception in young children described previously, which led the respective authors to new discoveries.
So how can pupillometry help answer questions in SLA? I will give one example from an area in SLA that has been receiving much attention over the past decades, implicit and explicit L2 learning and their counterparts, implicit and explicit knowledge (e.g., N. Ellis, Reference Ellis2005). The reason these two types of knowledge receive attention is that adults, as opposed to young children, can often perform well on a test that measures a certain aspect of their L2 knowledge by using metacognitive strategies. Thus, when researchers are interested in the development of implicit knowledge, they need to develop tasks that reduce their participants’ ability to use metacognitive strategies. Different proposals have been made as to how this can be achieved, for example, by reducing the amount of time given to participants to perform a task (e.g., R. Ellis, Reference Ellis2005). Another way is to use an online measure to see how individuals process language while they are performing a task as opposed to measuring RTs after performing a task. For example, Godfroid et al. (Reference Godfroid, Loewen, Jung, Park, Gass and Ellis2015) used stimuli from R. Ellis (Reference Ellis2005) to investigate the reading patterns of L1 and L2 speakers of English on timed and untimed grammaticality judgment tests. The analysis of reading patterns provided support to the notion that timed and untimed grammaticality judgment tests tap into implicit and explicit knowledge, respectively.
As with eye-tracking and other online measures such as event-related potentials (ERPs), the advantage of pupillometry is that it can provide moment-to-moment data on language processing. This way the method can help researchers measure implicit knowledge in L2 learners from speech perception to sentence processing. As each method has its advantages and disadvantages, one advantage of pupillometry is that processing effort can be measured in the absence of visual stimuli. For example, if L2 learners show sensitivity to grammatical violations while listening to grammatical and ungrammatical sentences, then researchers could be more certain that participants had indeed developed implicit knowledge of the grammatical phenomenon in question.Footnote 2 However, for pupil data to be informative, experiments must be carefully designed and analysed, and this is discussed in the next sections.
DESIGNING AN EXPERIMENT
Much of what is true for designing an experiment in general psycholinguistic research is also true for pupillometry. For example, Keating and Jegerski (Reference Keating and Jegerski2015) discuss a wide range of research designs for sentence processing studies and Conklin & Pellicer-Sanchez (Reference Conklin and Pellicer-Sanchez2016) critically review research using eye-tracking methodology. As in all experimental research, any effects of a certain variable can only be investigated with reference to a control condition. And to ensure that any results are truly attributable to the effect in question, conditions may only differ in one aspect to not introduce any confounds. For example, if processing load associated with two types of sentences were investigated but one type of sentences contained only low-frequency words and the other type only high-frequency words, then sentence type would be confounded with word frequency because we know that low-frequency words are harder to process than high-frequency words. When using pupillometry, however, additional confounds can be introduced that would not matter for other paradigms.
The most prominent confound in pupillometry is luminance, that is, the brightness of the screen and the research room. Although researchers have found that the task-evoked pupillary response is independent of background illumination (Bradshaw, Reference Bradshaw1969; Pomplun & Sunkara, Reference Pomplun, Sunkara, Harris, Duffy, Smith and Stephanidis2003), it seems to be good practice to keep the illumination intensity of the room constant for all participants. Therefore, no daylight should enter the research room and the light source should not be too bright or too dim so that the pupil is not at its minimum or maximum dilation. Even better practice may be to find the minimum and maximum dilation for each participant (through minimum and maximum illumination) and then to adjust the brightness of the screen and research room for each participant so that the pupil is at its mean dilation point (see Chapman, Oka, Bradshaw, Jacobson, & Donaldson, Reference Chapman, Oka, Bradshaw, Jacobson and Donaldson1999). However, this procedure is difficult to follow with eye-tracker models that do not provide the researcher with real-time pupil measurements on a control screen.
When visual stimuli such as pictures are used, the luminance of those stimuli may not differ systematically between conditions. This can sometimes be achieved by using the same stimulus in two conditions while counterbalancing across participants. For example, if participants must decide whether a visual scene matches a sentence they hear, one participant could see the picture in the matching condition and another one would then see it in the mismatching condition. Also, the luminance of black-and-white line drawings will be easier to control than that of color pictures. When the design of a certain experiment makes it difficult to completely control for equal luminance across conditions, researchers may want to think about other ways to ensure that any results are not due to this confound. For example, participants could be given a preview time of pictures before any auditory stimuli are heard. If there are no significant differences in pupil dilation between conditions in this preview time, then researchers can have more confidence in their conclusions.
Another possible confound that researchers need to be aware of is the positioning of stimuli on the screen. Hayes and Petrov (Reference Hayes and Petrov2015) showed that the pupil size can vary systematically as a function of gaze position, that is, depending on where on the screen the participant focuses, the pupil size recorded by the eye-tracker will differ even if there is no actual change in pupil diameter (also see Brisson et al., Reference Brisson, Mainville, Mailloux, Beaulieu, Serres and Sirois2013; Gagl, Hawelka, & Hutzler, Reference Gagl, Hawelka and Hutzler2011; Pomplun & Sunkara, Reference Pomplun, Sunkara, Harris, Duffy, Smith and Stephanidis2003). To get around this confound, researchers have different options. The easiest way around it is to always present stimuli centrally on the screen and to ask participants not to move their eye away from the stimulus. When no visual stimuli are used, participants can be asked to look at a central fixation cross and compliance can later be checked by examining the eye-movement data that are recorded by eye-trackers by default. When this procedure is used, participants should be given breaks in between trials during which they can blink and move their eyes to reduce fatigue (some researchers even prompt participants to blink in between trials to reduce blinking during a trial). When two or more pictures are used (e.g., in the visual-world paradigm), picture position needs to be counterbalanced so that the target picture appears in all possible positions equally often. However, some study designs do not allow for these adjustments, for example, when a visual scene is given. In this case, researchers are advised to consult the three publications given in the preceding text and to also contact the manufacturer of their eye-tracker model to think about how to correct any errors in pupil size before they run a study.
A further difference to other experimental paradigms that researchers need to consider is the fact that the pupil response is relatively slow to return to baseline and may be prolonged until after a response is made. A typical pattern of the pupil response is seen in Figure 1 where the pupil first dilates before it constricts again but the curvature of this response seems to depend on the specific task a participant is engaged in. For example, in Laeng, Ørbo, Holmlund, & Miozzo (Reference Laeng, Ørbo, Holmlund and Miozzo2011), participants had to name the font color of words displayed on a screen. The authors observed a small peak at about 400 ms after the appearance of a word and another, larger, peak at around 1,400 ms after stimulus onset, which occurred after participants had given a response. At 2,000 ms post trial-onset, the average pupil diameter was still above the baseline value. Therefore, to avoid any spillover effects into the next trial, researchers often implement longer interstimulus intervals (time between trials) than usual to allow the pupil to return to baseline. However, a side effect of this procedure is an overall slower pace of the study, which may affect the results (see Geller et al., Reference Geller, Still and Morris2015; Papesh & Goldinger, Reference Papesh and Goldinger2012).
A longer interstimulus interval than in typical psycholinguistic experiments is also necessary for the following reason. Typically, researchers are interested in the amount of pupil dilation associated with a task (hence task-evoked pupil response) and so a baseline value needs to be established to be able to know how wide the pupil was dilated prior to the onset of a trial. Therefore, the experimental setup needs to include a period prior to every trial during which the eye-tracker records but no stimulus is present. Establishing a baseline before every trial as opposed to the beginning of the experiment is recommended because the baseline diameter can change during an experiment based on the preceding trial, fatigue, or lapses of attention. Ideally, the screen luminance should not change between the baseline period and the start of the trial because with every change in brightness it takes a few hundred ms for the eyes to adjust. Furthermore, there would be differences between the baseline pupil diameter and the diameter during the trial due to those changes in luminance. This can be avoided by using placeholders where stimuli will appear. For example, when a picture is shown, a rectangle of the same size and luminance as the picture could be shown before its appearance. But even when the overall screen brightness does not change, there may still be an initial constriction of the pupil due to local changes in hues or intensity (Kohn & Clynes, Reference Kohn and Clynes1969) and therefore the critical period of interest should not occur right after a new screen to allow the eyes to adjust first.
Lastly, the number of experimental trials should be set higher than in RT experiments for two reasons. Data loss can be substantial due to blinks (see the next section) and a decent amount of trials per condition is also recommended because of the noise inherent in pupil data. Keating and Jegerski (Reference Keating and Jegerski2015) recommend 30 to 40 items per condition for ERP studies, which are also characterized by measurement noise and data loss, and this number may also be desirable for pupillometry. Obviously, the number of trials needed to obtain robust results also depends on the number of participants and the expected effect size. Furthermore, within-subjects designs generally have more power to find effects than between-subjects designs, which also needs to be considered. Of course, sometimes it is not possible to have 30 items in each condition for various reasons and then researchers need to trade off statistical power against feasibility. For example, Tamási et al. (Reference Tamási, McKean, Gafos, Fritzsche and Höhle2016) tested 30-month-olds in an experiment involving four experimental conditions plus filler trials. It would be difficult to get children of this age to sit still to listen to more than 120 trials. Instead, the authors opted for a Latin-square design and only presented 5 trials out of 20 in each condition to each child. However, their total number of participants of 43 was sufficiently high to find reliable effects. Although adults have longer attention spans, fatigue is also an issue with adults and this also puts limits on the total number of trials.
ANALYZING THE DATA
DATA PREPROCESSING
Before pupil data can be submitted to statistical tests, some preprocessing is necessary, which involves data reduction, filtering, and interpolation of missing data. Data reduction is often necessary due to the sheer amount of data that is put out by eye-trackers. For example, a 300 Hz eye-tracker takes an image of the pupil every 3.3 ms. This can easily result in 1,000 observations just for one trial (with a trial being an event in an experiment such as listening to a sentence, deciding whether a string of letters is a word or nonword, etc.). An experiment with 50 participants and 50 trials per participant would result in 2.5 million observations. For this reason, the resolution is often downsampled, for example by taking the average of 10 consecutive samples. Which temporal resolution is adequate ultimately depends on the research questions and the type of statistical analysis that will be used.
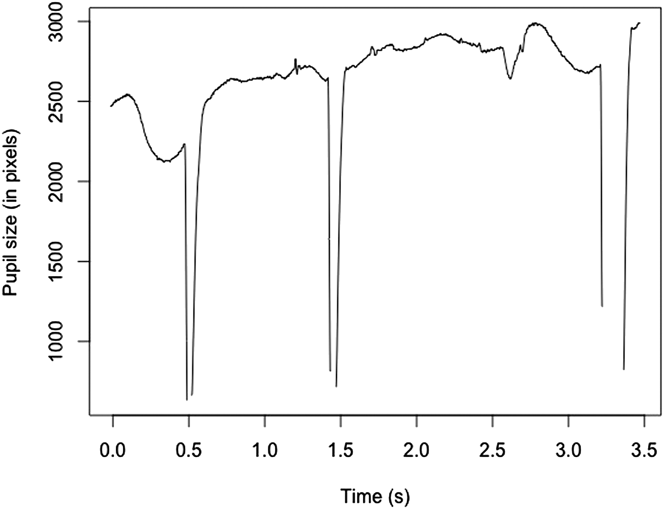
Because of the amount of data that results from an experiment, it can be difficult to detect any anomalies or recording errors in the data. Therefore, researchers usually create algorithms that search for missing data or large, sudden changes in pupil diameter that are indicative of blinks or artifacts of the recording equipment. Short blinks can be corrected through linear interpolation, that is, by connecting the samples before and after the blink with a straight line. Figure 2 gives an example of a trial with missing data where missing observations resulted from blinks. The steep sudden drops and rises occur because the pupil is partially occluded by the eyelids before the pupil is fully covered and the eye-tracker records missing observations. Therefore, the samples shortly before and after a blink would also have to be excluded here. Figure 2 also demonstrates the importance of plotting individual trials to be able to detect any anomalies or artifacts in the data. If the pupil measurements recorded while the pupil was partially occluded were to be left uncorrected, the mean pupil dilation (the average of all samples in a trial) would be much lower than was the case and wrong conclusions could be drawn.
Changes in pupil size (in pixels) over the course of a single trial. Periods of missing data (around 0.5, 1.5, and 3.2 s) were preceded and followed by sudden decreases and increases of the pupil size. This occurs when the pupil is partially occluded by the eyelid due to a blink.

Interpolated data, however, may become unreliable for longer blinks and researchers need to decide how much missing data they accept before discarding the entire trial. The percentage of missing data can be calculated by dividing the number of samples in a trial with no observations by the total number of samples in that trial. For example, if a camera records at 60 Hz, a 2,000 ms trial would contain 33 samples of the pupil. If 10 samples were empty due to a blink, there would be 30% missing data. There is currently no convention as to what percentage of missing data is acceptable and so different procedures can be found in the literature. Zekveld et al. (Reference Zekveld, Kramer and Festen2010) discarded all trials with more than 15% missing values, whereas Kuchinsky et al. (Reference Kuchinsky, Ahlstrom, Vaden, Cute, Humes and Dubno2013) set the threshold to 50% (although only few trials had these many missing observations). In addition, Papesh and Goldinger (Reference Papesh and Goldinger2012) only analyzed data from participants with no more than 6% missing data. Another consideration is to check if there is a pattern for missing data. For example, participants may be more likely to blink at the start of a trial when a stimulus appears. Because differences between conditions usually only emerge after a few hundred milliseconds, missing observations at the beginning of a trial may be less problematic than subsequent missing observations. The decision of which trials/participants to exclude ultimately lies with the researcher. However, the process can be made more transparent by reporting if and how the results changed with a more stringent or less stringent exclusion criterion. In addition, researchers should report whether missing observations were equally distributed across groups and conditions and, if not, how this may have affected the results.
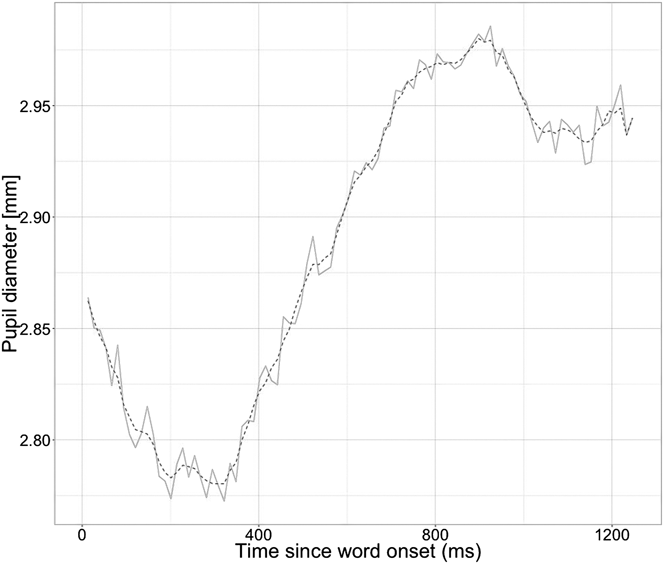
As mentioned earlier, pupil data can be quite noisy, that is, there are fluctuations in pupil diameter that are not evoked by a task. To reduce some of this noise, some researchers apply a smoothing algorithm (also called an n-point moving-average filter). What this algorithm does is to replace each observation with the mean of the current observation plus the immediately preceding and following observations (the more observations the algorithm uses to average, the smoother the resulting graph will be). The algorithm can be modified by giving less weight to observations further away from the current observation, referred to as a weighted moving-average filter. Figure 3 provides an example for data from one trial with smoothed and raw data of the pupil response. Yet another way to reduce noise is to average data from both eyes if data from both eyes were recorded.
An example of the difference between raw (solid gray line) and smoothed (dashed line) pupil diameter values in a single trial.

SELECTION OF DEPENDENT VARIABLES AND STATISTICAL ANALYSIS
Traditionally, researchers have looked at three different measures to analyze pupil data: mean dilation, peak amplitude, and peak latency (Beatty & Lucero-Wagoner, Reference Beatty, Lucero-Wagoner, Cacioppo, Tassinary and Berntson2000). To calculate these, the pupil dilation at baseline first needs to be established for every trial. This value can then be subtracted from every observation in a trial to obtain baseline-corrected values. The mean dilation is calculated by taking the mean of all observations in a trial or a certain time window within a trial. Say there are 10 observations in a trial, then the pupil diameter at each observation would be tallied up and divided by 10. Researchers have used mean dilation, for example, to compare listening effort for sentences with different levels of background noise (see Zekveld et al., Reference Zekveld, Kramer and Festen2010).
Alternatively, the pupil response is analyzed with respect to a certain event in a trial. This can be the start of a trial or a certain event in a trial. For example, in Schmidtke (Reference Schmidtke2014) participants heard the sentence “Click on the [target word]” and the pupil response was time locked to the onset of the target word. When time locked to the start of an event, the pupil response is usually characterized by a steady increase in dilation until a peak is reached between 700 and 2,000 ms, depending on the task, followed by a gradual decrease. Peak latency (PL), with peak referring to the largest observed pupil diameter in a trial, is defined as the time from the onset of the event in question to the peak dilation in a trial. In Figure 3, the PL is ∼900 ms. Peak amplitude (PA) is the baseline-corrected pupil diameter at the peak (in Figure 3, the PA is the diameter at ∼900 ms, which corresponds to ∼2.97 mm, minus the baseline diameter, i.e., the diameter before the start of the trial). An advantage of PL is that this measure is independent of the eye-tracker model used and is therefore easily comparable across studies (i.e., the unit of measurement is always ms). For PA, however, the units of measurement can vary. For example, Tobii eye-trackers (Tobii Technology, Stockholm, Sweden) measure pupil diameter in mm whereas Eyelink eye-trackers (SR Research, Mississauga, Canada) count the number of pixels that the pupil occupies on the camera image. This unit is arbitrary because the number of pixels will be different depending on the distance of the pupil to the camera (the closer the eye is to the camera, the bigger the pupil will appear). Therefore, pixels cannot be easily converted into mm. This is not a problem in and of itself if the distance of the eye to the camera does not change within an experimental session. However, arbitrary units make it difficult to compare results across studies.Footnote 3
PL and PA are usually analyzed in separate analyses (as opposed to one multivariate analysis of variance or similar omnibus analyses). One disadvantage of this procedure is that the interpretation of results is not always straightforward, for example, when an effect is significant in one measure but not the other and it increases the number of tests, which also increases the possibility of committing a type I error. Another disadvantage of this procedure is that much of the fine-grained information that pupillometry provides is lost so that the benefit over traditional RT experiments is less obvious. Also, depending on a task, there may be no clear peaks in the data (this can be determined by visually inspecting individual trials and aggregated data). In this case, it may be preferable to divide a trial into different time windows that correspond to predefined events and to analyze the mean dilation in each time window. For example, in Papesh and Goldinger (Reference Papesh and Goldinger2012) participants named words after they were prompted by a cue. The researchers divided each trial into different phases that corresponded to the appearance of the word on the screen, the wait period until the cue was given, and the response. Additional ways to analyze pupil data are described in the online supplementary material.
Processing and analysis of pupil data may seem daunting to the novice without programming experience but as pupillometry becomes more popular, it is likely that more tools will become available to aid researchers. Those interested in pupillometry should contact the manufacturer of their eye-tracker to find out what software is already available. For example, the newest version of the data-processing software that comes with Eye-link eye-trackers (SR Research, Mississauga, Canada) now includes a way to aggregate data and extract mean dilation, PL, and PA without requiring programming experience. In addition, some labs make their code available on the Internet. For example, Sirois and Brisson (Reference Sirois and Brisson2014) refer to a websiteFootnote 4 where they provide MATLAB (Mathworks, Cambridge, UK) code to process pupil data from Tobii eye-trackers (Tobii Technology, Stockholm, Sweden) including a walk-through example.
CONCLUSION
The purpose of this article was to give an overview of how pupillometry has been used in linguistic research to familiarize SLA researchers with this method. Furthermore, some suggestions were made as to how pupillometry could be used in SLA research and the kind of research questions that it can answer. Since the early days of pupillometry, advances have been made both in providing a neurocognitive explanation of this physiological measure and in demonstrating the viability of the pupil response as a dependent variable in cognitive and linguistic research. Although pupillometry is not as well established as other techniques used in linguistic research, the studies reviewed here demonstrate that it offers researchers new and creative ways to test hypotheses and so advance our knowledge of SLA.
SUPPLEMENTARY MATERIAL
To view supplementary material for this article, please visit https://doi.org/10.1017/S0272263117000195