I. INTRODUCTION
Nano-sized titanium dioxide (TiO2) has gained growing interest because of its wide applications as photocatalysts, electrode materials, gas sensors, and photovoltaic materials.Reference Chen and Mao1–Reference Ni, Leung, Leung and Sumathy3 In the photoinduced systems, oxidation and reduction simultaneously take place at the surface of TiO2 particles, which in turn give rise to corresponding products. However, this process has an inherent and significant drawback, i.e., it always suffers from the recombination of photo-generated charge carriers (hole-electron pairs), which inevitably leads to the decrease of photoactivity. Therefore, to increase the photoactivity of TiO2, the photo-generated charge carriers are to be efficiently separated from each other. In the past decade, considerable efforts have been made to achieve this purpose. Choi et al.Reference Choi, Termin and Hoffmann4 carried out a systematic investigation to study the photoreactivity of 21 metal ions doped into TiO2. The different effects of metal ions result from their abilities to trap and transfer electrons/holes.Reference Choi, Termin and Hoffmann4,Reference Zhang, Wang and Wang5 Compared to cations, anions (N, F, C, S etc.) less likely form recombination centers, which are more effective to enhance the photocatalytic activity.Reference Asahi, Morikawa, Ohwaki, Aoki and Taga6,Reference Huang, Liao, Quan, Liu, He, Wan and Zhou7 Besides, surface modifications for the improvement of the photoacitivity for TiO2 have also been reported widely. Coupling TiO2 with other semiconductor materials (ZnO, WO3, CdS, SnO2, etc.) has been proved as a potential way for charge-carrier separation, and the patterned photocatalysts have exhibited high activity in gas-phase and liquid-phase reactions.Reference Zou, Yan, Chen, Alyamani, Wu and Gao8–Reference Cheng, Tay, Hng and Fan10 The improvement of the efficiency of photocatalytic reactions is explained in the transfer of photo-generated electrons and holes from one semiconductor to another.
Stannous oxide (SnO) is a p-type semiconductor with a direct forbidden band-gap of about 3.0 eV and the component elements are inexpensive and abundantly available.Reference Geurts, Rau, Richter and Schmotte11–Reference Lefebvre, Szymanski, Olivier-Fourcade and Jumas13 SnO has also attracted considerable technological interest. Powders of SnO have been used as anode materials in lithium rechargeable batteriesReference Rao, Jayalaksmi, Reddy, Madhavendra and Kantam14 and as coating materials or catalysts.Reference Han, Guo, Li, Zhang, Zhao and Qian15 As a p-type semiconductor, SnO is capable of forming the so-called p–n heterojunction with the n-type semiconductor TiO2, which would be highly efficient in transferring photo-generated electrons from the conduction band of TiO2. However, applications of SnO have been less frequent in the field of photocatalysis, mainly due to its tendency to decompose (into Sn and SnO2) at elevated temperatures.Reference Christensen, Svane and Blanca16,Reference Giefers, Porsch and Wortmann17 Unfortunately the calcination under high temperature is absolutely necessary for the growth of TiO2 nanocrystallite in traditional preparations.Reference Macwan, Dave and Chaturvedi18 Consequently, the monoxide was never researched in the past as much in detail as SnO2 when coupled with TiO2 as the photocatalyst.
Recently, more and more literature has been published concerning low-temperature routes for making crystalloid TiO2.Reference Nikkanen, Kanerva and Mantyla19–Reference Gu, Lu, Yang and Hu21 The avoidance of high-temperature treatment significantly retards the growth of TiO2 nanocrystallites, which results in many favorable characters such as smaller crystalline size, higher specific surface area, better dispersibility, and less aggregation of particles in aqueous solutions. What is more helpful, some high-temperature related side reactions, such as the oxidation of component elements, are likely to be eliminated. In our previous works, we reported a facile soft-chemical strategy for the preparation of anatase TiO2 hydrosol, and the method was extended to the direct synthesis of TiO2 composites.Reference Su, Wang, Tang, Liu, Liu and Han9,Reference Wang, Zhao, Liu, Li, Xu and Han22–Reference Wang, Han, Liu, Zhang, Cai and Liu24 Herein, in the present work, as further attempt, patterned SnO–TiO2 composites have been prepared through the co-hydrolysis of tetrabutyl titanate and tin (II) chloride followed by acidic peptization of the hydrolysate under mild conditions. As confirmed with element, structure, and morphology analysis, a well-dispersed semitransparent hydrosol containing tetragonal SnO and anatase TiO2 nanocrystallites was obtained. The photocatalytic activity of the composite was investigated through the photodegradation of methyl blue (MB) dye under visible light irradiation (see structure below). The enhancement effect of SnO on the photodegradation rate was discussed according to a dye-sensitized mechanism,Reference Liu, Li, Zhao, Hidaka and Serpone25 which includes the electron injection from excited dye molecules to the conduction band of TiO2 and the subsequent interfacial electron transfer from TiO2 to SnO.
II. EXPERIMENTAL DETAILS
A. Preparation of SnO–TiO2 hydrosol
In a typical synthesis, Sn2+ precursor (SnCl2·2H2O, 0.03 mmol) and Ti4+ precursor [tetrabutyl titanate, Ti(OC4H9)4, 8.75 mmol] were dissolved in 25 mL absolute ethanol, and then the solution was added drop-wise into 30 mL doubly distilled deionized water under vigorous stirring. Once the addition is complete, the suspension was kept on stirring under 70 °C for 45 min to ensure complete hydrolysis. In this way, the acquired amorphous TiO2 was well dispersed into water. It was then added with 80 mL 0.055 M HNO3. Subsequently, the mixture was continuously stirred under 70 °C for 4 h in airproof condition and finally diluted with water to 100 mL. Thus, the semitransparent SnO–TiO2 hydrosol was obtained. The exact concentration of SnO–TiO2 particles was 2.8 g/L using gravimetric analysis.
B. Characterizations of SnO–TiO2 composite nanocrystallites
X-ray photoelectron spectroscopy (XPS) measurements were performed using a VG MultiLab 2000 (Thermo, Waltham, MA) system with a monochromatic Mg source (Mg Kα 1253.6 ev, 200 W). The binding energy shifts were corrected using the C 1s level at 284.6 eV as an internal standard, to compensate for the surface-charging effect during data analysis. The surface elemental stoichiometry was determined from the ratios of peak areas corrected with empirical sensitivity factors. Powder x-ray diffraction (XRD) patterns were obtained on an XRD-6000 x-ray diffractometer (Shimadazu Corporation, Kyoto, Japan) using graphite monochromatic copper radiation (Cu Kα) at 40 kV, 30 mA. The samples were scanned at a rate of 2° (2θ)/min over the diffraction angle range (2θ) of 10–80°, which covers the main characteristic diffraction peaks of anatase TiO2 and tetragonal SnO. The powder samples used for characterization were prepared by sedimentation of hydrosol, centrifugation, washing, and vacuum drying at 40 °C for 4 h and then were milled into tiny powders. High-resolution transmission electron microscopy (HRTEM) image of hydrosol and the corresponding fast Fourier transform (FFT) pattern were taken on a JEOL JEM 2010FEF (UHR) microscope (JEOL Ltd., Tokyo, Japan) operating at an accelerating voltage of 200 kV. UV-visible diffuse reflectance spectra (UV-vis DRS) were measured on a TU 1901 UV–vis spectrophotometer (Puxi Inc., Beijing, China) equipped with an integrating sphere attachment over a range of 280–600 nm. Photoluminescence (PL) spectra were obtained using a fluorescence spectrometer (LS 55, PerkinElmer, Waltham, MA). The excitation wave length was 320 nm, with a scanning speed of 600 nm/min. The widths of the excitation slit and emission slit were both 15 nm.
C. Examination of the photocatalytic activity
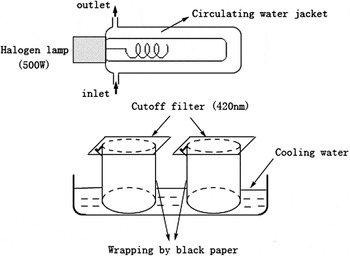
The visible-light photocatalytic activity of the SnO–TiO2 hydrosol was investigated through the photodegradation of MB dye and was compared with that of bare TiO2. A 500 W halogen lamp (Institute of Electric Light Source, Beijing) was positioned inside a cylindrical Pyrex vessel surrounded by a circulating water jacket (Pyrex) to cool the lamp. A cutoff filter was placed outside the Pyrex jacket to completely remove any radiation below 420 nm and to ensure illumination by visible light. A 50 mL beaker, wrapped by black paper, was filled with 5 mL diluted hydrosol photocatalyst containing 0.28 g/L SnO–TiO2 and 16 mg/L MB dye. The mixture was kept under constant air-equilibrated conditions before and during the irradiation. The experimental set-up is shown in Fig. 1. At given time intervals, the mixture was sampled to analyze by recording variations of the absorption band maximum at 560 nm in the UV-vis spectra. A TU 1900 UV-vis spectrophotometer (Puxi Inc., Beijing, China) equipped with 1 cm quartz cell was used for the absorbance measurement. The change of the maximum absorption versus irradiation time (C/C0 ∼ t) was obtained.
Scheme of the reactor used during photocatalytic experiments.

A Bruker A200S spectrometer (Karlsruhe, Germany) was used to record the electron paramagnetic resonance (EPR) signals of radicals spin-trapped by 5,5-dimethyl-1-pyrroline N-oxide (DMPO) after visible-light irradiation at ambient temperature. The parameters for the EPR measurements were as follows: center field, 3510 G; microwave frequency, 9.86 GHz; power, 2.28 mW.
III. RESULTS AND DISCUSSION
A. XPS analysis
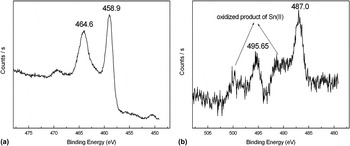
XPS measurements were performed to elucidate the exact composition of the composite. The high-resolution XPS spectra in Fig. 2(a) shows doublet peaks for Ti 2p (458.9 and 464.6 eV) binding energy, which are assigned to the Ti4+ ion in TiO2.Reference Gonbeau, Guimon, Pfister-Guillouzo, Levasseur, Meunier and Dormoy26 Two broad asymmetric peaks in Fig. 2(b) with maximum intensity at 487.0 and 495.65 eV are assigned to the position of binding energy of Sn 3d5/2 and Sn 3d3/2 for Sn2+ in SnO, respectively.Reference Fan and Goodenough27 As confirmed by the analysis of the corresponding peak area of Ti4+ and Sn2+, SnO was incorporated with TiO2 at approximately 0.6 mol%. Two shoulders in the spectrum [marked with arrows in Fig. 2(b)] are also observed, which we guess is due to a slight decomposition of SnO. To point out, the XPS energy shift between Sn2+ and Sn4+ states is too small to distinguish even with high resolution XPS.Reference Choe, Chung, Kim, Kim and Baik28,Reference Martel, Caballero-Briones, Bartolo-Perez, Iribarren, Castro-Rodriguez, Zapata-Navarro and Pena29 Although quantitative proportion is not available at this stage, the intensity of the peaks for Sn 3d indicates that a small amount of Sn(II) has transformed to SnO2 and Sn3O4 via disproportionation and oxidation reactions.Reference Dai, Pan and Wang30,Reference Giefers, Porsch and Wortmann31 This is because the tetragonal crystal SnO is a thermodynamically unstable phase,Reference Humphrey and O’Brien32 which might decompose into SnO2 and Sn even at a relatively low temperature.Reference Brewer33 The reactions occurring could be described as follows:
 $${\rm{4SnO(s)}} \to {\rm{Sn}}_{\rm{3}} {\rm{O}}_{\rm{4}} {\rm{(s)}} + {\rm{Sn(l)\quad,}}$$
 $${\rm{Sn}}_{\rm{3}} {\rm{O}}_{\rm{4}} {\rm{(s)}} \to {\rm{2SnO}}_{\rm{2}} {\rm{(s)}} + {\rm{Sn(l)\quad,}}$$
 $${\rm{Sn(l)}} + {\rm{O}}_{\rm{2}} \to {\rm{SnO}}_{\rm{2}} {\rm{(s)}}{\rm{\quad.}}$$
High-resolution XPS spectra of the SnO–TiO2 hydrosol. (a) Ti 2p (458.9 and 464.6 eV) and (b) Sn 3d (487.0 and 495.65 eV) binding energy. The sample was prepared by sedimentation of sol, centrifugation, vacuum drying of the hydrosol sample at 40 °C for 4 h, and milling into very tiny powders.

B. XRD analysis
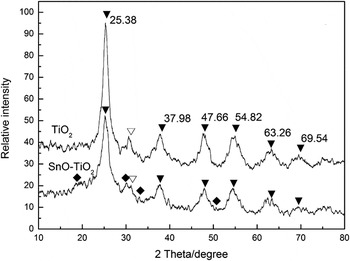
XRD technique has been used to determine the crystal structure of SnO particles since there are three main types of crystal structure of the monoxide, i.e., tetragonal SnO (α-SnO), orthorhombic SnO, and β-SnO. In our experiments, a wide-range scan was carried out at room temperature over the diffraction angle (2θ) 10–80° for both the composite and pure TiO2 and their XRD patterns are compared in Fig. 3. Note that the peaks referring to Sn are rather weakly presented due to the relatively low content of SnO in the composite and the very small size of crystallites. The XRD patterns of both the pure TiO2 and the composite show four clear peaks at 2θ = 25.38, 37.98, 47.66, and 54.82°, which are regarded as the attributive indicator of the anatase phase TiO2 (101), (103, 004 and 112), (200), and (105 and 211) crystal planes (JCPDS 21–1272). And a little amount of brookite phase TiO2 was seen in both samples (peaks marked with ∇). The weak peaks at 2θ = 18.38, 29.90, 33.28, and 50.72° marked with ♦ are contributed by SnO and are corresponding to its four main peaks (001), (101), (110), and (112), respectively (JCPDS 78-1913), which supports that the SnO particles in the as-synthesized composite are of the tetragonal crystal structure. In our previous study, it was discovered that the introduction of water-soluble anatase TiO2 clusters could act as effective stabilizers to avoid forming large aggregations of Ag nanoparticles.Reference Wang, Zhao, Liu, Li, Xu and Han22 Similarly, we deduced that TiO2 clusters in this hydrosol system functioned as stabilizers for segregating SnO nanoparticles through the surface OH groups so as to form the stable structure. Thus the decomposition of SnO was suppressed to a certain extent.
XRD results of the SnO–TiO2 and bare TiO2 hydrosol. ▼—anatase phase TiO2 crystallites, ∇—brookite phase TiO2 crystallites, ♦—tetragonal structure SnO, the content of SnO in the composite was 0.6 mol%.

The diffraction peak of SnO–TiO2 at (101) plane (2θ = 25.38°) is broader but weaker than that of bare TiO2. This may indicate a relatively smaller crystalline size of the composite according to the common knowledge that the diffraction peak of nano-sized particles is generally broadened and weakened with the decrease in size. The average crystalline size (D) is estimated from the full width at half-maximum (FWHM) of the diffraction peak using Sherrer’s formula:
 $$D = {\rm{K\lambda }}/({\rm{\beta }}\cos {\rm{\theta }})\quad,$$
where λ is the x-ray wave length, θ is the diffraction angle (25.38°), β is the FWHM, and K = 0.89 is a constant depending slightly on the crystallite shape. The value is calculated to be 5.0 nm for bare TiO2 and 4.2 nm for the SnO–TiO2 composite.
C. TEM and HRTEM analysis
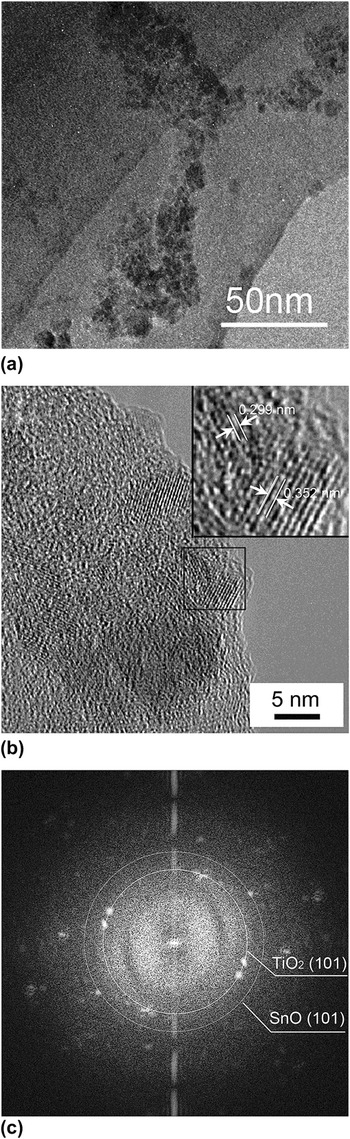
Figure 4(a) shows the morphological property of the SnO–TiO2 hydrosol. The tiny crystalline particles exist as small aggregations in TEM observation, making it difficult to measure the accurate size of single nanocrystallite. Figure 4(b) shows the lattice fringes of d = 0.352 nm and d = 0.299 nm, corresponding to the (101) crystallographic planes of anatase TiO2 and tetragonal SnO.Reference Du, Zhang, Liu, Han, Jiang and Huang34 As further evidence, FFT of the corresponding HRTEM image also confirmed the dominant crystal plane of anatase TiO2 as well as that of tetragonal structure SnO [Fig. 4(c)].
TEM image of SnO–TiO2 nanocomposite at low resolution (a), at high resolution (b), and the corresponding FFT pattern of Fig. 3(b) (c). The inset located on the top right corner was the magnification image of the selected area. The content of SnO in the composite was 0.6 mol%; pH = 2.5.

D. UV-vis DRS and PL analysis
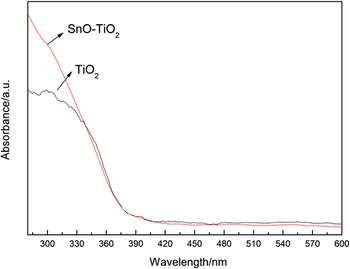
The optical absorption properties of TiO2 and SnO–TiO2 nanocomposites were investigated by UV-vis DRS spectra in Fig. 5. The absorption onset of TiO2 was found at about 384 nm, corresponding to a band gap energy of 3.2 eV. Compared to pure TiO2, no significant shift of the absorption edge over the SnO–TiO2 composite occurred. This result indicated that the introduction of SnO did not alter the band gap energies of TiO2, which was different from metal- or nonmetal-doping.
UV-vis DRS spectra of TiO2 and SnO–TiO2 nanocomposites.

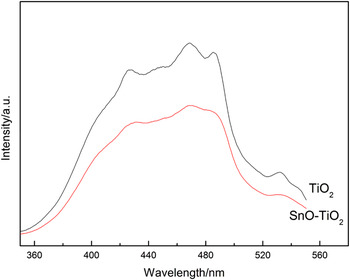
For individual semiconductor, most of the photogenerated charge carriers inevitably recombined at surface or bulk trapping sites with the emission of fluorescence, which retarded the activity in photocatalysis. To explain the charge transfer between two semiconductors, PL measurement can be used to confirm the decrease of such recombination after SnO incorporation.Reference Zhang, Zhang, Yin and Chen35 As shown in Fig. 6, the wide PL spectrum of single-component TiO2 in the wave length range of 350–550 nm was attributed to the emission of band gap transition and excitonic PL resulting from surface oxygen vacancies and defects.Reference Yu, Ma and Liu36 Compared to single-component TiO2, the introduction of SnO led to a remarkable decrease in emission intensity of the PL spectrum, indicating a much lower recombination rate of photoinduced charge carriers. The PL result implied that the function of SnO coupling was to separate the charge carriers in TiO2 crystals through their interfacial interaction and hinder the direct recombination of them.
PL spectra of TiO2 and SnO–TiO2 nanocomposites.

E. Photocatalytic activity under visible light irradiation
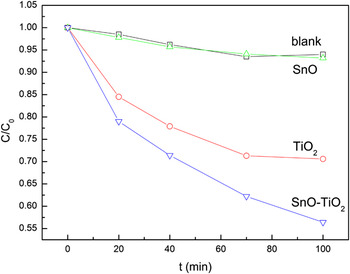
The photocatalytic activity of the SnO–TiO2 hydrosol was investigated through the photodegradation of MB dye under visible-light irradiation and was compared with that of pure TiO2 hydrosol. Time courses of MB decomposition with the two catalysts were obtained and illustrated in Fig. 7 (presented as C/C0 ∼ t). As can be seen, the photodegradation of MB dye in the SnO–TiO2 composite was notably accelerated when compared to the single-component TiO2 hydrosol or SnO hydrosol.
The time courses of MB decomposition under visible light irradiation. The concentration of SnO–TiO2 was 0.28 g/L in both samples, the proportion of SnO in the composite was 0.6 mol%, and the initial concentration of MB was 16 mg/L. Samples were irradiated under air-equilibrated conditions, pH = 2.5.

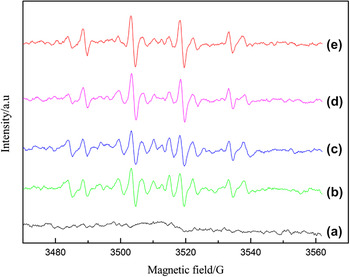
From the results of UV-vis DRS spectral analysis, both TiO2 and SnO–TiO2 nanocomposites only function under UV-light. The photodegradation of MB under visible-light irradiation follows a dye-sensitized mechanism, which cannot be a proof of visible-light activity.Reference Yan, Ohno, Nishijima, Abe and Ohtani37,Reference Liu, Wu, Zhao, Hidaka and Serpone38 The dye molecules are excited with irradiation and thus yield photo-generated charge carriers (electrons and cation radicals). Subsequently, electrons are injected to the conduction band of TiO2 and in turn reduce the preadsorbed O2 to produce reactive oxygen species (ROS) via a series of radical chain reactions. Finally, the cation radicals of MB are oxidized by ROS. EPR experiment was carried out to detect the reactive ·OH radicals to further confirm the capability of generating ROS on the surface of photocatalysts under visible-light (Fig. 8). No obvious signal was detected in the darkness, while a characteristic 1:2:2:1 signal of DMPO-·OH adduct was observed after visible-light illumination. With increasing the irradiation time, the intensity of DMPO-·OH signal increased stepwise. As expected, the concentration of the DMPO-·OH adduct formed in the SnO–TiO2 composite was greater than that formed during illumination of the TiO2 system. Combined with PL analysis, the acceleration of photodegradation mainly results from the separation of photo-generated charge carriers by SnO, which generated a greater quantity of ·OH radicals. The reactions and electron-transfer pathways involved in the photodegradation of MB by the SnO–TiO2 composite under visible light may be summarized as in the Eqs. 5–11.
 $${\rm{MB}} + {\rm{hv}} \to {\rm{MB}}^* \quad,$$
 $${\rm{MB}}^{\rm{*}} + {\rm{TiO}}_{\rm{2}} \to {\rm{MB}}^{{\rm{ + .}}} + {\rm{e}}_{{\rm{cb}}} ^ {\,\,\,\,\,\,-} {\rm{(TiO}}_{\rm{2}} {\rm{)\quad,}}$$
 $${\rm{e}}_{{\rm{cb}}} ^ {\,\,\,\,\,\,-} {\rm{(TiO}}_{\rm{2}} {\rm{)}} + {\rm{SnO}} \to {\rm{e}}_{{\rm{cb}}} ^ {\,\,\,\,\,\,-} {\rm{(SnO)}} + {\rm{TiO}}_{\rm{2}}\quad ,$$
 $${\rm{e}}_{{\rm{cb}}} ^ {\,\,\,\,\,\,-} {\rm{(TiO}}_{\rm{2}} {\rm{)}} + {\rm{MB}}^{{\rm{ + .}}} \to {\rm{MB\quad,}}$$
 $${\rm{e}}_{{\rm{cb}}} ^ {\,\,\,\,\,\,-} {\rm{(TiO}}_{\rm{2}} {\rm{ \,or \,\,SnO)}} + {\rm{O}}_{\rm{2}} \to {\rm{O}}_{\rm{2}} ^{ {\,\,\,\,-.} } \quad,$$
 $${\rm{O}}_{\rm{2}} ^{ {\,\,\,-.} } \to \to {\rm{HOO}}^. \to \to {\rm{H}}_{\rm{2}} {\rm{O}}_{\rm{2}} \to \to {\rm{OH}}^{^\scale130%.} {\rm{ (radical \;chain \;reactions),}}$$
 $${\rm{MB}}^{{\rm{ +. }}} + {\rm{(O}}_{\rm{2}} ^{ {\,\,\,-.} } {\rm{ or }}{\rm{\,\,^.OH)}} \to {\rm{degraded\; products}}\quad{\rm{.}}$$
The signal of DMPO-·OH adduct in the photocatalytic system for the EPR experiment after visible-light illumination. (a) Dark, (b) 30 s and (c) 60 s irradiation of TiO2, (d) 30 s and (e) 60 s irradiation of the SnO–TiO2 nanocomposite.

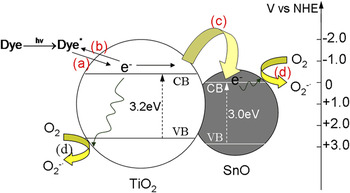
In the absence of SnO, electrons are much likely to recombine with those cation radicals (MB+.) on the surface of TiO2 (Eq. 8), and the overall photodegradation efficiency is thus suppressed. While in the SnO–TiO2 composite, electrons can be transferred within the formed p–n heterojunction between p-type SnO and n-type TiO2. Fig. 9 illustrates the flat band potentials of the valence and conducting bands at pH 7 [versus the normal hydrogen electrode (NHE)] for SnO and TiO2 with their band gap energy.Reference Blanca, Svane, Christensen, Rodriguez, Cappannini and Moreno12 Obviously, the conduction band potential of TiO2 is more negative than that of SnO, which favors the electron transfer from TiO2 to SnO (Eq. 7) by thermodynamic conditions. In this way, the opportunity for the recombination of ecb−(TiO2) and MB+. is reduced and, accordingly, the reduction of O2 by electrons (Eq. 9) is facilitated producing more ROS. The electron-transfer process occurring throughout the reaction is shown in Fig. 9.
Visible light-induced degradation of MB by the SnO–TiO2 composite. The letters represent the major electron-transfer pathways occurring in the system: (a) electron injection from excited dye molecules to the conduction band of TiO2 particles; (b) the recombination of electrons with dye radicals; (c) electron transfer from TiO2 to SnO particles; (d) reduction of O2 by the electrons on the surface of TiO2 or SnO.

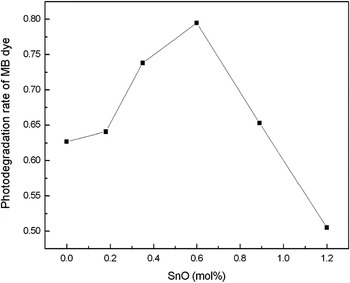
In the sense of separating charge carriers and promoting the reduction of O2, the incorporated SnO semiconductor plays the same role as noble metals (like Ag, Pt or Au) deposited on the surface of TiO2.Reference Bae and Choi39,Reference Li, Duan, Liu and Liu40 Similarly, the photocatalytic activity of the composite would be dependent on the concentration of incorporated SnO. The highest degradation efficiency for MB was obtained with the composite containing 0.6 mol% SnO (Fig. 10). The photodegradation rate decreased rapidly with the SnO loading exceeding the optimum value. Excessive SnO must have occupied too many sites and thus hindered the preadsorption of MB molecules on the TiO2 surface. Meanwhile, the electron-transfer from excited dye molecules to the conduction band of TiO2, which is the initial electron-transfer of the whole process, is blocked to a certain degree.
Effect of SnO concentration on the photodegradation rate of MB dye by SnO–TiO2 composite under visible irradiation. Irradiation time: 120 min. Concentration of SnO–TiO2: 0.28 g/L; initial concentration of MB dye: 8 mg/L; pH = 2.5; air-equilibrated.

IV. CONCLUSIONS
SnO–TiO2 composite nanocrystallites were prepared through a facile soft-chemical route, which successfully suppressed the oxidation of Sn(II). Through the co-hydrolysis of precursors followed by acidic peptization of the hydrolysate, semitransparent hydrosol containing 3–5 nm crystallites, which consists mostly of tetragonal SnO and anatase TiO2, was obtained. As a p–n heterojunction system, the photocatalytic activity was notably enhanced as compared to bare TiO2 hydrosol. The incorporated p-type SnO effectively promoted the separation of photo-generated charge carriers and the reduction of O2. This study provides a potential alternative for making composite nanoparticles at low temperature, especially for those components easy to be destroyed (e.g., be oxidized) with high-temperature treatment. It also suggests the feasibility of applying SnO together with TiO2 semiconductor in photocatalysis and makes it possible to further study the mechanism and electron-transfer pathways involved in p–n heterojunction systems, which are not yet so clear by far.
ACKNOWLEDGMENTS
The authors thank the National Natural Science Foundation of China (Grant Nos. 21001037 and 21075094), the Science Fund for Creative Research Groups (Grant Nos. 20621502 and 20921062) for financial support, the Specialized Research Fund for the Doctoral Program of Higher Education of China (Grant No. 20092302120073), and the Fundamental Research Funds for the Central Universities (Grant No. HIT.NSRIF.2009058).