I. INTRODUCTION
Over the past 10 years, flat panel display (FPD) has been developed significantly using amorphous and polycrystalline silicon. The success of silicon-based display has contributed to the growth of display industry. Recently, however, its growth based on Si-based FPD seems to be saturated and reaches to the limitation as the new paradigm of displays emerges, and this requires more advanced functionalities and specifications. For instance, the smart devices such as smart phone, tablet PC demand high pixel resolution to zoom in an arbitrary area of screen, and the three-dimensional (3D) display such as 3D TV requires ultra definition pixel resolution and high aperture ratio. Therefore, the current technological specifications require fast, flexible, and transparent display, calling for the use of better display materials than Si. For these reasons, a variety of materials were studied by many groups for next generation display. Among them, amorphous indium–gallium–zinc–oxide (a-IGZO) has been reported to be a good candidate, and a-IGZO thin-film transistor (TFT) has emerged as a promising solution for high performance backplanes in next generation display because it can provide high mobility, high optical transparency, and applicability for the low-temperature process compared to conventional silicon-based TFT.Reference Nomura, Ohta, Takagi, Kamiya, Hirano and Hosono1, Reference Hayashi, Sato, Ofuji, Abe, Yabuta, Sano, Kumomi, Nomura, Kamiya, Hirano and Hosono2 To improve the performance of practical a-IGZO applications, most of the studies focused on adjusting process variables such as gas partial pressure, chemical components of a-IGZO, contact resistance, and different plasma treatments. Some research group introduced the effect of hydrogen on the properties of oxide semiconductor.Reference Monakhov, Christensen, Maknys, Svensson and Kuznetsov3, Reference Kumar, Chatterjee, Milikisiyants, Kanjilal, Voelskow, Grambole, Lakshmi and Singh4 Additionally, Tsao et al.Reference Tsao, Chang, Huang, Chen, Chen, Tsai, Kuo, Chen and Wu5 found that the hydrogen-induced passivation of interface trap states between a-IGZO and dielectric layer caused an improvement in subthreshold swing (SS). Even though there are many advantages, it is important to control the hydrogen dose because device stability is sensitive to the amount of hydrogen after plasma treatment. Also, it is important to analyze the role of hydrogen in a-IGZO film.
Therefore, through this study, we show the change in characteristics of TFT, the role of hydrogen in a-IGZO, and the change of oxygen vacancy and trap charge density with the amount of hydrogen dose. We fabricated a-IGZO TFTs with different hydrogen plasma treatment time. Al2O3 passivation layer was deposited to protect the TFT from the ambient atmosphere. Temperature instability test was carried out to examine the electrical property change, and x-ray photoelectron spectroscopy (XPS)/secondary ion mass spectroscopy (SIMS) was used to analyze the chemical changes. Based on the Arrhenius equation, the activation energy for devices was calculated, which would account for the change of the oxygen vacancy and trap charge density.
II. EXPERIMENTAL DETAILS
A typical bottom gate-type device structure was used for the fabrication of the a-IGZO TFTs. A thermally grown 100 nm thick SiO2 layer on a p-type Si (1-10 Ωcm) was used as substrate in fabricating the TFTs. Si and SiO2 were used as the gate electrode and gate dielectric, respectively. A 70-nm-thick a-IGZO film was deposited to function as active layer by using radio frequency (RF) magnetron sputtering at room temperature. The composition of the a-IGZO target was 1:1:1 mol% of In2O3:Ga2O3:ZnO. The sputtering was performed with an Ar/O2 gas with a mixing ratio of 54:2, at a RF power of 100 W, and a working pressure of 5.0 mTorr. A liftoff process was used to define the channel patterns, and the channel length (L) and width (W) were 200 and 800 μm, respectively. After deposition of the channel layer, source/drain electrodes of Ti/Au (80/40 nm) were deposited with an e-beam evaporator. All the fabricated devices were annealed in the forming gas ambient at 250 °C for 1 h. Hydrogen plasma treatment was carried out for the three samples fabricated as above with different treatment times such as 100, 200, and 300 s respectively, by a 200-W remote plasma. A 50-nm-thick Al2O3 film was deposited as a passivation layer by remote plasma atomic layer deposition. The changes in the chemical bonds of the a-IGZO films due to the hydrogen plasma treatment in each device were analyzed using XPS. Additionally, the effective depth of hydrogen plasma was determined using time of flight secondary ion mass spectroscopy (TOF-SIMS). The I–V characteristics of hydrogen-treated devices were measured at temperatures ranging from 25 to 70 °C with an Agilent B1500 precision semiconductor parameter analyzer (Agilent Technologies, Inc., Santa Clara, CA). We varied V GS from −10 to 30 V applying a V DS of 5 V. Measurement was done in dark, and device temperature was regulated by heated chuck of MSH-1000A temperature controller. TFTs were placed on the heated chuck for 5 min to reach the desired measurement temperature, to set at thermal equilibrium.
III. RESULTS AND DISCUSSION
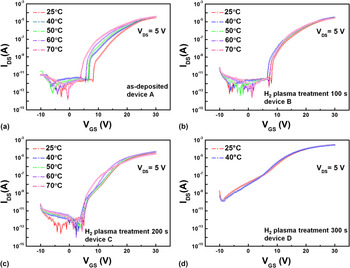
Figures 1(a)–1(d) show the evolution of the I–V transfer characteristic curves as a function of the thermal stress for devices, (i) as deposited (device A), (ii) H2 plasma treated for 100 s (device B), (iii) for 200 s (device C), and (iv) for 300 s (device D), respectively. We varied temperature from 25 (room temperature) to 70 °C. However, only two temperatures of 25 and 40 °C were applied to device D because it already showed serious degradation at these temperatures.
The evolution of the I-V transfer curves with increasing temperature from 25°C to 70°C for (a) as-deposited, (b) H2 plasma treated for 100 s, (c) H2 plasma treated for 200 s, and (d) H2 plasma treated for 300 s.

In this analysis, we focused on the three important factors of TFT. First, the SS was evaluated. SS is defined as following:

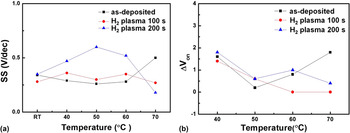
It reflects the value of voltage between gate and source (V GS) required to obtain a 10 times larger current between drain and source (I DS) in the subthreshold region. The value of SS is dependent on V GS, and small value of SS is advantageous for good device performance. It is related to interface trap charge density, N it, and bulk trap charge density, N bulk.Reference Jeong, Yang, Park, Jeong, Mo, Kim, Song and Hwang6 Second, the turn on voltage (V on) was analyzed. V on means the gate voltage when electron accumulation is started between source and drain by turning on gate. The turn on voltage shift, ΔV on, is affected by various trap in the device, such as interface trap charge, bulk trap charge, and back-channel surface by ambient atmosphere.Reference Kamiya, Nomura and Hosono7 The variation of V on and SS with increasing temperature can be referred to “stability,” which is affected by some type of charge rearrangement or generation at or near the gate insulator channel layer. Possible instability mechanisms include (i) electron injection and trapping within gate insulator, (ii) deep state creation, and (iii) electron trapping within the IGZO channel layer.Reference Hoshino, Hong, Chiang and Wager8 Therefore, the small variation of V on and SS means good stability. Third, the I on/I off is the ratio of the maximum current and starting off state current, which means the TFT working range, and the larger the I on/I off range, the better the performance. In Fig. 1(a), device A gave the value of SS as 0.34 V/decade, V on as 8.2 V, and the I on/I off ratio of 1.7 × 10⁷ at room temperature. Changes in these parameters were observed with higher measurement temperatures. The value of SS increased from 0.34 to 0.5 (∼0.16 V/decade) and V on shifted negatively from 8.2 to 3.8 (∼4.4 V) with increasing measurement temperatures from 25 to 70 °C. Temperature dependence of these parameters could be explained by multiple trapping model as in the case of hydrogenated amorphous silicon TFT.Reference Lecomber and Spear9 At higher temperatures, more electrons can be escaped from localized states and contributed to the free carriers, which caused a higher mobility and smaller turn on voltage. In addition, transfer curve showed two distinct regimes having different slope at a certain temperature condition. It was seen that a part with very steep slope right after the device turned on and another part with moderate slope. It could be regarded as a kind of hump, which was caused by the point defect by process and ambientReference Kim, Jeong, Yun, Yang, Lee, Lee and Lee10, Reference Park, Hwang, Ryu, Yang, Byun, Shin, Lee, Lee, Oh and Im11 or the combination of a dominant transistor and a parasitic transistor.Reference Huang, Peng, Yang, Sun, Chang, Kuo, Chang, Liu and Liu12 In this experiment, hump existed initially by process and then became less significant at higher temperature, suggesting that the detrapping by the Frenkel–Poole type emission became dominant.Reference Huang, Peng, Yang, Sun, Chang, Kuo, Chang, Liu and Liu12 Therefore, it could be thought that initial hump acted as interface trap, which degraded transfer characteristic, and it was in decline at higher temperature. In contrast to device A, notable changes were observed after H2 plasma treatment for device B. Device B showed a value of 0.28 V/decade for SS, V on was 8.0 V, and the I on/I off ratio was 2.3 × 10⁷ at room temperature. A very small change was observed in SS (∼0.08 V/decade) and V on (negative shift∼1.4 V) with the same temperature variation as in sample A. Moreover, device B showed less significant hump than device A. Interestingly, another change was observed by longer plasma treatment time as shown in Fig. 1(c) for device C. Device C showed a value of 0.35 V/decade for SS, 5.0 V for V on, and 2.0 × 10⁸ for I on/I off ratio at room temperature. Device C showed a small turn on voltage and large I on/I off ratio at room temperature. However, the value of SS increased (∼0.25 V/decade) with increasing temperature. In addition, device C showed serious hump except for 70 °C. Although small turn on voltage and large I on/I off ratio were obtained, stability of device C is worse than that of device B as evident from Fig. 1(c). Device D after the 300-s H2 plasma treatment showed a serious degradation of the value of SS (2.84 V/decade), V on (−9.0 V), and I on/I off ratio (2.0 × 10⁶) at room temperature. Figure 2 shows an intuitive comparison of the change of (i) SS and (ii) turn on voltage for each device. It was seen that device B, which treated for a 100-s H2 plasma, has an improved stability, while stability started to decrease for a larger treatment time of 200 s (device C) with increasing measurement temperature. Finally, a serious degradation was observed for a 300-s treatment time for which ΔSS and ΔV on indication was meaningless. Therefore, the change of stability was attributed to hydrogen dose by H2 plasma treatment, which affected IGZO bulk and IGZO–gate dielectric interface.
(a) The comparison of subthreshold swing and (b) the comparison of Von negative shift among each device with different H2 plasma treatment time with increasing temperatures.

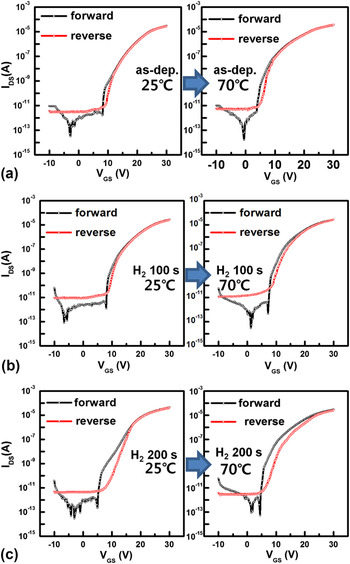
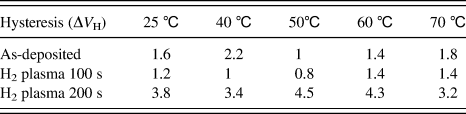
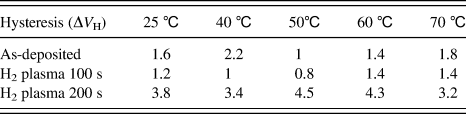
Hysteresis was measured for each sample to analyze relationship between transfer characteristic and trap charge with different hydrogen dosing and temperature (forward: V G = −10 to 30 V, reverse: V G = 30 to −10 V). Figure 3 shows hysteresis loop, and Table I summarizes hysteric behavior for each condition. H2 plasma treatment 300-s sample was excluded because it showed serious degradation at room temperature. We considered threshold voltage and its shift in hysteresis loops to discuss hysteric behavior. The symbol of ΔV H was defined as the value of V T shift in hysteresis loops. The initial trap charge at the channel/dielectric interface will influence the hysteric behavior. In addition, a hysteric behavior is easily observed as numbers of traps exist at the channel/dielectric interface by forward/reverse gate voltage sweep.Reference Chung, Kim, Kim, Ryu, Lee and Hwang13Figures 3(a)–3(c) show the hysteresis loop of each device depending on different hydrogen dosing at 25 (room temperature) and 70 °C. At 25 °C, ΔV H was about 1.5 V for device A, was about 1 V for device B, and was about 3.7 V for device C. Because the shift of transfer curve in hysteresis loops is attributed to the interface states, ΔV H change increases with the increasing interface trap density. Thus, the interface trap density was reduced by H2 plasma treatment 100 s (device B) and was increased by H2 plasma treatment 200 s (device C), meaning that larger interface trap density leads to inferior SS and hump corresponding to Fig. 1. In Table I, as temperature grew up to 50 °C, ΔV H showed the tendency to decrease in device A and B, which means interface trap sites are occupied with thermally activated carriers. Additionally, although the V on negative shift of device A was increased with higher temperature in Fig. 1, device A showed small ΔV H with higher temperature in Table I. Hence, the increase of V on negative shift with higher temperature can be considered as the contribution of deep state carrier, which is activated by thermal energy. Contrarily, large ΔV H was maintained in device C with increasing temperature, which was considered excessive hydrogen act as trap charge at interface. The results imply that the introduction of hydrogen into IGZO layer either reduces or increases the interface trap density and the number of deep state and affects the transfer characteristics of TFTs.
Hysteresis loops of a-IGZO at 25°C, 70°C (a) as-deposited, (b) H2 plasma treated for 100s, and (c) H2 plasma treated for 200s.

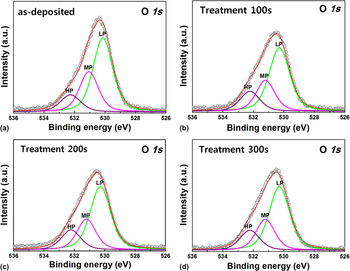
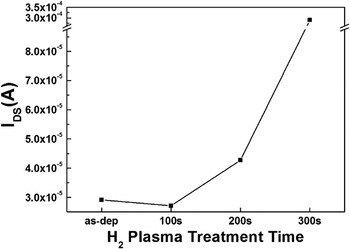
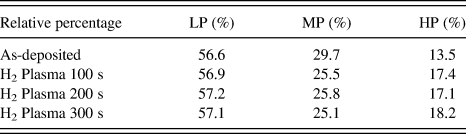
XPS and TOF-SIMS measurements were performed to find out the quantitative and qualitative chemical property change of a-IGZO film. Samples were prepared in 2 × 2 size under same process condition as mentioned above without Al2O3 passivation layer to focus on relation with a-IGZO and hydrogen. Each sample was sputtered for 600 s to become free from surface contamination such as carbon. The XPS spectrum was calibrated by taking the binding energy of the C 1s peak (285 eV) as a reference. The XPS spectra showed in Fig. 4 indicated the presence of OH− groups, which can contribute to the hydrogen concentration. The O 1s peaks were analyzed through a combination of Gaussian (60%) and Lorentzian (40%) fitting. The O 1s peaks, which centered at 530.3 eV with a shoulder at 532 eV, could be deconvoluted into three subpeaks. The area ratio was calculated for the three peaks corresponding to the low binding peak (LP), middle binding peak (MP), and high binding peak (HP) centered at around 530.30, 531.41, and 532.45 eV, respectively. The LP at around 530.30 eV was attributed to O2− ions surrounded by Zn, Ga, and In atoms in the a-IGZO compound system, which indicated the amount of oxygen atoms in a fully oxidized stoichiometric environment. The MP, centered at around 531.41 eV, was associated with O2− ions in the oxygen-deficient regions within the matrix of the a-IGZO and indicated presence of oxygen vacancies. The HP, located at around 532.45 eV, was attributed to surface oxygen species.Reference Kim, Kim, Shin, Ahn, Kim and Kim14 The relative area percentages of the LP, MP, and HP for the O 1s spectra obtained from a-IGZO films in the all the four cases are listed in Table II. The area ratios of MP/(LP + MP + HP) for devices B, C, and D were found lower than that of device A. The oxygen vacancies related to MP acted as an electron donor and supplied free electron carriers in the a-IGZO film and lead to an alteration in the conductivity of the a-IGZO active layer.Reference Bellingham, Mackenzie and Phillips15, Reference Nomura, Kamiya, Ohta, Hirano and Hosono16 In contrast, it should be noted that the area ratios of HP/(LP + MP + HP) for devices B, C, and D were higher than that of device A. This indicated that H incorporation into the IGZO lattice occurred in the form of hydroxyl group (OH) as a result of reaction between (i) reactive H species (e.g., radicals and ions) in plasma and (ii) O species bound to metal ions. Kamiya et al. asserted the role of OH groups as a strong n-type donor through their recent study on H-impurity in an a-IGZO.Reference Kamiya, Nomura and Hosono17 asserted the role of OH groups as a strong n-type donor. In our experimental results, we find dependence in saturation current with the H2 plasma treatment. As shown in the Fig. 5, there occurs a decrease in conductivity for 100-s H2 plasma-treated sample from the as-deposited sample. As the H2 plasma treatment time increases, the conductivity increases for 200 and 300 s. This is because initially, hydrogen-passivated oxygen vacancies and then the excess hydrogen contribute to the increased conductivity as explained in the references. Our results substantiated the observation of Kamiya et al. by the fact that the H2 plasma treatment decreased the oxygen vacancies and increased the surface oxygen species as seen from the HP/(LP + MP + HP) ratio.
XPS spectra of O 1s for (a) as-deposited, (b) H2 plasma treated for 100 s, (c) H2 plasma treated for 200 s, and (d) H2 plasma treated for 300 s.

Comparison of saturation current for as-deposited, H2 plasma treated for 100 s, H2 plasma treated for 200 s, and H2 plasma treated for 300 s.

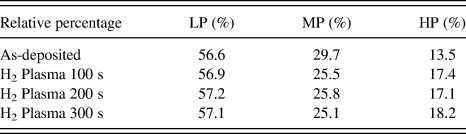
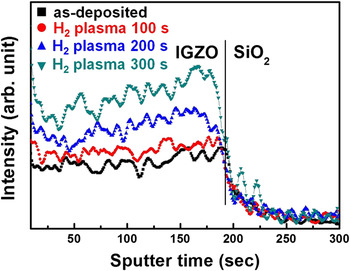
Figure 6 shows the SIMS depth profiles of each device (device A, B, C, and D) for hydrogen. The distribution of hydrogen was analyzed quantitatively by comparing each other depending on H2 plasma treatment time. More hydrogen atoms were observed in devices B, C, and D than that of device A. The SIMS depth profiles showed more hydrogen dose for longer H2 plasma treatment in the entire channel layer. Interestingly, a large increase in hydrogen was found in devices C and D unlike XPS result. This is assumed that the hydrogen atoms bonded to oxygen atoms are less in number, while the remaining hydrogen atoms are either chemically attached to other atoms or exist in interstitials. In contrast, SIMS can detect the hydrogen atoms in the whole sample including the metastable hydrogen in the interstitial sites. In addition, the SIMS profile revealed that the H2 penetrates into channel layer down to about 70 nm. The hydrogen atoms increased rapidly over H2 plasma treatment especially for 200 s, and therefore, it was expected that the increased hydrogen dose can have a larger impact on N bulk and N it.
SIMS depth profiles of hydrogen atoms in a-IGZO depending on H2 plasma treatment time.

Based on the above experimental results, it is possible to explain the role of hydrogen in a-IGZO. In ZnO-based semiconductor, the conductivity occurs due to three kinds of native donors such as oxygen vacancies, Zn interstitials, and H incorporation.Reference Seo, Park, Cho, Kim and Choi18, Reference Lin, Chen, Liao and Chen19 In addition, Hosono Group reported that some of oxygen vacancies generate free electrons and affect electrical conductivity of a-IGZO films. Moreover, it was found that most of oxygen deficiencies are deep state, while a small portion of oxygen vacancies are near conduction band minimum (CBM).Reference Kamiya, Nomura and Hosono20 As mentioned above, in our experimental results, as-deposited sample (device A) showed increased ΔV on and small hysteric behavior with higher temperature. However, H2 plasma treatment for 100 s (device B) showed the decreased ΔV on and small hysteric behavior with higher temperatures. In the case of H2 plasma treatment for 200 s (device C), even though ΔV on was also decreased, hysteric behavior was increased with serious hump. Finally, a severe degradation was observed in H2 plasma treatment for 300 s (device D). Based on the above facts and experimental results, the role of hydrogen atoms in a-IGZO TFTs can be explained as follows. The proper amount of hydrogen atoms could occupy the channel/dielectric interface trap site and deep trap site (device B). This suggests that oxygen vacancies at deep site or near CBM could be passivated by moderate hydrogen dosing. However, surplus amount of hydrogen atoms acted as interstitial defects (device C and D). These interstitial defects had bad influence on device stability. Thus, the oxygen vacancies could be affected by H2 plasma treatment and the device stability could be improved by the proper dose of hydrogen atoms.
Lastly, we considered the activation energy (E A) from Arrhenius plots to estimate the contribution of hydrogen atoms to device characteristics in band gap. Negative V on shift with increasing temperatures was explained by the thermal activation process of the subthreshold drain current.Reference Ji, Kim, Jung, Park, Mo, Jeong, Kwon, Ryu, Lee, Choi and Jeong21, Reference Jeong, Jeong, Park, Mo and Hong22 The subthreshold current in amorphous TFT has been well described by the Arrhenius equation,

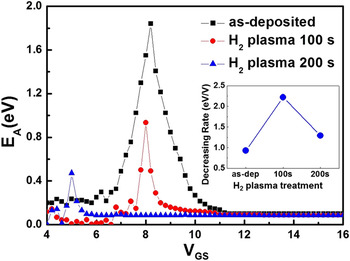
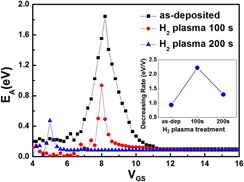
where it is assumed that thermally activated electrons from trap sites in the IGZO move into the conduction band of IGZO, which acts as channel through which the electrons move to drain electrode due to the V DS. Hence, the conductance activation energy (E A) was calculated using the thermal excitation of the trapped charge in IGZO as a function of V GS from the fitting of the temperature-dependent log(I DS) versus 1/T curve (Fig. 7), where E A = E C − E F assuming Boltzmann statistics.Reference Slade, Shur, Deane and Hack23, Reference Pichon, Mercha, Carin, Bonnaud, Mohammed-Brahim, Helen and Rogel24 We compared the E A of device A, device B, and device C except for device D because its serious degradation made the comparison meaningless. The maximum E A value (1.84 eV) for device A was observed at a V GS of 8.2 V and then gradually decreased to 0.1 eV at a V GS of 9.8 V. In contrast, energy barrier for device B was approximately 0.93 eV at a V GS of 8.0 V, and E A decreased very rapidly to 0.1 eV at a V GS of 8.6 V. The maximum E A (0.47 eV) for device C was observed at a V GS of 5 V and E A decreased quickly to 0.1 eV at a V GS of 5.4 V. The decrease of E A with respect to V GS in the subthreshold current region should have the same magnitude as the upward shift of E F to conduction band. In the case of a-IGZO TFT having oxygen vacancies and total trap density (N total) including N bulk and N it, the variation of E F with respect to V GS(∂E F/∂V GS) is roughly inversely proportional to the magnitude of oxygen vacancies and N total. This is because all the oxygen vacancies and trap sites below E F must be fulfilled with electrons before moving into the E F level in the forbidden band gap region. In particular, the most significant change of E A was observed near V on for all devices as shown in Fig. 7. In this V GS range near V on, the interfacial traps at a-IGZO/gate dielectric were highly accessible and become major electron trapping source under the accumulation channel mode. Therefore, the energy distribution of interfacial trap states was responsible for the dramatic change in E A near V on in contrast to other V GS region. The decreasing │ΔE F/ΔV GS│ ratio (inset of Fig. 7) of device A was about 0.93 eV/V, that of device B was about 2.22 eV/V, and that of device C was about 1.29 eV/V. This indicated that the oxygen vacancies and total traps were reduced by approximately 2.4 times by H2 plasma treatment for 100 s (device B). However, only a decrease of 1.4 times was observed by H2 plasma treatment for 200 s, which was assumed to cause excessive hydrogen atoms, and acted as interstitial defects. Therefore, it was inferred that the proper H2 plasma treatment could lead to the better temperature stability by reducing oxygen vacancy and N total at IGZO bulk and the channel/dielectric interface.
The variation of the activation energy (EA) of the I DS vs. VGS for as-deposited, H2 plasma treated for 100 s, and H2 plasma treated for 200 s.

IV. CONCLUSIONS
In this study, we investigated the effect of H2 plasma treatment on a-IGZO film by fabricating devices and treating H2 plasma for different time. The electrical property was measured for all devices by varying temperature. The proper dose of H2 plasma-treated device (device B) demonstrated improved characteristics, i.e., small SS, small negative turn on voltage shift, and small hysteric behavior under thermal stress. However, excessive hydrogen dose by longer treatment time brought about deterioration of device properties, and finally, serious degradation occurred. The incorporation of proper dose of hydrogen, into a-IGZO layer by plasma treatment, passivated not only the oxygen vacancies but also the total traps that existed in channel layer and channel/dielectric interface. However, the higher hydrogen concentrations incorporated into a-IGZO by longer time of H2 plasma treatment acted as interstitial defects rather than the passivating role. This speculation was supported by calculated decreasing rate of activation energy from Arrhenius plots. It was found that the decreasing rate of activation energy was in the same magnitude as of the upward shift of Fermi level to conduction band. This showed that the number of oxygen vacancies and trap sites were decreased in accord with the decreasing rate of the activation energy. Thus, the maximum decreasing rate was observed in proper H2 plasma-treated device. Therefore, our study suggests that the proper dose of H2 plasma treatment can be adopted to control device stability and hydrogen dose should be optimized according to process conditions to get devices with good characteristics.
ACKNOWLEDGMENTS
This work was supported by a National Research Foundation of Korea (NRF) grant funded by the Korean government (MEST) (No. 2011-0015436).