


Introduction
The Himalayan glaciers have retreated remarkably in the past two decades (Reference Fujita, Kadota, Rana, Kayastha and AgetaFujita and others, 2001; Reference Bajracharya, Mool and ShresthaBajracharya and others, 2007), and area loss rates have accelerated in recent decades due to climate change (Reference Bajracharya and MoolBajracharya and Mool, 2009; Reference BolchBolch and others, 2012). Although it is still ambiguous which climatic parameter plays the main role in glacier retreat, the current glacier retreat in the Himalaya is due to the combined effect of reduced precipitation and warmer temperature (Reference Ren, Jing, Pu and QinRen and others, 2006). There are very few data on the glaciers of Bhutan. Although glacier inventories for most parts of the world have been ingested into the Global Land Ice Measurements from Space (GLIMS) database (Reference Raup, Racoviteanu, Khalsa, Helm, Armstrong and ArnaudRaup and others, 2007) and Randolph Glacier Inventory v.3.0, the glacier outline from the Bhutan region is still incomplete (Reference ArendtArendt and others 2013). The glacier inventory of Bhutan was first prepared by ICIMOD in 2001 based on topographic maps of the 1970s, and estimated a glacier area of ~1317 km2 (Reference Mool, Wangda, Bajracharya, Kunzang, Gurung and JoshiMool and others, 2001a, Reference Mool, Bajracharya and Joshib). The glacier area mapped in Bhutan and the adjacent area in 2012 was ~1930 km2 (Reference Rupper, Schaefer, Burgener, Koenig, Tsering and CookRupper and others 2012), which was larger than the ICIMOD estimate in 2001. ICIMOD 2011 (Reference Bajracharya and ShresthaBajracharya and Shrestha, 2011; Reference BolchBolch and others, 2012) mapped the glaciers of the Hindu Kush-Himalayan region, including the Bhutan Himalaya, from Landsat images of 2005 ± 3 years and estimated a glacier area of -642 km2 (based on Bhutan’s new national boundary). The Bhutan data are based on late 2008, so there is no difference in area with the present inventory of 2010.
This study will help us to understand the trend of glacier change in the decades from ~1980 to 2010 and the status of glaciers in Bhutan in the coming years.
Study Area and Data
Study area
Bhutan is a small, landlocked and mountainous country located at 268450 –288100 N, 888450–928100 E on the southern slopes of the eastern Himalaya. The Amochu (Torsa), Wangchu, Punatsangchu (Sankosh), Manaschu and Nyere Amachu are the main rivers of Bhutan and tributaries of the Brahmaputra River in India. All the rivers except the Amochu and Nyere Amachu are glacier-fed in Bhutan.
Satellite images
Two Landsat images cover the total area of the Bhutan Himalaya. Landsat images of 1977/78 (-1980), 1990, 2000 and 2010 with least snow and no cloud cover were obtained from the United States Geological Survey (USGS). The suitability of a particular image depends on the presence or absence of seasonal snow, cloud cover and the date of acquisition. The images for -1980 had a smaller choice and somewhat more snow cover than those for the other years. The snow cover is eliminated by comparing with topographic maps and images of 1975/76.
Methods
The glacier mapping from automated multispectral classification of optical satellite data in combination with a digital elevation model (DEM) is a well-established procedure (Reference Paul and KääbPaul and Käab, 2005; Reference Bhambri and BolchBhambri and Bolch, 2009; Reference Paul and AndreassenPaul and Andreassen, 2009; Reference Racoviteanu, Paul, Raup, Khalsa and ArmstrongRacoviteanu and others, 2009; Reference Bolch, Menounos and WheateBolch and others, 2010; Reference Frey and PaulFrey and Paul, 2012). A semi-automatic methodology was used separately for delineation of clean-ice (CI) and debris-covered (DC) glaciers using an object-based image classification (OBIC) approach (Reference Bajracharya and ShresthaBajracharya and Shrestha, 2011). The image classification was processed in eCognition Developer software. Primarily, the 2010 image was segmented using multi-resolution segmentation which creates the image object based upon spectral, shape, orientational and textural characteristics. The image objects are a group of pixels having homogeneous characteristics. These image objects were classified by developing rule sets based on spectral and spatial characteristics. The rule set used the mean value of the defined areas instead of individual pixel value. It is developed separately for classification of CI and DC glaciers.
All the classified CI and DC image objects were merged and the products were exported to an .shp file. The glacier polygons were manually separated into the individual glaciers based on the hydrological catchments by overlaying on images and hillshade generated from the DEM in the ArcGIS environment. Further, the glacier polygons of 2010 were overlaid on the Landsat images of 2000, 1990 and -1980 to generate the glacier outlines manually for the respective years.
Mapping of clean-ice glacier
The identification of CI glaciers relied mainly on the normalized difference snow index (NDSI = [VIS (red, TM3)-SWIR (TM5)]/[VIS + SWIR], where VIS is the visible band, TM is the Landsat Thematic Mapper and SWIR is the shortwave infrared band), which is often used to discriminate between snow, soil, rocks and cloud cover. Besides the ability to map snow in rough topography (Reference Silverio and JaquetSilverio and Jaquet, 2005), this index provides a good contrast between bare ice and its surroundings at the glacier tongue (Reference Hall, Bayr, Schöner, Bindschadler and ChienHall and others, 2003). The CI glaciers were mapped by applying NDSI threshold values (Reference Silverio and JaquetSilverio and Jaquet, 2005). Typically, NDSI values of CI glaciers in Landsat images lie between 0.5 and 0.7 (Reference Hendriks and PellikkaHendriks and others 2007), differing from image to image due to illumination differences. We used the NDSI threshold value >0.5 to capture the CI segments based on the histogram, visual inspection and sampling values. Even using the precise threshold value, the captured CI image objects are either over- or less captured. We prefer over-capture so as not to miss the glacier image objects. The over-captured image objects comprise shadow, water bodies, vegetation, bare rock and debris, which were removed by performing different filters including the normalized difference vegetation index (NDVI = [NIR (TM4)-VIS (TM3)]/[NIR + VIS], where NIR is the nearinfrared band) threshold value of >0.34 for vegetation, a land and water mask (LWM = ([SWIR/VIS] +0.0001) x 100) threshold value of >31.5 for water bodies, and mean hue for shadow. Further, slope with a threshold value >60° and elevation <4600ma.s.l. was applied to remove the misclassified CI image objects.
Mapping of debris-covered glacier
Once the CI glaciers were mapped, the DC glaciers were captured from the remaining unclassified image objects using a slope threshold value of <25° and elevation between 6000 and 3000ma.s.l. depending upon the locality. Reference Paul, Huggel and KääbPaul and others (2004) followed a semi-automated approach to map a DC glacier using the slope gradient. Capturing of DC glaciers is complicated by effects from the surroundings (Reference Paul, Huggel and KääbPaul and others, 2004; Reference Bolch and KampBolch and Kamp, 2006; Reference Bolch, Buchroithner, Kunert and KampBolch and others, 2007; Reference Racoviteanu, Paul, Raup, Khalsa and ArmstrongRacoviteanu and others, 2009). Further, the misclassified image objects were then removed using the threshold values of NDVI (>0.3), NDSI (>0.005) and LWM (50-115.8) for vegetation, snow and land and water bodies respectively.
This process satisfactorily delineates the outline of DC glaciers which were then finalized by manual editing at a scale of 1 :20 000 by draping over high-resolution images from Google Earth. Special attention was given to defining the outline and snout of the glaciers.
Equilibrium-line altitude
The snowline altitude in a glacier measured after the summer is known as the equilibrium-line altitude (ELA; Reference Rabatel, Dedieu and VincentRabatel and others, 2005, Reference Rabatel, Letréguilly, Dedieu and Eckert2013). The images of no cloud and least snow cover from September to early November were selected to compute the ELA. The image bands TM5 (SWIR), TM4 (NIR) and TM2 (green) are the most appropriate band combination in red, green, blue (RGB) to identify the limit between snow and ice (Reference RabatelRabatel and others, 2012). The ELAs were drawn from at least 10-20 points of snow and ice boundary for each glacier. The average ELA is computed from the Shuttle Radar Topography Mission (SRTM) DEM. The ELAs of 32 valley glaciers were delineated manually for all decades.
An uncertainty of each ELA was calculated as the standard deviation of altitude of all the points of snowline in each glacier.
Accuracy
The accuracy of the glacier outlines depends, typically, on the resolution of the images used, seasonal snow, shadow and the contrast between the glacier and its surroundings (Reference DeBeer and SharpDeBeer and Sharp, 2007). The most accurate way to assess glacier outlines is to use high-resolution imagery (Reference PaulPaul and others, 2013), but such data were not available for our study region. Hence, the available medium-resolution Landsat images with least snow and no cloud cover were used. To minimize the uncertainties, the OBIC-derived glacier image objects were refined by editing manually with reference to the high-resolution images available from Google. The delineated glacier boundaries were affected by various types of obscurities, and maximum offset of the boundary was assigned to each type of obscurity, which could not be greater than half of the image resolution (i.e. ±15 m in TM and Enhanced TM Plus (ETM+) and ±40 m in Multispectral Scanner (MSS)). Hence, the uncertainties of the glacier area were estimated by variation of each glacier area from the glacier polygon (depending on projection parameter) and area calculated on pixel base (depends on image resolution). The pixel-based area is calculated as the product of the total number of pixels bounded by the glacier boundary and the image resolution.
The total uncertainty (error) of glacier area was calculated as

where ai is the area of glacier from the glacier polygon and ai is the area of glacier calculated on the pixel base.
The uncertainty of glacier area in the present study is variously 3.4%, 2.5%, 2.4% and 2.5% for the years ~1980, 1990, 2000 and 2010 respectively. These mapping uncertainties are within the range of previous estimates of - 3 % (Reference Paul, Kääb, Maisch, Kellenberger and HaeberliPaul and others, 2002; Reference Bolch, Menounos and WheateBolch and others, 2010; Reference Frey, Paul and StrozziFrey and others, 2012).
Results
A total of 885 glaciers were mapped from the images of 2010, with an area of 642 ±16.1 km2 (1.6% of Bhutan’s total land) (Table 1; Fig. 1). The Punatsangchu basin has the highest number of glaciers (436) and glacier area (361.6 ±9.3 km2), and the Wangchu basin has the lowest number of glaciers (56) and glacier area (32.8 ±0.7 km2). The largest glacier is G090161E28125N in the Phochu sub-basin of Punatsangchu basin with an area of 36 km2. The glacier elevation ranges from 7230 m a.s.l. (in the Manaschu basin) to 4050 m a.s.l. (in the Punatsangchu basin).
Number and area of clean-ice (CI) and debris-covered (DC) glaciers and largest glaciers in ~1980, 1990, 2000 and 2010 in the basins and sub-basins of Bhutan. All the glaciers were mapped with CI, some of which was DC except in Thimchu and Dangmechu sub-basins

Distribution of glaciers in the sub-basins of Bhutan in 2010. (The boundary of Bhutan is provided by National Land Commission, Bhutan, 2007.)

Decadal glacier change
Overall, the number of glaciers shows an increasing trend, whereas the glacier area shows a decreasing trend in the decades from -1980 to 2010 (Fig. 2).
Status of glacier area in ~1980, 1990, 2000 and 2010 and its trend. Blue diamonds represent the glacier area, vertical bars represent the error and the diagonal line indicates the trend of the glacier area change.
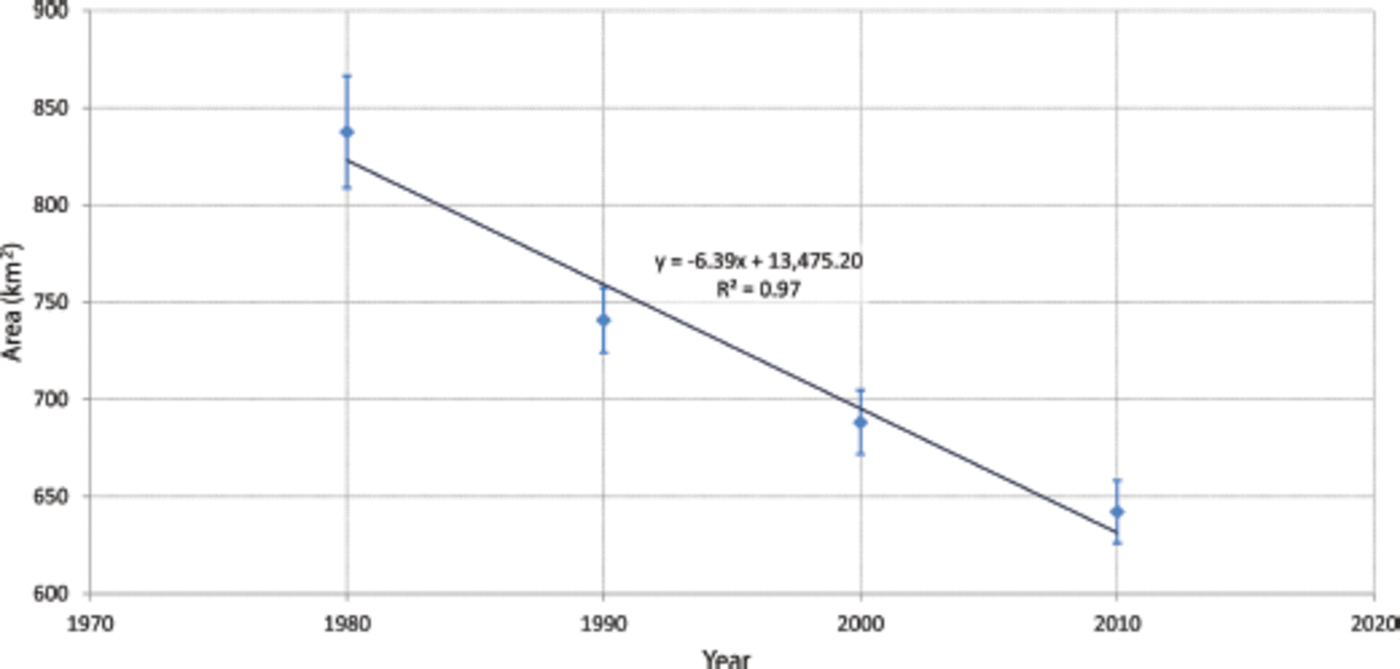
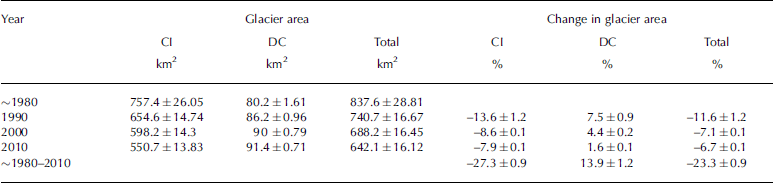
The number of glaciers increased by 7%, 5.3% and 1.2% during the decades -1980-90, 1990-2000 and 2000-10 respectively, with an overall increase of 14.8% in 30 years (-1980 to 2010) (Table 1). The glacier area decreased by 11.6 ± 1.2%, 7.1 ± 0.1% and 6.7 ± 0.1% during the decades -1980-90, 1990-2000 and 2000-10 respectively, with an overall decrease of 23.3 ± 0.9% in 30 years (Tables 2 and 3). The average glacier area in -1980 was >1 km2 but decreased to <1 km2 in consecutive decades due to an increase in the number of glaciers and a decrease in glacier area. The increase in number with concomitant loss of glacier area indicates fragmentation of existing glaciers due to shrinking rather than the development of new glaciers.
Decadal CI and DC glacier area change from ~1980 to 2010
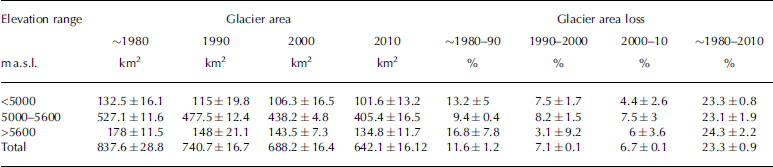
Decadal glacier loss in different elevation zones in Bhutan
Nonetheless glacier number slightly decreased in 2010 due to the dissolution of glaciers on steep slopes. As an example, changes in glacier boundaries over time in the Landsat images for the Lunana area are shown in Figure 3.
The change in glacier boundaries from -1980 to 2010 in the Lunana area of Bhutan. There was a strong area loss between -1980 and 1990. The background image is Landsat ETM+ of 2010 after SLC off gap filled. The distinct ice mass disappearance between ~1980 and 1990 is at the examples (A) at the steep slopes and (B) in the lake area. during four periods also confirmed the melting of CI glaciers. However, the DC glaciers with lake at the snout showed faster recession due to the expansion of lakes or formation of supraglacial lakes.

The values for the area and change in area of CI and DC glaciers from ~1980 to 2010 are summarized in Table 2. In 2010, DC glaciers comprised ~14.23% of total glacier area. This value is 4.53% higher than the average value for the Hindu Kush-Himalayan region (Reference Bajracharya and ShresthaBajracharya and Shrestha, 2011). The DC glaciers were only identified at elevations below 5548 ma.s.l., which is the region where glacier area loss is highest (Fig. 4). Additional DC glaciers were also exposed due to the loss of CI glaciers in the lower valleys. Once the lake was formed in the DC glaciers, the glaciers retreated markedly, as observed in lakes such as Imja and DigTsho in Nepal, and Luggye, Raphstreng, Thorthormi and Tarina in Bhutan (Reference Bajracharya, Mool and ShresthaBajracharya and others, 2007). In all decades, the area of CI glaciers decreased, whereas the area of DC glaciers increased but by a much smaller amount. Overall, from ~1980 to 2010, CI glacier area decreased by 27.3 ±0.9% (206.6km2) and DC glacier area increased by 13.9±1.2% (11.1 km2).
Hypsography of all glaciers of Bhutan in -1980, 1990, 2000 and 2010.

The linear regression trend analysis of the decadal glacier area change is statistically significant at the 95% confidence level with p-value 0.017. The trend of glacier area change per decade from the ~1980s to 2010 is -6.39 ±1.6% (Fig. 2).
Decadal glacier area change in different elevation zones
Glaciers mapped in Bhutan were at elevations ranging from 7300 to 3940ma.s.l., with >60% of the glacier area distributed at elevations of 5600-5000ma.s.l. (Fig. 4). The hypsography of -1980, 1990, 2000 and 2010 shows that the glacier area decreased at 6400-5700, 5500-5000 and 4600-4400 ma.s.l. (Table 3; Fig. 4), with the significant area decrease at 5500 and 5200ma.s.l. This indicates that glaciers with median elevations closer to their maximum elevations are losing more area (Reference Racoviteanu, Williams and BarryRacoviteanu and others, 2008). A steady decline of glacier area observed at 6400-5700ma.s.l. is mainly due to the disappearance of ice on steep slopes, which are shown in Figure 3. Similarly, at 5200–4600ma.s.l., DC glacier area remained more or less unchanged.
Between 4600 and 4400ma.s.l., the distinct change in glacier area is mainly due to formation of new glacial lakes and expansion of existing glacial lakes at the snout of DC glaciers. This shows DC glaciers in contact with a lake are receding at a faster rate than CI glaciers in the region. Moreover, Figure 3 shows glacier melt increased rapidly in the period ~1980-90, followed by a period of less melting from 1990 to 2010. In addition, no massive loss of glacier area is found in the period 2000-10. Over the 30year period, the loss of glacier area has been uniform across the region. The analysis of 32 valley glaciers shows the ELA has been shifted upward from 5170± 110ma.s.l. to 5350± 150 m a.s.l. in 30 years. The ELA was mapped at 5260 ± 100 and 5300± 110ma.s.l. in 1990 and 2000 respectively. These ELA results agree well with the ELA from a set of eight selected glaciers that lies at ~5280± 125 ma.s.l. in northwest Bhutan (Reference Meyer, Hofmann, Gemmell, Haslinger, Häusler and WangdaMeyer and others, 2009).
Discussion
The availability of archived Landsat images has made it possible to analyze decadal glacier changes from the 1980s to the present. The repeat inventory of glaciers was carried out for all four decades separately. The Landsat MSS images were used for 1977/78, TM for 1990 and 2000 and ETM+ for 2010. The MSS images are of 79 m resolution and the TM and ETM+ images are of 30 m resolution. Several MSS images with suitable conditions are available for mapping the glacier terminus (Reference VohraVohra, 2010), but the available MSS images of 1977/78 had more snow coverage than those for the TM and ETM+ images. The snow cover in Landsat MSS of 1977/78 was eliminated by comparing with topographic maps and Landsat images of 1975/76.
The 2010 glacier extent was generated using the OBIC method with some manual editing. Change detection in the remaining decades was produced by editing the base map (2010) manually by draping on respective years’ images. The delineation of glaciers via manual editing showed certain impacts on the areas of the individual glaciers and subsequently on the analyses (Reference BeedleBeedle and others, 2008). In this study, ~2% loss of glacier area was rectified while smoothing the glacier polygons. For CI glaciers and partly DC glaciers, an uncertainty of ±1 pixel and ±2 pixels respectively was assigned for the outline position (Reference Frey and PaulFrey and Paul, 2012). This study observed that loss in glacier area was high (23.3 ±0.9%) between ~1980 and 2010. Loss as high as - 3 8% was found on glaciers smaller than 1 km2 in the Himachal Himalaya from 1962 to 2004 (Reference KulkarniKulkarni and others 2007).
The increase in the number of glaciers over the decades has affirmed the shrinking and fragmentation of glaciers, which were also reported from the Indian Himalaya (Reference KulkarniKulkarni and others, 2007; Reference Basnett, Kulkarni and BolchBasnett and others, 2013) and Nepal Himalaya (Reference Bajracharya, Mool and ShresthaBajracharya and others, 2007). The presence of snow, and the resultant loss in the clarity of glacier boundaries, have contributed somewhat to the increase in glacier area, especially for -1980 to 1990. The changes in the number of glaciers were mainly found among smaller glacier size classes, which contribute a relatively small amount to the total glacier area. The glacier area loss rate is mostly influenced by glacier size (Reference Bolch, Menounos and WheateBolch and others, 2010). The long valley glaciers associated with glacial lakes have, for the most part, retreated markedly in the past few decades. Expansion of glacier lakes from glacier fluctuation has been reported from north Bhutan (Reference FujitaFujita, 2008; Reference KomoriKomori, 2008). The acceleration in glacier recession has been reflected in the Khumbu Himalaya of Nepal (Reference Bolch, Buchroithner, Pieczonka and KunertBolch and others, 2008). The DC glacier area increased in 1990 and 2000, possibly due to the melting of CI surfaces resulting in the exposure of debris area. The increased DC glacier area
The area–altitude distribution provides insight into glacier interaction within different elevation zones. Glaciers that extend to low elevations showed a distinct change in size, especially DC glaciers with lake which showed rapid ice mass melting rates, indicating the expansion and formation of lakes. Similarly glaciers near median elevation shrank noticeably, with decadal scale revealing the melting in surface area. In addition, the upward shift of ELA by 180 m during three decades also conduced to the fact of shrinking ice mass. However, glaciers at higher elevation change less significantly than those at lower elevation. The melting of the ice at steep slopes implies the current glacier condition resulted in a lessening of glacier numbers.
Glacier melting has a profound impact on water resources. The decreasing trend in glacier area will have direct impacts on ice storage and ultimately on glacier melt runoff. Temperature and precipitation are important factors that influence climatic variability, and analysis of such variables can model the potential future behavior of glaciers since >65% of the monsoon-influenced glaciers that have been observed are retreating (Reference Scherler, Bookhagen and StreckerScherler and other, 2011). Adding the conservative scenarios of glacierized area and meltwater flux has shown variation in numerous glacierized regions of the Himalaya by monsoon (Reference Rupper, Schaefer, Burgener, Koenig, Tsering and CookRupper and others, 2012). However, our study does not cover the influence of climatic factors; instead it provides significant investigations of glacier change scenarios on a decadal scale, which acts as a baseline for observing and monitoring future glacier health and its dynamics.
Conclusion
We have provided a comprehensive picture of the status of glaciers and its decadal change (-1980 to 2010) in the Bhutan Himalaya, based on multitemporal Landsat images and a SRTM DEM. A semi-automatic object-based classification was used to generate glacier outlines for 2010. The repeat glacier outlines were made for 2000, 1990 and -1980 based on manual editing on the baseline glacier of 2010. Analysis of the four-decade glacier data shows rapid shrinkage in recent decades, with the highest decrease in smaller glaciers. The major findings of the study include:
-
1. Archiving of repeat decadal glacier inventory of Bhutan from - 1980 to 2010 based on Landsat images;
-
2. The glacier area loss in Bhutan from -1980 to 2010 was 23.3 ±0.9%, with a trend of-6.39 ± 1.6% (10 a)–1;
-
3. The shrinking and fragmentation of glaciers from -1980 to 2010 resulted in an increase in the number of glaciers by 14.8%;
-
4. The rate of reduction of glacier area in different elevation zones varies: glaciers at elevations of 5500-5200 m a.s.l. are receding faster, except where the glacier ice is covered by debris;
-
5. The ELA has shifted from 5170± 110ma.s.l. to 5350± 150 m a.s.l. in the years -1980 to 2010.
-
6. The retreat rate of DC glaciers with a glacial lake at the snout is higher than that of DC glaciers without a lake, the best example being in the Lunana region.
Glacier area in the Bhutan Himalaya is rapidly changing. The Landsat data provide an ideal tool to understand the status of and changes on glaciers, at least for the last 30 years.
The glacier data of Bhutan will be uploaded in the ICIMOD mountain geo-portal (http://geoportal.icimod.org) and will later be ingested into the GLIMS and Randolph Glacier Inventory websites.
Acknowledgements
We are grateful to Basanta Shrestha, Division Head of MENRIS (Mountain Environment and Natural Resources Information Systems, Kathmandu), for his constant guidance, inspiration and support. The study was supported by HIMALA and SERVIR Himalaya of NASA and the United States Agency for International Development (USAID). Landsat data are courtesy of NASA and the USGS. The SRTM elevation model version is courtesy of NASA’s Jet Propulsion Laboratory and was further processed by the Consultative Group for International Agriculture Research (CGIAR). The glacier database was generated with the support of the Cryosphere Monitoring Project of the Swedish International Development Cooperation Agency and the Norwegian Ministry of Foreign Affairs.



