The Anglo-French Treaty of Commerce of 1860 and the more than 50 bilateral preferential trade agreements that followed it are widely credited with having brought “free trade” to the European continent. The initial treaty takes its name from those of British negotiator and statesman Richard Cobden, who is even more famous as a leader of the British Anti-Corn Law movement, and the French free-trade economist and politician Michel Chevalier.Footnote 1 The entire network that evolved after 1860 has been identified with the free trade doctrine. Under denominations such as “European free trade era” and “the First Common Market,” it attracted the attention of scholars not only in economic history, but also in international economics and international relations.Footnote 2
Until very recently, little systematic investigation has been pursued as to whether the network of bilateral treaties achieved its central aim: raising international trade flows. Inspired by the doubts that Andrew K. Rose raised about the trade-enhancing effects of the GATT-WTO liberalizations, Olivier Accominotti and Marc Flandreau used gravity models to assess the Cobden-Chevalier network. They conclude that the network “did not give any boost to international trade whose expansion actually started losing momentum after 1860,” and that bilateralism was as ineffective in promoting trade as multilateralism is in the present day, according to most of Rose's empirical results.Footnote 3 Taking these results together, the use of commercial diplomacy for liberalizing world trade seems highly questionable.
However, it is doubtful whether commercial diplomacy even aims at liberalizing world trade. As far as the Cobden-Chevalier network is concerned, despite all the propaganda for free trade and world peace by Cobden and the Cobdenites, it is wrong to identify all the bilateral treaties with the free trade doctrine.Footnote 4 Indeed, if one reads the treaties beyond the preambles and examines the actual stipulations, it becomes evident that liberalizing overall trade can hardly be seen as their foremost goal. Preferences were negotiated item by item, and the result was far from linear across all commodities. Tariff cuts and remaining tariffs reflected negotiating parties' preferences, and as such were more frequent and more pronounced for manufactures and high-tariff “luxury goods” than for raw materials. As a consequence, investigating the treaties' impact on total trade is not entirely appropriate. I therefore use a new disaggregated data set to estimate gravity models at the commodity-group level. The results show that although the network had a positive effect on many commodity groups, the sum of these effects was too small to be significant in the aggregate. One clear consequence was that trade in manufactures and luxury goods rose. Exporters from countries whose diplomats carefully negotiated tariff reductions tailored to domestic export interests reaped notably higher benefits. Apparently, commercial diplomacy did make a difference, albeit not necessarily in promoting universal free trade.
COMMERCIAL POLICY AND THE DEVELOPMENT OF FOREIGN TRADE AFTER 1860
Since the end of the Napoleonic Wars, and especially in the 1840s and 1850s, Great Britain and the economies of continental Europe underwent a process of increasing internal and external physical market integration.Footnote 5 Advances in transport and communication technology had reduced natural barriers to trade, while the suppression of internal tariffs, most prominently in Germany, reduced institutional barriers to trade.Footnote 6 Industrialization, economic growth, and internal integration caused national producers to become more and more dependent on foreign supplies of raw materials and—in the most advanced sectors of the economy—on foreign markets to sell their commodities. At the same time, markets for many commodities grew more integrated in the 1840s and especially in the 1850s as transportation and communication improved and tariffs were reduced. As a result, at the end of the 1850s tariff levels were generally low for foodstuffs and raw materials for industrial production; while in most continental European countries, tariffs on manufactured products such as iron, steel, and textiles remained high to protect national industries from inflows of cheap British products.Footnote 7 The United Kingdom itself constituted an exception, as tariffs had been brought down for almost all goods except “luxury articles” such as tobacco, coffee, wines, spirits, fancy goods (silk wares, etc.), and sugar, whose duties made up an important share of total public revenue.
To get an internationally comparable picture of the distribution of tariff rates across countries and commodities, Table 1 displays ad valorem tariff equivalents for major noncolonial commodity groups in international trade in 1859, just prior to the conclusion of the Cobden-Chevalier Treaty. I employ a new data set that provides information on trade flows, tariff rates, and commercial treaties stipulations for the United Kingdom, the United States, France,
AD VALOREM EQUIVALENTS OF TARIFF RATES FOR MAJOR COMMODITY GROUPS IN 1859 (percent)

Notes:
The overall average tariff is the ratio of duties recollected to total imports for home consumption. Export weighted average tariff equals commodity-group tariff rates weighted by an unweighted average of every country's average export shares for each commodity group in 1865. Imports for home consumption for the U.K. and the U.S. equal imports minus re-exports. “Silk wares” include fine textiles made from other fibers. Tariff rates for spirits and liqueurs were corrected for domestic excises and production taxes which were included in the official customs duties of some countries, but not of others, and are now “tariff only.” Rates of the United States exclude imports of raw material that entered free of duty from Canada and other British Provinces in North America under the Elgin-Marcy Treaty (in force 1854-1866); taking into account these duty-free imports, ad valorem equivalent average tariffs decrease to 0.1 percent for wheat, 0.0 percent for rye, 0.2 percent for milling products, 6.6 percent for hides, skins, and leather, 0.0 percent for wood, and 1.1 percent for wool.
Source:
Lampe, “Bilateral Trade Flows,” table 13.
Belgium, the Netherlands, Austria-Hungary, and the German Zollverein from 1857 to 1875 in 21 internationally comparable commodity groups.Footnote 8 As the period under study predates even the beginning of the unification of tariff and statistical classifications by four decades, and national classifications were elaborated according to national industry and protection structures along with prevailing political beliefs, this partial classification was constructed from national trade statistics of the aforementioned countries in the following way: I first determined the 50 items with the highest import and export values for every country in 1865. After exclusion of articles that were important in one country only or which did not fit the research design, a partial classification of 21 internationally comparable commodity groups was established that forms the basis of the rest of the article. It should be noted that the data set explicitly excludes colonial and tropical commodities (cotton, tobacco, guano, indigo, or cane sugar), which were not produced in large quantities in Europe. It also excludes minerals like copper, zinc, or tin, whose exportability depended on the availability of deposits.
Table 1 shows that while average tariffs were already fairly low in most of Europe at the end of the 1850s, actual rates varied considerably across countries and industries, reflecting national industry structures and government preferences in protection and revenue generation. While tariffs on wheat ranged from 0 to 2.5 percent, especially textiles, and iron and steel products were taxed very unevenly, with duties ranging from 0 percent in Britain to levels well beyond 20 percent in France, the Zollverein, and Belgium.
Peter T. Marsh highlighted this unequal distribution of tariffs, prior to 1860, as the watershed for the spread of the commercial negotiations,Footnote 9 alongside the variety of political developments and diplomatic events in the “concert of powers” in Europe.Footnote 10 Marsh stresses the importance of exporters as lobbies for tariff reductions in their export destinations, especially the woolens and worsteds manufacturers of the West Riding of Yorkshire on the British side. For French negotiators, the high British tariffs on wines and spirits were the central target, and vintners of the Gironde as well as producers of fine silken articles were the main interest groups favorable to a treaty that otherwise was harshly opposed by French manufacturers.Footnote 11 In response to their lobbying, the Cobden-Chevalier Treaty led to a reduction of British duties on lighter wines by about 80 percent and the abolition of remaining British duties on articles of silk and different sorts of woolens such as laces, shawls, and coverlids. France abolished import prohibitions for British manufactures, and French duties for British semi-manufactures were brought down to levels of around 10 percent, while manufactures would pay ad valorem equivalents of about 15 percent. Both parties thus achieved tailor-made liberalizations for their exports that would not have been implemented unilaterally by the other party. The results of the Cobden-Chevalier Treaty came closer to “moderate protection” than to “free trade,” as substantial duties remained.Footnote 12
Marsh also establishes why the subsequent development had to occur via France and why specific interests mattered for the treaty network's expansion at least as much as they had in the negotiations of the original treaty. Because it unilaterally generalized the “concessions” of the treaty of 1860, the United Kingdom had few potentially attractive preferences left for further negotiations. Official British diplomacy stuck to the free trade doctrine.Footnote 13 In the terminology of Jagdish Bhagwati, it argued for full reciprocity (absolutely identical market access aiming at nondiscriminatory free trade), while continental parties acted on the assumption of first-difference reciprocity (equal concessions made departing from differing initial conditions).Footnote 14 Thus it was that Great Britain, in further treaties, obtained mainly pure most-favored-nation (MFN) agreements, while France, by refusing to extend its liberalizations unilaterally to other trade partners, retained substantial bargaining power for subsequent negotiations. For example, Belgium and Prussia wanted to achieve similar conditions and additional liberalizations tailored to their own export industries. The resulting Franco-Belgian and the Franco-Prussian treaties thus stipulated further preferential tariff reductions, which led to increasing discrimination faced by outsiders to this emerging network. This discrimination created incentives for further negotiations and the expansion of the network, which led to the spread of the network and progressive trade liberalization.Footnote 15 The result was that by the early 1870s, a dense network of more than 50 bilateral treaties had formed in Europe which lowered average tariffs to a degree unmatched in international trade until the 1980s.
All treaties stipulated the repeal of import and export prohibitions; freedom of transit; measures fostering the freedom of transnational commerce; and mutual concession of unconditional MFN status. Because the unconditional MFN clause automatically transmitted preferential stipulations, the resulting network of bilateral treaties possessed a multilateral quality. Not all treaties included specific liberalizations; an increasing proportion of the agreements concluded in the late 1860s and 1870s convened pure mutual MFN status only. Still, these later treaties constituted an important prerequisite for the network as a stable system, as they linked together stipulations of preceding treaties.Footnote 16 As an institution, the Cobden-Chevalier network might be looked upon as similar to modern-day free trade areas, but with residual elements of internal discrimination.
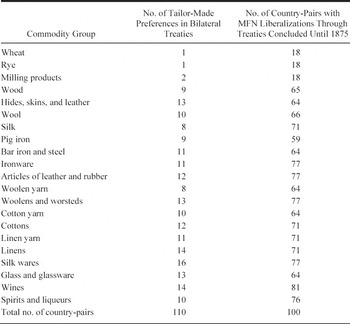
Table 2 gives a picture of the distribution of preferences and liberalizations across commodity groups in the treaties. It is derived from 55 bilateral MFN treaties ratified by European countries up to 1875. Of these agreements, 22 contained tailor-made preferences, while 33 convened MFN status only.Footnote 17 Here tailor-made preferences are defined as explicit, new tariff reductions convened between the actual parties of a bilateral treaty, while the term MFN liberalizations refers to the sum of tailor-made preferences and liberalizations transmitted via MFN from former treaties or obtained ex post by transmission of further liberalizations from partners' subsequent negotiations with other parts.
The table shows that the main focus of the bilateral treaties was on reducing tariffs on manufactured articles, such as textiles (cloths rather than yarns), ironware, articles of leather and rubber, and especially on wines and stronger alcoholic beverages. Negotiators certainly were not overly interested in cereals and milling products, which were some of the most important articles in contemporary international trade and figure most prominently in modern investigations into nineteenth-century commodity market integration.Footnote 18 Of course, a glance at Table 1 reveals little to negotiate over for these commodities. That suggests that we should be cautious in interpreting overall effects, since a large segment of international trade was virtually excluded or at least underrepresented in the treaties.
FREQUENCIES OF PREFERENTIAL AND MFN LIBERALIZATIONS ACCORDING TO COMMODITY GROUPS IN COMMERCIAL TREATIES WITH UNCONDITIONAL MFN CLAUSES, 1855-1875

Note:
Totals in both columns differ because five country-pairs signed two treaties in the observation period.
Source:
Based on treaty texts in Parry, Consolidated Treaty Series, vols. 120-150.
Table 3 shows the outcome of commercial policy in the 1860s and early 1870s, as reflected in the state of tariffs in 1875. In comparison with Table 1, it can be summarized as follows: While tariffs on many items were substantially reduced, others remained almost unaltered. British wine and spirits tariffs were reduced to less than one-third of their 1859 amount, as were French tariffs on many items; the Zollverein's tariffs on cottons, iron, and steel of all kinds; Belgian tariffs on woolen yarn; Austria-Hungary's tariffs on grains, yarns, and cloth; and, unilaterally, Dutch tariffs on yarns of all kinds. Raw materials remained mainly unaffected with a few exceptions—for example, British duties on timber were suppressed as a result of the prolonged
AD VALOREM EQUIVALENTS OF TARIFF RATES FOR MAJOR COMMODITY GROUPS IN 1875 (percent)

Notes:
Refer to Table 1. Rates for the United States in 1875 include all imports, as the Elgin-Marcy Treaty was no longer in force.
Source:
Lampe, “Bilateral Trade Flows,” table 13.
Anglo-Austrian negotiations.Footnote 19Table 3 confirms that liberalization was distributed unevenly across commodities and countries, and also illustrates the general progress in liberalizing foreign trade: Average tariff levels for manufactured goods in continental Europe dropped markedly, while they increased to unprecedented levels in the post-Civil War United States.Footnote 20
However, only actual trade flows can reveal whether foreign trade increased effectively. Contemporary accounts relied mainly on the comparison of ex ante and ex post trade volumes. As an example, British expert opinion on the effects of the Cobden-Chevalier Treaty stated, in The Economist in early 1869, that British imports from France had at least doubled in the first eight years after its ratification, while exports and re-exports to France had increased even more.Footnote 21 The writer explained that these increases could not be sufficiently attributed to augmented general prosperity, and that
“[t]he significance of the augmentation should appear yet more in details. The special advantage of the treaty was intended to be the multiplication of exchanges in the articles which only one country produced, or in producing which it had an advance. […] Thus the value of our import of wine has nearly trebled in the eight years, while the quantity we take is from four to six times higher than it was. The progression in this article is consequently far above the general progress of our imports from France, which is so far a sign that the general augmentation is due to the augmentation in articles encouraged by the treaty.”Footnote 22
The same article goes on to demonstrate that imports of silk wares from France rose even more than imports of French wine. British exports to France in coal and textiles, most notably woolens and worsteds, had also grown well above average. Leone Levi confirmed these observations for later years, and gave additional figures regarding the exports of Austria-Hungary, Belgium, France, the Netherlands, Italy, and the United Kingdom.Footnote 23 Since then, similar figures and arguments have been published and cited by contemporaries and historians alike.Footnote 24
Recently, Accominotti and Flandreau took a more systematic approach and estimated various versions of the gravity model for bilateral trade totals between 1850 and 1880. The result is a consistent lack of statistically significant effects of the bilateral agreements on overall trade flows between their parties. They conclude that bilateralism is “pointless,” if effective trade liberalization is the goal.Footnote 25
As we have seen, however the treaties did not pursue overall trade liberalization, but rather reductions in duties on specific commodities. They were intended to create economic possibilities for certain domestic exporters. International trade was hardly mentioned. Therefore, to examine the effects of the treaties in an appropriate manner, we have to focus on trade flows in specific commodity groups, specifically those which figured prominently in the exports of countries in Western and Central Europe, whose governments created the treaty network.
COMMERCIAL TREATIES AND BILATERAL TRADE, 1857-1875: DATA AND METHODS
To assess the incidence of specific preferences and liberalizations, I gathered bilateral trade data from contemporary trade statistics for each of the commodity groups presented in the previous section. Because only a few countries published systematic and reliable disaggregated statistics, the sample had to be limited to seven key countries in the world trade of our period: the United Kingdom, the United States, France, Belgium, the Netherlands, Austria-Hungary, and the German Zollverein/Kaiserreich. Among these countries were also the core countries of the Cobden-Chevalier network. The data set contains import values for all of them at ten points in time, namely, every second year between 1857 and 1875. The core sample contains the 42 country-pairs constituted by these seven countries. An extended version, which is used for robustness checks of the results, also includes imports of these countries from Switzerland, Italy, Spain, Portugal, Denmark, Sweden-Norway, and Russia.Footnote 26
The data set is presented and examined in detail in a separate study.Footnote 27 Its salient features include: First, the use of disaggregated data that enabled dealing comprehensively with inadequate official prices and lack of valuation. These were most notorious in the Zollverein's foreign trade statistics, which provided physical quantities only, and in Dutch statistics, in which unaltered benchmark prices established in 1846 were used for many items until 1914. In these instances, values were calculated and corrected using corresponding prices from reliable sources, in this case, the foreign trade tables published for the port of Hamburg, the United Kingdom, and France. Second, the data set prepared for this study is the first that comprehensively accounts for incorrect assignment of partner countries. This problem results from trade in transit and via entrepôts that generally was not recorded for the country it was originally shipped from, but rather the country whence it physically entered (that is, the country of last land border crossed and the last port visited by an incoming ship).Footnote 28 As trade in transit represented more than 25 percent of all trade flows of the countries in the sample, uncorrected bilateral data can be seriously distorted. I performed a comprehensive correction using partner countries' transit statistics to separate actual domestic bilateral exports of immediate partners from transit that just passed through the country from where it physically arrived at its final destination. Furthermore, in view of measuring retained imports for home consumption only, I removed disguised transit and entrepôt trade volumes, that is, trade reported for merchandise that was imported with the sole purpose of being re-exported.Footnote 29
To analyze the relation between trade agreements and trade flows between the participating countries in a systematic way, I employed the standard method in this field, the gravity model. For aggregate trade flows, it is used in its basic specification, and thus results are comparable to those obtained by Accominotti and Flandreau, and Rose.Footnote 30 The gravity model relates bilateral imports by country i from trade partner j in period t (IMijt) to the national incomes of importer (Yi) and exporter (Yj), and the economic distance that separates them. Economic distance is proxied by geographic distance (Dij) in kilometers. Per capita incomes (Yi/Popi) of importers and exporters are included to model demand behavior.Footnote 31 The specification for aggregate trade is

Dummies for common borders, common language, the American Civil War (1860-1865), and wars on the European continent are included in a vector of additional control variables, Σβm Σln(Zijm)t.Footnote 32 Because common borders and common languages are expected to facilitate trade and communication, these variables serve to refine the measure of economic distance. Similarly, wars are expected to disrupt trade flows.Footnote 33 The estimated model also includes a time-invariant dummy variable for each country as an importer and time-specific dummy variables for each period.Footnote 34
The specification of the gravity model is modified for the disaggregated specification, because some of the explanatory variables employed at the aggregate level do not necessarily explain trade in individual commodity groups, due to differing national production structures. In the commodity-level estimates, elements of bilateral import functions and the original gravity approach are combined in the following way: Importers' national income (Yi) is maintained as a right-hand side variable, as it is the best available demand measure in our period.Footnote 35 In contrast, exporters' national income is dropped, because the assumption of uniform production and export structures across commodity groups for all countries is implausible. To account for internationally differing production capacities in each commodity group, proxies for comparative advantage and specific factor endowments would be proper measures, but unfortunately they are not available for the period under study to a satisfactory extent. Hence, they were proxied by time-invariant exporter dummies, assuming that the international distribution of production did not change substantially.
Distance (Dij) as a proxy for bilateral transport costs is maintained in the disaggregated specification, as are the dummies for common language, borders, wars, and importer- and period-specific fixed effects contained in Σβm Σln(Zijm)t. Thus, the commodity-specific equation is

To assess the effects of the treaties, three kinds of dummy variables have been coded from the treaty texts: (a) a variable called Cobden that captures the presence of a treaty in general (the variable used by Accominotti and Flandreau); (b) a variable called MFN that codes all commodity-specific liberalizations granted or transmitted under the MFN clause; and (c) tailor-made preferences (Tailor), that is, new preferences that reduced the lowest tariff level established in former treaties. Statistically significant and positive coefficients for these variables will be interpreted as a systematically positive impact of the corresponding bilateral agreements on their parties' bilateral trade flows. Tailor-made preferences were only coded for the first bilateral treaty that contained them; if they were granted by the same country in later treaties, these repetitions were coded as MFN only. Tailor-made preferences, in general, must have directly benefitted the export industries of the partner country concerned, although their transmission through the MFN clause may have produced rather indiscriminate effects.Footnote 36 Nevertheless, because tailor-made preferences in many cases were very specific, their impact on trade in the respective category might not even show up at the level of their disaggregated commodity group.Footnote 37
In the specification for aggregate trade, the treaties can only be introduced through the dummy variable Cobden. By contrast, at the commodity-group level we can differentiate between the effects of Cobden MFN, and Tailor by including them into separate estimates of equation 2. As the previous section has shown that specific liberalizations were central to the network, I expect to find a clearer picture for Tailor and MFN than for Cobden, because Cobden is only a very rough proxy at the disaggregated level. It is coded as “1” for all commodity groups, if a bilateral treaty exists, although not all commodity groups were necessarily covered by that treaty.
Technically, I estimate equation 2 individually for each of the 21 commodity groups with ordinary least squares (OLS) and Poisson pseudo-maximum likelihood (PPML) alternatively.Footnote 38 The commodity group-specific estimates are then converted into a system of seemingly unrelated regressions to correct for cross-equation error correlations due to identical conditions in the time dimension.Footnote 39
All estimates were made using unidirectional trade flows (imports) and data in nominal current prices converted to pounds sterling at annual average nominal exchange rates.Footnote 40 National incomes in current prices were obtained and extrapolated from different sources reported in the longer working paper version of this article.Footnote 41
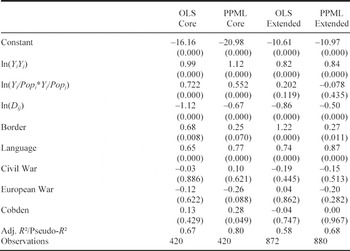
ESTIMATE OF EQUATION 1: MFN TREATIES AND AGGREGATE BILATERAL TRADE (sum of commodity groups)

Notes:
Dependent variable: ln(IMijt) for OLS; IMijt for PPML. The p-values are reported in parentheses. “Core” refers to core sample, and “Extended” to extended sample; see the text for details. Coefficients for importer and period fixed effects not reported. All estimates with robust standard errors (for clustering by country-pairs).
Source:
See the text.
RESULTS
Table 4 shows the results for the estimation of equation 1 for aggregate bilateral trade, that is, the sum of trade in all commodity groups. They are in line with theoretical expectations for gravity model estimates and replicate the results of Accominotti and Flandreau:Footnote 42 Larger common market size corresponds to higher trade volumes and higher distance goes along with less trade. The coefficients for common language are also always positive and significant, while the border coefficient is positive in all specifications, but not always significant at the 5 percent level. The coefficient for income per capita is significantly positive for the core sample, but insignificant for the extended sample. Wars seem to have had an overall negligible impact on trade flows.Footnote 43 Most important, the coefficient of the Cobden variable is slightly positive, but statistically insignificant.Footnote 44
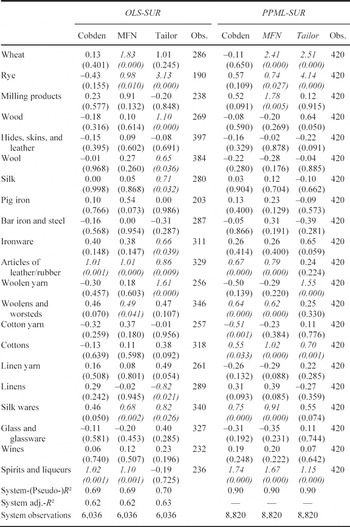
Our main focus, however, is on the disaggregated level, because liberalizations were commodity-specific. Table 5 reports the key results of the system of commodity group-specific estimates of equation 2 for the core sample. As the full results involve a large number of parameters (21 equations with 43 variables each), only the commodity-specific coefficients for the treaty dummies are displayed. The first column contains the estimates for Cobden, the second for MFN liberalizations, and the third for tailor-made preferences. To make the disaggregate estimates comparable to the aggregate level, I computed Wald tests for the equality of coefficients underlying Table 5, constraining the key coefficients to be equal for all commodity groups. Hence, they represent average coefficients for the corresponding variables. Table 6 reports these cross-equation average coefficients. They have the expected signs and are significantly different from zero in most cases. The coefficient for Cobden is in the same range as in Table 4, but now significantly positive for the favored PPML-SUR estimate. In addition, we now see that commodity-specific preferences had a noticeable] impact on trade flows: The constrained coefficients for MFN and Tailor are statistically significant and positive. Furthermore, in the disaggregated estimations, the average effect of wars both in the United States and in Europe is now estimated as significantly negative by PPML. That confirms that the disaggregated estimates do not only contain more information, but also allow more precise point estimates. The Pseudo-R 2 is 0.90 for the system, ranging from 0.81 (for silk) to 0.97 (for linens and wine) in the commodity-group equations.
Nevertheless, the p-values from corresponding Wald test χ2-statistics for equality of coefficients in Table 6 make clear that the constrained coefficients themselves do not represent identical coefficients across equations. Therefore, the results for commodity-specific equations should be looked at. For the demand variable Yi, a positive coefficient that is statistically significant at the 5 percent level could be estimated in only ten of the 21 equations (for four other equations, the coefficients are positive, but not significant at the 5 percent level). That might result from the inclusion of importer-specific effects which model country-specific import frictions and interfere with Yi as a measure of domestic demand
TREATY DUMMY COEFFICIENTS FROM ESTIMATES OF EQUATION 2 FOR EACH COMMODITY GROUP (core sample)

Notes:
Dependent variable: ln(IMijt) for OLS-SUR and IMijt for PPML-SUR; observations < £1,000 omitted for OLS. The p-values are reported in parentheses; significant coefficients for a confidence interval of 5 percent are italicized. System-R 2 for OLS was calculated as documented in the source code by Henningsen and Hamann, “systemfit,” as  , where 1-21 are the commodity group equations, RSS are the residual sums of squares, and
 are the total sums of squares. Adjusted System-OLS-R 2 thus was calculated accordingly using total system observations and total number of coefficients in the system. System-Pseudo-R 2 for PPML was analogously calculated as
 where ll is the log-likelihood of each estimation and ll0 the log-likelihood of the corresponding constant-only model; as the Pseudo-R 2 is not sensitive to the number of regressors, no adjusted version is needed; see Cameron and Trivedi, Regression Analysis, pp. 153-55.
Source:
See the text.
structures. Distance seems to have had a more uniform impact: Its estimated coefficient is significantly negative in 19 equations and insignificantly negative in one other.Footnote 45
Examining the commodity-specific coefficients for the treaty dummies in Table 5, we find first of all that the Cobden dummy (which simply models the conclusion of a commercial treaty) only has a significant positive effect on trade when specific liberalizations as modeled by MFN and Tailor had also had significantly positive effects. As these commodity groups also rank among those with the highest frequencies of commodity-specific stipulations (Table 2), we might safely conclude that these “treaty effects” were—unsurprisingly—driven by underlying specific liberalizations, and that the results for MFN and Tailor are what really matters.
We see that MFN and Tailor had significantly positive effects mainly in manufactures that were subject to high duties before 1859: articles of leather and rubber (for example, gloves, purses, saddlery), textiles of wool, cotton, and silk, and spirits. There are also significantly positive results for grains, meals, and flours, but these should not be overinterpreted, as they refer to a relatively small number of country-pairs only, in which either Germany or Austria-Hungary was always the importer (their mutual preferences on grains should be predominant here).Footnote 46 The differences of OLS and PPML estimates are small, which can be taken as an additional indication of
AVERAGE COEFFICIENTS FOR KEY VARIABLES FROM INDIVIDUAL COMMODITY-GROUP ESTIMATES OF EQUATION 2

robustness of the results. The question whether tailor-made preferences or their transmission and the expansion of the network via MFN drove the results cannot be conclusively answered from Table 5. Only for woolen and worsted yarns do we find positive effects for Tailor, but not for MFN, while for three groups of manufactured goods we find the contrary. This indicates that tailor-made preferences might be inadequately captured by the dummies, and further research using more refined measures is recommended. Notwithstanding this, Tables 5 and 6 give firm evidence that the treaties helped to increase trade flows significantly for many commodities, mostly manufactures, while trade with most raw materials, especially the inputs to the respective branches (hides, skins, and leather; wool, silk), experienced no significant benefits.
Given the positive commodity-specific effects, one might ask why they did not lead to consistently positive effects at the aggregate level, and how can the effects be quantified in comparison with aggregate trade in the data set and aggregate trade covered by treaties. To do this, I estimated a system of equation 2 for the core sample with PPML-SUR as described above, but with simultaneously included period-specific treaty effects as measured by MFN, that is, MFN*D1861, MFN*D1863, and so on.Footnote 47 If the coefficient for these dummies (βMFN*1861, βMFN*1863, etc.) was significant at the 5 percent level for a commodity group k, it was converted into percent increases in trade attributable to preferential liberalizations, which then were multiplied with actual bilateral imports for country-pairs wherein an MFN preference was in force in the corresponding commodity group. These products have been summed up across commodity groups. The evolving term is called “trade increase due to MFN preferences” (TIMFN) and formally calculated as

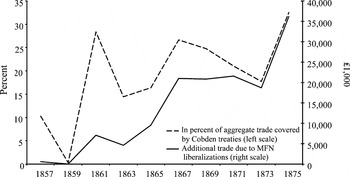
Figure 1 presents the evolution of TIMFN in absolute values and in percent of aggregate bilateral imports between the countries in the core sample that had a Cobden treaty in force in the corresponding year.Footnote 48
We see that significant commodity-specific treaty effects in none of the years sum to more than 32.5 percent of aggregate trade between countries with a bilateral treaty in force. The average was 22.7 percent between 1861 and 1875. The first local maximum, attributable to a onetime effect of the Cobden-Chevalier Treaty in 1861 (28.4 percent), is only reached again at the end of the observation period.Footnote 49 Even the 32.5 percent, in 1875, would hardly have led to a significant coefficient for Cobden in the aggregate estimates underlying Table 4.Footnote 50 This confirms the expectation that the treaties hardly produced uniform overall impacts.
SUM OF ADDITIONAL TRADE ATTRIBUTABLE TO SIGNIFICANT COMMODITY-SPECIFIC EFFECTS IN ABSOLUTE VALUE AND IN PERCENT OF AGGREGATE TRADE COVERED BY COBDEN TREATIES IN EACH YEAR

So far, the results confirm our expectation that commodity-specific effects mattered. Negotiators sought to help their domestic exporters of specific goods, especially manufactures and heavily tariffed alcoholic beverages. A central question is therefore how successful were each country's commercial diplomats in effectively helping to boost domestic exports. The straightforward way to investigate this is to include national exporter-specific effects of MFN liberalizations into the system of equation 2, that is, interaction effects of every country's exporter dummy with MFN (for example, FRAEX*MFN, ZVEX*MFN), in the same may as was done above with year-specific interaction terms. The coefficients obtained from these estimates for every country's exporters in each commodity group are presented in Table 7.
The constrained “average” coefficients in the lower part of that table suggest that France, the Zollverein, Belgium, and Austria-Hungary benefitted significantly from the treaty network, while the average effect is positive, but insignificant for the United Kingdom, and significantly negative for the Netherlands. Again, the p-values from
COEFFICIENTS FOR MFN-EXPORTER INTERACTION TERMS

Note:
Results are for PPML-SUR estimates, see the notes to Table 5 and the text.
Source:
See the text.
Wald test χ2-statistics indicate that the coefficients were not identical across commodity groups. If we look at these coefficients in the upper part of Table 7, we find significantly positive coefficients mainly for manufactured articles: The United Kingdom benefitted significantly in all categories of cloth and in articles of leather and rubber, as did France, with the exception of linens. Additionally, in France as in almost all other countries, exports of spirits and liqueurs rose significantly. German and Austrian exporters benefitted in a variety of industries, while Belgian benefits were concentrated in iron and steel products. For the Netherlands, only the linens coefficient is significantly positive at the 5 percent level for manufactures.
The first three rows of the table indicate numerous positive effects of the treaty network on trade with wheat, rye, and meals and flours. These coefficients, of which some show extremely high values, might at first glance indicate that the real beneficiary of the Cobden-Chevalier network was agriculture. Still, these high and positive coefficients actually belong to few preferences and small export volumes in most cases. I suspect that the interaction terms here take up certain idiosyncrasies that could not be controlled for. Additionally, we find some negative coefficients. Most of them indicate sectoral or international specialization, and thus a deepening of the industrial division of labor in Europe: Negative coefficients for woolen and linen yarn in the United Kingdom (and in the Netherlands for linen yarn) are accompanied by significantly positive effects for the corresponding final manufactured product, cloth. Nevertheless, some negative coefficients can be made sense of only by looking at industry-level national developments, which is clearly beyond the scope of this article.
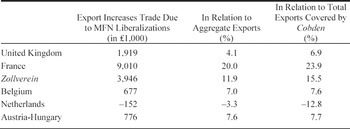
To assess the quantitative amount of benefits for each country's exporters, the commodity-group coefficients of Table 7 have been converted into “export increases due to MFN liberalizations by partner countries,” as was done above for year-wise estimates, using partner import data for 1875.Footnote 51 Their values (Table 8) show that French exporters benefitted most, followed by the Zollverein, Austria-Hungary, and Belgium. The export increases for the United Kingdom and Belgium are the smallest in relative terms, and even negative for the Netherlands. From these results, we can conclude that the network brought the greatest benefits to countries whose negotiators primarily
SUM OF COMMODITY-SPECIFIC INCREASES IN EXPORTS ATTRIBUTABLE TO MFN LIBERALIZATIONS, BY COUNTRY

Note:
Figures are based on estimates using PPML-SUR.
Source:
See the text.
aimed at strategically using the treaties to bring down partner tariffs.Footnote 52 By contrast, “unilateralists” from Britain and the Netherlands who unilaterally extended their preferential liberalizations to all countries in accordance with the free trade doctrine, did not profit systematically in terms of additional exports. Their refusal to discriminate between treaty partners and other countries reduced their bargaining power, and hence their opportunities for becoming active leaders in the design of the expanding network.
Belgium presents a special case because its government used the treaties mainly to bargain for the participation of contract partners in the capitalization of the Scheldt toll, which, until 1863, was levied by the Dutch government for ships heading into Antwerp, Belgium's major commercial port.Footnote 53
CONCLUSION
This study establishes a new and nuanced picture of the Cobden-Chevalier Network. A close inspection of the individual bilateral treaties and contemporary accounts reveals that the negotiating commercial diplomats did not simply mow equally across all tariff lines. Rather, they should be viewed as skillful gardeners, who aimed to trim specific tariffs in their partners' tariff regimes, especially those that affected domestic exporters of manufactures and of luxury goods, such as alcoholic beverages. It is true, as previous research has shown, that the treaties did not boost the total trade in Europe, but that does not mean the treaties were ineffective, particularly if the diplomats' goals are taken into account. The treaties did in fact enhance trade, but not for all commodities. Their effects were most notable in final products, especially textiles. The treaties therefore did contribute to the deepening and diversification of intra-European trade.
Exporters from those countries whose governments were driving forces in the formation of the treaty network reaped the highest benefits. In form and effect, nineteenth-century bilateralism was ideologically closer to first-difference reciprocity than to the free trade doctrine. Hence, it is an irony of history that it has become identified with the names of Cobden and Chevalier. Instead, French Minister Eugène Rouher or Prussian Commercial Councilor Rudolf von Dellbrück, moderate free-traders with a realpolitik background, would be more aptly named as its patrons.