


Introduction
Cowpea, Vigna unguiculata (L.) Walp., is a self-pollinated and diploid (2n = 22) legume crop with a genome size of 613 Mb (Lonardi et al. Reference Lonardi, Muñoz-Amatriaín, Liang, Shu, Wanamaker, Lo, Tanskanen, Schulman, Zhu, Luo, Alhakami, Ounit, Hasan, Verdier, Roberts, Santos, Ndeve, Doležel, Vrána, Hokin, Farmer, Cannon and Close2019). It is one of the most widely consumed food legumes in sub-Saharan Africa. Cowpea grains are rich in protein, folic acid, carbohydrates and minerals, thus contributing to the food and nutritional security of rural populations (Boukar et al. Reference Boukar, Fatokun, Huynh, Roberts and Close2016). Cowpea haulm and husk are excellent feed resources (Kiema et al. Reference Kiema, Sawadogo, Ouedraogo and Nianogo2012). Cowpea also serves as a source of income for smallholder farmers (Abdourahamane et al. Reference Abdourahamane, Baoua, Rabe, Saidou, Amadou and Tamo2020) and an excellent soil nitrogen fixer through symbiotic nitrogen fixation by root-associated bacteria (Aboubacar et al. Reference Aboubacar, Ousmane, Amadou, Issaka and Zouberou2013).
Early genetic diversity studies in cowpea relied on morphological traits (Kouakou et al. Reference Kouakou, Roy-Macauley, Gueye, Otto, Rami and Cissé2007; Gbaguidi et al. Reference Gbaguidi, Dansi, Loko, Dansi and Sanni2013) and PCR-based markers such as Random Amplified Polymorphic DNA (RAPD) and Simple Sequence Reapeat (SSR) (Li et al. Reference Li, Fatokun, Ubi, Singh and Scoles2001; Sarr et al. Reference Sarr, Bodian, Gbedevi, Ndoye Ndir, Oyatomi, Gueye, Foncéka, Diop, Diop Baye, Cissé and Diouf2021), but the expression of morphological markers can vary across environments, and SSR coverage of the genome remains limited. Single nucleotide polymorphism (SNP) markers have since become the preferred tool for population genomics, owing to their wide genomic distribution, high reproducibility and chromosome-specific location (Kujur et al. Reference Kujur, Bajaj, Upadhyaya, Das, Ranjan, Shree, Saxena, Badoni, Kumar, Tripathi, Gowda, Sharma, Sube, Tyagi and Parida2015; Tatarinova et al. Reference Tatarinova, Chekalin, Nikolsky, Bruskin, Chebotarov, McNally and Alexandrov2016); they have been used to establish a genetic map of cowpea (Muchero et al. Reference Muchero, Diop, Bhat, Fenton, Wanamaker, Pottorff, Hearne, Cisse, Fatokun, Ehlers, Roberts and Close2009) and to reconstruct its domestication history (Xiong et al. Reference Xiong, Shi, Mou, Qin, Motes, Lu, Ma, Weng, Yang and Wu2016). Genotyping-by-sequencing (GBS) enables cost-effective, genome-wide SNP discovery at scale (Kujur et al. Reference Kujur, Bajaj, Upadhyaya, Das, Ranjan, Shree, Saxena, Badoni, Kumar, Tripathi, Gowda, Sharma, Sube, Tyagi and Parida2015) and was therefore selected in the present study to characterize the genetic structure and diversity of the panel.
Breeding priorities in cowpea focus on several key traits, including early maturity to escape terminal drought, resistance to major parasitic weeds (Striga gesnerioides and Alectra vogelii), grain yield and quality (protein content, seed size and colour), fodder biomass production and adaptation to diverse agroecological conditions. These traits are critical to meet the needs of smallholder farmers operating under variable rainfall and soil fertility constraints across the Sahel (Hamidou et al. Reference Hamidou, Saïdou, Joly, Moussa Tchoffo, Sani Issa, Saadou Souley and Bakasso2023). However, the genetic structure of cowpea germplasm in Niger and in particular the relationships between local landraces and research-bred varieties from neighbouring Sahelian countries remains incompletely characterized. A recent study using DArTseq-based SNP markers revealed limited genetic diversity and a highly structured population in West African cowpea germplasm (Ali Koura et al. Reference Ali Koura, Wireko Kena, Annor, Adejumobi, Maina, Maazou, Razakou, Attamah, Kusi, Boukar and Akromah2024), but did not specifically address the role of farmer-managed diversity in Niger or the phenotypic correlates of genetic clusters. The present study addresses this gap by combining genome-wide GBS-based genotyping with phenotypic characterization of a participatory breeding-oriented diversity panel assembled across the main cowpea production areas of Niger.
A participatory breeding-oriented diversity panel composed of 185 accessions was assembled. It included a subsample of landrace accessions supplied by farmers involved in participatory plant breeding networks across western, central-eastern and central-southern cowpea production areas in Niger. The second subset of accessions was composed of varieties developed or maintained by research institutions and seed companies in West Africa (Burkina Faso, Niger, Nigeria and Senegal), that were included in the panel as sources of traits of interest like resistance to Striga gesnerioides, cycle duration, grain and fodder yield and quality.
This study aimed to investigate the genetic structure of the panel, with a particular focus on the relationships between the local germplasm in Niger and the diverse germplasm originating from neighbouring Sahelian countries. The specific objectives of the study were to: i) infer the genetic structure of the panel using genome-wide GBS markers; ii) assess the relationships between the genetic structure and the factors structuring the distribution of varieties (geographical origin, landraces versus research-bred varieties); iii) assess the genetic diversity of the panel; and iv) assess the distribution of phenotypic traits across the panel in relation to its genetic structure.
We hypothesized that: i) cowpea is structured into different genetic clusters spanning the sampled area of Niger and representing a significant portion of the species’ genetic diversity across the Sahel; ii) the majority of landrace accessions sharing the same variety name belong to the same genetic cluster when sampled within a restricted geographic area; iii) the genetic diversity maintained by farmers in landraces is higher than that maintained in varieties from research institutions or seed companies; and iv) phenotypic trait variation is shaped by the genetic structure.
Materials and methods
Plant material
A panel of 185 accessions of cowpea was assembled (Supplementary Table S1), comprising 125 accessions collected in Niger from farmers in the regions of Dosso, Maradi, Tillabery and Zinder (Fig. 1), 7 accessions provided by seed companies in Niger (Halal and Alheri), 3 accessions from International Crops Research Institute for the Semi-Arid Tropics (ICRISAT, Niger) and 10 accessions from Institut National de la recherche Agronomique du Niger (INRAN, Niger). Forty accessions were collected from neighbouring West African countries, including 9 accessions from Institut de l’Environnement et des Recherches Agricoles (INERA, Burkina Faso), 18 accessions from International Institute of Tropical Agriculture (IITA, Nigeria), 4 accessions from Ahmad Bello University (ABU, Nigeria) and 9 accessions from Centre d’étude régional pour l’amélioration de l’adaptation à la sécheresse (CERAAS, Senegal).
Locations where accessions were collected in Niger.

Figure 1 Long description
Map of Niger detailing cowpea varieties collection sites marked by red triangles. Administrative boundaries of Niger′s regions are outlined in red, while state boundaries are shown in green. Key regions include Tillaberi, Dosso, Maradi and Zinder. Notable collection sites are near Niamey, Dosso and Maradi. An inset map of Africa highlights Niger′s location. The legend explains symbols: red triangles for collection sites, red lines for administrative boundaries and green lines for state boundaries. The map includes a scale bar and compass for orientation.
Preparation of DNA samples
The accessions were sown in the greenhouse at CERAAS/ISRA (Thiès, Senegal). Fifteen seeds per accession were sown in a pot filled with soil. Each DNA sample was prepared by pooling an equal amount (0.1 g) of fresh leaf material from 10 individual plants (∼10 days after sowing) of the same accession. DNA extraction was performed following the extraction protocol of Risterucci et al. (Reference Risterucci, Grivet, N’Goran, Pieretti, Flament and Lanaud2000). The initial DNA concentration of each solution was adjusted by dilution with water. Subsequently, the DNA concentration of the samples was checked by Fluoroscan and then manually adjusted to a value of 10–20 ng/µl based on the protocol of Elshire et al. (Reference Elshire, Glaubitz, Sun, Poland, Kawamoto, Buckler and Mitchell2011).
DNA libraries preparation
Double digestion was performed on the DNA samples obtained from the previous step with the restriction enzymes PstI and MseI to improve genome coverage during sequencing. Adapters were ligated to the fragments generated by double digestion with DNA ligase. The adapters had barcodes allowing the identification of each bulk during the analysis. Two pools, each with a final volume of 240 µl and composed of 5 µl of 48 samples, were assembled with samples from the ligation. After purification by adding 500 µl of resin, the DNA pool was cleaned with 80% isopropanol; each of these pools was eluted in 50 µl of H2O and submitted to an amplification reaction. Each pool containing 48 DNA samples was distributed in eight wells and amplified by PCR before sequencing. The contents of the eight wells were then purified and eluted in 50 µl. A final pool of 96 samples was obtained in 30 µl. This constitutes a DNA library. The DNA fragment lengths in the library ranged from 200 to 400 bp. Sequencing was performed on an Illumina HiSeq 4000 system (150-bp, single-end reads) at the GeT-PlaGe platform in Toulouse, France. For each library, a fatsq files were generated.
Variant calling from the fastq files resulting from the DNA library sequencing
The fastq files obtained from the sequencing of the DNA libraries containing the multiplexed samples were demultiplexed with GBSX program (Herten et al. Reference Herten, Hestand, Vermeesch and Van Houdt2015) to obtain one fastq file per sequenced sample. Adapters that had been added during library preparation were removed from reads using CUTADAPT program (Martin Reference Martin2011). The FASTQC program was used for the quality control of the reads. Reads were mapped to the cowpea reference genome IT97K-499-35 (Lonardi et al. Reference Lonardi, Muñoz-Amatriaín, Liang, Shu, Wanamaker, Lo, Tanskanen, Schulman, Zhu, Luo, Alhakami, Ounit, Hasan, Verdier, Roberts, Santos, Ndeve, Doležel, Vrána, Hokin, Farmer, Cannon and Close2019), and SNPs were called using process_reseq.1.0.py from the VCFHunter package (Garsmeur et al. Reference Garsmeur, Droc, Antonise, Grimwood, Potier, Aitken, Jenkins, Martin, Charron, Hervouet, Costet, Yahiaoui, Healey, Sims, Cherukuri, Sreedasyam, Kilian, Chan, Van Sluys, Swaminathan, Town, Bergès, Simmons, Glaszmann, Van der Vossen, Henry, Schmutz and D’Hont2018). The program generated one VCF file per chromosome and contigs. These files were concatenated to produce a single final VCF file. Variants were filtered using the programs VCFPreFilter.1.0.py and vcfFilter.1.0.py, also from the VCFHunter package. SNPs arising from sequencing errors were removed. VCFTools v0.1.14 was then applied on the SNPs generated by vcfFilter (Danecek et al. Reference Danecek, Auton, Abecasis, Albers, Banks, DePristo, Handsaker, Lunter, Marth, Sherry, McVean and Durbin2011). Only sites with a minor allele frequency ≥0.025 and less than 30% missing data were retained.
Inference of genetic structure analysis
We used the maximum likelihood-based ADMIXTURE software (Alexander et al. Reference Alexander, Novembre and Lange2009) and the multivariate method DAPC (Discriminant Analysis of Principal Components; Jombart et al. Reference Jombart, Devillard and Balloux2010) to infer the structure of the panel (185 accessions) based on the SNP data obtained from SNP calling. To identify the best number of clusters (K) with ADMIXTURE, 15 values (K = 1 to K = 15) were tested, over 100 runs. For each of the 100 runs, the value of K corresponding to the lowest cross-validation error (CV error) was recorded. The most frequently occurring value of K across the 100 runs was selected. For the retained value of K, we used CLUMPP (CLUster Matching and Permutation Program) to aggregate ancestry proportions over the 100 runs (Jakobsson and Rosenberg Reference Jakobsson and Rosenberg2007). Each accession was classified in the genetic cluster for which it had the highest genome-wide ancestry proportion.
With DAPC, the find.clusters() function was used to identify the best value of K from K = 1 to K = 15 (70% of the cumulative variance, 100 repetitions and iterations n.iter = 1e5). The optimum number of clusters was chosen using the diffNgroup criterion, which evaluates changes in the Bayesian Information Criterion between two successive values of K. The function dapc () was used to describe the compositions of the clusters. Accessions were assigned to clusters based on the membership probabilities.
To verify if the assignment of the accessions to clusters was consistent, results from both methods were compared using a contingency table and a chi-square test. For the sake of parsimony, the lower optimal number of clusters between the two methods was retained for further analyses.
The degree of differentiation between the different genetic clusters was estimated by calculating the Fst between populations (Weir and Cockerham Reference Weir and Cockerham1984). The distribution of locally named accessions (landraces sharing the same vernacular name) across genetic clusters was examined. We performed a contingency analysis to test whether landraces (125 accessions collected from local producers in Niger villages) and 60 accessions from research institutions and seed enterprises were assigned to the same genetic clusters.
Genetic diversity analysis
Genetic diversity analyses were conducted within the clusters inferred by ADMIXTURE. We calculated the observed heterozygosity (Ho), the expected heterozygosity (He), the inbreeding coefficient (Fis) per cluster, the mean number of alleles per locus, and the allelic richness using the R package hierfstat. The number of private alleles was calculated using the R package poppr.
Phenotypic analysis
A trial on 200 accessions, of which 160 were included in the genomic analysis, was conducted at the ICRISAT research station (Sadore, 13° 14′; 2° 18′, Niger) from March to June 2019. The experiment was an augmented-block design of 10 blocks with five repeated checks.
The phenotypic data were collected during plant growth and analyzed using R software. Six phenotypic traits, including days to first branching, days to first flowering, days to maturity, grain yield, haulm yield and pod husk yield, were investigated. The missMDA package was used to impute missing phenotype values. Pairwise Pearson correlations among phenotypic traits were calculated. The distribution of each trait across genetic clusters was visualized to identify phenotypic differences among clusters and highlight key traits within each cluster.
Results
Genetic structure of the panel
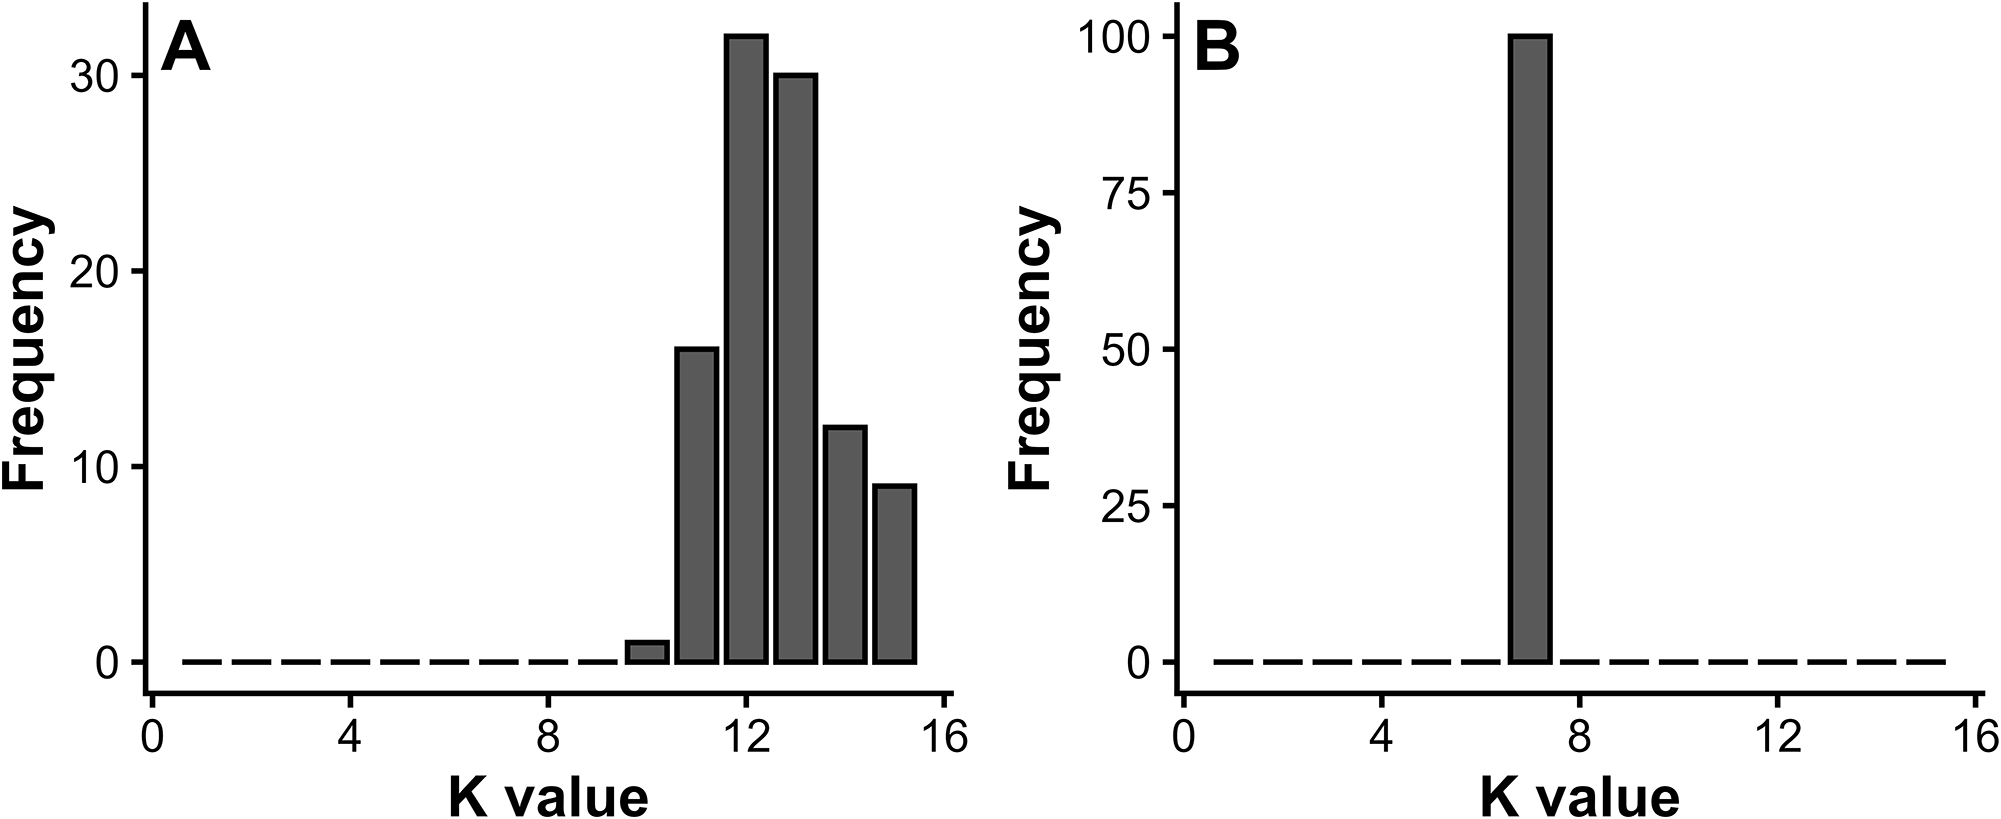
Following variant calling and SNP filtering, a total of 20,918 high-quality SNPs were retained. The distribution of these SNPs across cowpea chromosomes is presented in the supplemental material (Supplementary Figure S1). Genetic structure was assessed with these SNPs. ADMIXTURE identified K = 12 as the most frequently supported number of clusters across the 100 runs (Fig. 2). DAPC yielded more consistent results, identifying K = 7 across all 100 runs (Fig. 2B).
Choice of the optimal number of genetic clusters. (A) Frequency of K values selected by ADMIXTURE over 100 runs based on the CV error criterion. (B) Frequency of K values selected by DAPC over 100 runs based on the diffNgroup criterion.

A comparative overview of genetic structure inferred using ADMIXTURE (K = 12 and K = 7) and DAPC (K = 7) is provided in Table 2.
This comparison showed that the clustering solutions at K = 7 were congruent between DAPC and ADMIXTURE despite minor discrepancies in accession assignments (Table 1). Only a few accessions were assigned inconsistently between the two methods. A chi-square test of independence confirmed the concordance between the two clustering solutions (P < 2.2 × 10⁻¹⁶), indicating that the two methods were consistent. At K = 12, ADMIXTURE further split the seven main clusters into smaller sub-clusters, suggesting fine-scale intra-cluster substructure.
Cross-tabulation between DAPC and ADMIXTURE populations classification for K = 7 (DAPC) versus K = 12 and K = 7 (ADMIXTURE)

Table 1 Long description
Cross-tabulation counts how individuals in each DAPC group D1 through D7 are assigned to ADMIXTURE clusters under two settings, K12 and K7, with row and column totals. Total sample size is 185, with D7 the largest DAPC group at 99 and D1 at 22; other groups range from 8 to 19. Under ADMIXTURE K7, several DAPC groups map almost entirely to one cluster: D1 to A7 with 21 of 22, D2 to A6 with 11 of 11, D3 to A5 with 19 of 19, D4 to A4 with 12 of 12, and D5 to A2 with 14 of 14. D6 is mostly A2 at K7 with 6 of 8, with the remaining 2 in A3. D7 is more mixed but dominated by A1 at K7 with 78 of 99; the rest are spread across A2 through A6 in small counts. Under ADMIXTURE K12, D1 concentrates in A3 with 15 of 22, plus smaller counts in A9 and A11; D2 is entirely A4 with 11; D3 is entirely A8 with 19; D4 is entirely A12 with 12; and D5 is entirely A1 with 14. D7 is widely distributed across many K12 clusters, with the largest counts in A9 at 25, A6 at 22, A2 at 20, and A7 at 15, indicating finer subdivision at K12 compared with K7. Counts reflect categorical assignments and do not convey admixture proportions within individuals.
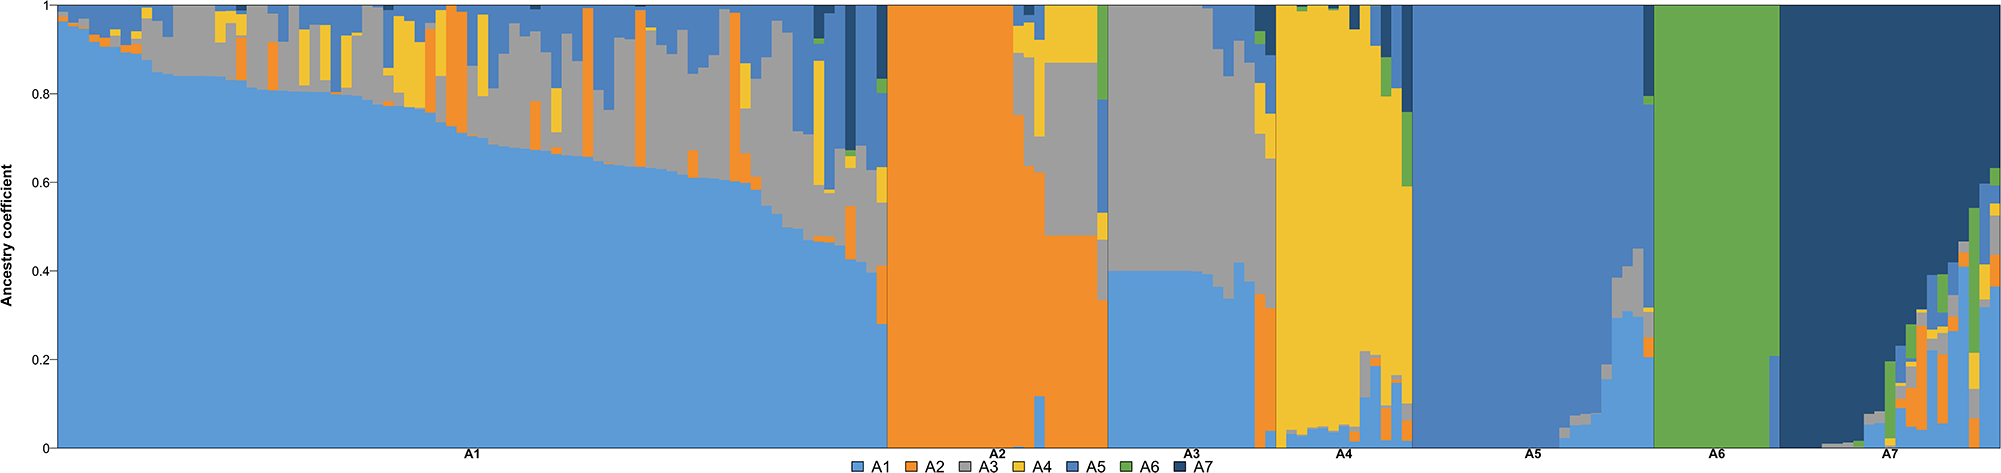
Based on this comparison, we retained the seven clusters inferred by ADMIXTURE for further analyses. Ancestry values were used to characterize the genetic clusters (Fig. 3). Cluster sizes were as follows: A1 (n = 79), A2 (n = 21), A3 (n = 16), A4 (n = 13), A5 (n = 23), A6 (n = 12) and A7 (n = 21). In the ancestry diagram (Fig. 3), each accession is represented by a vertical bar coloured according to its ancestry proportions, indicating the presence of admixture among clusters.
Genetic clusters and ancestry values inferred with ADMIXTURE at K = 7.

Figure 3 Long description
Stacked bar plot showing ancestry proportions inferred with ADMIXTURE at K equals 7. The vertical axis represents ancestry proportions ranging from 0.0 to 1.0. The horizontal axis is divided into seven labeled groups: A1, A2, A3, A4, A5, A6 and A7. Each vertical bar within a group represents one accession and each bar is subdivided into segments. Each segment corresponds to one of the seven inferred ancestry components. No legend is present in the image, so the specific identity of each ancestry component is not labeled. Each distinct segment within the bars represents a separate inferred ancestry component, numbered one through seven by convention of the K equals 7 setting. Groups can be broadly categorized by their level of admixture. Groups A1 and A6 are predominantly single-component, with most bars showing one dominant segment spanning nearly the full height of the bar from 0.0 to 1.0, indicating low admixture. Groups A2, A4 and A7 show higher admixture, with bars subdivided into multiple visible segments of varying proportions, indicating contributions from more than one ancestry component per accession. Groups A3 and A5 show transitional patterns, beginning with bars dominated by one component and shifting toward more mixed compositions within the group. A notable transition is visible between groups A4 and A5, where the dominant component changes across the boundary. The bars are arranged left to right from A1 to A7 and the ordering of accessions within each group appears to follow a fixed sequence. No numerical values are printed inside the bars and no color key or gradient legend is present in the image.
The distribution of clusters was analyzed according to the country of origin (Table 2).
A. Distribution of the accessions in the clusters resulting from the ADMIXTURE analysis according to the country of origin. B. Distribution of landraces from Niger according to the region of collection

Table 2 Long description
Counts of accessions assigned to ADMIXTURE clusters A1 through A7 are summarized by country, and Niger landraces are further broken down by collection zone and region. Across all countries, Niger has 146 of 185 accessions, far more than Nigeria with 21 and Burkina Faso and Senegal with 9 each. Cluster A1 is the largest overall with 79 accessions, driven mainly by Niger with 76; Nigeria contributes most of cluster A7 with 16 of 21. Senegal’s accessions are concentrated in cluster A4 with 8 of 9, while Burkina Faso is spread across several clusters, led by A2 with 4 of 9. Within Niger regions, Maradi has 55 landraces and Dosso has 44, together making up most of the 125 Niger landraces listed. Niger regional patterns are dominated by A1 in every region, with Maradi also showing a substantial A3 count of 11 and Dosso showing A5 at 8. Totals differ between the Niger-by-country panel and the Niger regional panel, so the regional breakdown likely reflects a subset of Niger accessions.
Accessions from Niger were present in all clusters, with more than half assigned to A1. Accessions from Burkina Faso were distributed across five clusters, but were predominantly assigned to A2, which they shared with 17 accessions from Niger. Accessions from Nigeria were predominantly assigned to A7, while those from Senegal were mostly assigned to A4.
Distribution of local cowpea landraces across genetic clusters in Niger
In total, 59% of the accessions collected from farmers in Niger were assigned to the A1 cluster. This cluster comprised accessions from all four surveyed regions. The landraces accounted for 16.12% of accessions in cluster A5 and 11.29% in A3. Overall, no clear geographic structuring pattern was observed among Niger landraces across genetic clusters (Supplementary Table S1 and Table 2B).
Relation between landrace name and genetic clustering
We analyzed whether accessions sharing the same local names belonged to the same genetic cluster. In general, accessions with the same vernacular name were assigned to a single genetic cluster, regardless of the village of provenance (Table 3). However, there were some exceptions. One of the three accessions of Baadare from Zinder was assigned to A5 cluster, while the other two from Maradi were assigned to the A1 cluster. One accession of Dan Bauchi collected from Dosso region was not assigned to the same cluster as the other two accessions of Dan Bauchi collected from Maradi. One of the four accessions of Doungouri Kirey was not assigned to the same cluster as the three others despite being collected from the same village.
Distribution of accessions with the same landrace name according to genetic clusters

Table 3 Long description
Landrace names are listed with their accession counts and the region and village where each accession was collected, alongside its genetic cluster. Across all landraces, cluster A1 dominates, covering all accessions for Dan Dam, Kwama, Hannu Marini, and Tchekoli. Dan Watsatsa has five accessions and all fall in cluster A3, spanning Maradi villages and one accession from Zinder. Baadare has three accessions split between A1 and A5, all from Maradi region but different villages. Dan Bauchi has three accessions, mostly A1 in Maradi with one accession in A2 from Dosso. Doungouri Kirey has four accessions from Dosso and is mixed, with one in A1 and three in A5, while Doungouri Koirey has four accessions mostly from Dosso plus one from Tillabery and all are in A1. Village names repeat for some landraces, indicating multiple accessions collected from the same locality. Counts reflect accessions listed in the table and do not indicate overall prevalence beyond the sampled locations.
Link between research-bred varieties and landraces distributions
No cluster consisted exclusively of landraces; all seven clusters comprised a mixture of landraces and research-bred varieties (Table 4). Cluster A1 was predominantly composed of landraces, while A2 showed a more balanced composition of approximately equal proportions of landraces and research-bred varieties. Clusters A3 and A5 were also landrace-dominated, with only two and three research-bred varieties, respectively. Cluster A4 was distinct in being largely composed of accessions from CERAAS (Senegal). Cluster A6 contained a diverse mix of landraces and research-bred varieties from multiple institutions. Cluster A7 stood out as the most differentiated, comprising 19 accessions from Nigeria (Supplementary Table S1 and Table 4).
Distribution of research-derived accessions compared to landraces in the panel

Table 4 Long description
Counts of two origin groups, landraces and research-derived accessions, are broken down across seven clusters labeled A1 through A7, with row and column totals. Landraces total 125 and are concentrated in cluster A1 with 74, with smaller counts in A5 with 20 and A3 with 14; only 1 landrace appears in A7. Research-derived accessions total 60 and are more evenly distributed, with the highest count in A7 at 20 and notable counts in A2 at 11, A6 at 10, and A4 at 9. Comparing groups by cluster, landraces dominate A1, while research-derived accessions dominate A7 and exceed landraces in A2, A4, A6, and A7. Overall cluster totals are highest for A1 at 79, followed by A5 at 23 and A2 and A7 at 21 each. These values describe the composition of this panel only and do not indicate statistical significance or causes of the clustering.
Genetic differentiation among clusters
Pairwise (Fst) revealed three broad patterns of genetic differentiation. Clusters A1 (accessions from Niger) and A2 (accessions from Niger) showed negligible differentiation (Fst = 0.03), suggesting a common genetic background consistent with their shared origin from Niger. Clusters A5 and A6 exhibited moderate differentiation (Fst = 0.09). In contrast, cluster A7, predominantly composed of accessions from Nigeria, was highly differentiated from all other clusters (Fst = 0.24–0.41), reflecting a distinct genetic pool associated with its geographic origin. The highest differentiation was observed between A4 (Senegal accessions) and A6 (mostly accessions from Niger, along with a small number from Burkina Faso and Nigeria), indicating markedly divergent genetic backgrounds between these two clusters. Overall genetic structure largely reflected geographic origin, with accessions from Niger clustering together (A1, A2 and A3) and clusters A7 (Nigeria) and A4 (Senegal) representing genetically distinct pools (Supplementary Table S3).
Genetic diversity within clusters
Ho was consistently low across all clusters, ranging from 0.095 (A6) to 0.143 (A7), consistent with the predominantly selfing mating system of cowpea. Clusters A1, A2 and A3 showed similar Ho values, reflecting their shared origin from Niger. He was lowest in A4 (0.194), likely reflecting its small size and geographically restricted origin, and highest in A6 (0.301) and A7 (0.290). Allelic richness followed a similar pattern, being highest in A6 and A7 and lowest in A4. The number of private alleles was markedly higher in A1 (n = 109), followed by A3 (n = 57), A5 (n = 21) and A7 (n = 21), while clusters A2, A4 and A6 contained very few private alleles (n = 1, 3 and 3, respectively), suggesting limited unique genetic variation in these clusters. Inbreeding coefficients (Fis) were high across all clusters, with the exception of A7 (Fis = 0.492), which was the only cluster with a value below 0.5, further supporting its genetically distinct background (Table 5).
Genetic diversity indices per cluster

Table 5 Long description
Genetic diversity indices are reported for clusters A1 through A7, including observed heterozygosity, expected heterozygosity, inbreeding coefficient, mean number of different alleles per variant site, allelic richness, and private alleles. Observed heterozygosity is lowest in A6 at 0.095 and highest in A7 at 0.143, with other clusters near 0.10 to 0.12. Expected heterozygosity ranges from 0.194 in A4 to 0.301 in A6, with A7 also high at 0.290 and A5 at 0.271. Inbreeding coefficients are high across all clusters, from 0.492 in A7 up to 0.653 in A6, indicating a consistent heterozygote deficit relative to expectations. Mean number of different alleles per variant site is highest in A1 at 1.990 and lowest in A4 at 1.720. Allelic richness is lowest in A4 at 1.190 and highest in A6 at 1.289, closely followed by A7 at 1.286 and A5 at 1.266. Private alleles vary sharply, with A1 having 109 and A3 having 57, while A2 has 1 and A4 and A6 have 3 each. Comparisons should be interpreted cautiously because differences in sampling or marker coverage can affect heterozygosity, richness, and counts of private alleles.
Distribution of phenotypic traits among different genetic clusters
The density distributions of phenotypes revealed substantial variability among the genetic clusters (A1–A7).
Days to first branching
The density distributions revealed clear differences among clusters A1–A7, indicating variation in the timing of vegetative development. Clusters A2, A4 and A6 showed later onset of branching, with distributions centred on higher values and relatively pronounced peaks. In contrast, clusters A1 and A3 exhibited slightly earlier branching, accompanied by broader distributions. Cluster A5 displayed a distribution skewed towards later branching, with a pronounced peak, indicating a relatively uniform but delayed branching onset. Cluster A7 showed an intermediate but comparatively narrow distribution (Fig. 4A).
Phenological traits density distribution across genetic clusters (A1–A7).

Figure 4 Long description
Three rows of density plots, each row representing different phenological traits across genetic clusters A1 to A7. The first row, labeled ′Start branching,′ shows density distributions over days after sowing for clusters A1 to A7. The second row, labeled ′Start flowering,′ presents similar density distributions for the same clusters. The third row, labeled ′Agronomic maturity,′ also displays density distributions over days after sowing for clusters A1 to A7. Each plot has the x-axis labeled as ′Days after sowing′ and the y-axis labeled as ′Density.′ The plots reveal variations in the timing of these phenological traits among the genetic clusters, with each cluster showing distinct distribution patterns.
Days to first flowering
The density distributions of the revealed substantial variation in flowering time among clusters A1–A7 revealed that the clusters A2 and A4 exhibited later flowering onset, with relatively symmetrical and broad distributions. Clusters A1 and A6 showed earlier flowering, but with wider distributions, indicating greater intra-cluster variability. Cluster A3 was characterized by a more synchronized flowering time, with a sharp peak and limited dispersion. Cluster A5 displayed a bimodal distribution, indicating the presence of two flowering subgroups. Cluster A7 exhibited earlier and relatively stable flowering, with a narrow distribution centred on lower values (Fig. 4B).
Days to agronomic maturity
The distribution of accessions in cluster A1 is fairly broad, with a peak around 72–75 days. In this cluster, there is a moderate maturity but significant variability. The maturity of accessions in cluster A2 is late, with a distribution peak around 78–80 days. The slightly asymmetrical distribution means that some individuals mature earlier. In A3, there is a bimodal distribution. This suggests two subgroups. The distribution of phenotypes in A4 is centred around 75–78 days. It is a relatively homogeneous cluster. Maturity in A5 is earlier than in A2 and A4, with a peak around 68–72 days. There is slight variability. In cluster A6, there is a spread distribution, centred around 70–75 days, with a tail toward late maturities. At A7, there is a clear peak around 70–73 days, but there is a small cluster that is earlier (∼60 days) (Fig. 4C).
Grain yield
Distributions revealed generally low and highly heterogeneous yield levels across most clusters. Distributions were strongly right-skewed, with a large proportion of observations concentrated at very low grain yield values. Clusters A1, A2, A3, A4, A6 and A7 exhibited similar patterns, characterized by a pronounced peak near zero grain yield and long right tails. In contrast, cluster A5 clearly differed from the others, showing a broader and more unimodal distribution with higher and more consistent grain yields (Fig. 5A).
Yield components density distribution across genetic clusters (A1–A7).

Figure 5 Long description
Three sets of density plots labeled A, B and C. Each set includes seven plots corresponding to genetic clusters A1 to A7. The vertical axis represents density or probability density. Set A shows grain yield in kilograms per hectare. Clusters A1, A2, A3, A4, A6 and A7 exhibit a pronounced peak near zero grain yield with long right tails, indicating low yield levels and high skewness. Cluster A5 displays a broader and more unimodal distribution, suggesting higher and more consistent grain yields. Set B shows haulm yield in kilograms per hectare. The distributions vary, with some clusters showing multiple peaks and wider spreads, indicating variability in haulm yield. Set C shows pod husk yield in kilograms per hectare. Similar to grain yield, clusters A1, A2, A3, A4, A6 and A7 have peaks near zero with long tails, while A5 shows a more consistent yield pattern. Overall, the plots reveal differences in yield distribution across clusters, with A5 consistently showing higher yields across all types. The consistent fill color and style across plots indicate uniformity in presentation.
Haulm yield
Clusters A1, A2, A4 and A6 showed bimodal distributions, suggesting the coexistence of contrasting levels of haulm production within these clusters. Cluster A3 was characterized by a relatively broad but smoother distribution, suggesting moderate and comparatively stable haulm yield. Cluster A5 exhibited the highest haulm yield values, with a distribution extending towards high biomass production. This pattern suggests a strong vegetative growth potential, possibly associated with vigorous genotypes or enhanced resource acquisition capacity. Cluster A7 showed a strongly skewed distribution towards low haulm yields, with only a few observations reaching high values. This profile indicates limited vegetative biomass production (Fig. 5B).
Pod husk yield
In general, distributions were highly right-skewed, with the majority of observations concentrated near zero, indicating limited pod husk biomass production in most environments or genotypes. Clusters A1, A2 and A3 exhibited similar patterns, characterized by a sharp peak at very low values and a long right tail. Cluster A4 showed an extreme distribution, with a very narrow peak close to zero and a few isolated high-value observations. Cluster A5 clearly differed from the other clusters by exhibiting a broader and more continuous distribution, extending towards higher pod husk yield values. This indicates a greater and more consistent production of pod husk biomass. Clusters A6 and A7 displayed distributions strongly concentrated near zero, with only minor secondary peaks, indicating very limited pod husk production and high sensitivity to environmental or developmental constraints (Fig. 5C).
Discussion
The broad congruence between DAPC and ADMIXTURE results, consistent with previous comparisons of multivariate and Bayesian approaches (Soler et al. Reference Soler, Saidou, Hamadou, Pautasso, Wencelius and Joly2013; Liu et al. Reference Liu, Shringarpure, Lange and Novembre2020), strengthens confidence in the inferred genetic structure.
At the country level, genetic structure broadly reflected geographic origin, with accessions from Niger predominantly assigned to clusters A1, A2, A3 and A5, accessions from Senegal to A4 and accessions from Nigeria to A7. According to Fst values, cluster A7 showed pronounced genetic differentiation from all other clusters (Fst = 0.24–0.41), indicating a markedly divergent genetic background, consistent with previous findings by Ali Koura et al. (Reference Ali Koura, Wireko Kena, Annor, Adejumobi, Maina, Maazou, Razakou, Attamah, Kusi, Boukar and Akromah2024). Although our results differ from those of Xiong et al. (Reference Xiong, Shi, Mou, Qin, Motes, Lu, Ma, Weng, Yang and Wu2016), who identified only three genetic clusters among 768 accessions from 22 countries, both studies consistently placed Niger and Nigerian accessions into distinct clusters. The clustering of accessions from Nigeria into a single cluster may be partly explained by their narrow genetic base, as previously reported by Li et al. (Reference Li, Fatokun, Ubi, Singh and Scoles2001), who documented limited polymorphism among Nigerian research varieties. In contrast, a study of cowpea accessions from 50 countries classified accessions from Niger and those from Nigeria into the same genetic cluster (Fatokun et al. Reference Fatokun, Girma, Abberton, Gedil, Unachukwu, Oyatomi, Yusuf, Rabbi and Boukar2018), suggesting that the resolution of genetic structure depends on the diversity and composition of the panel.
Research-bred varieties from Burkina Faso were distributed across five clusters: A1 (n = 1), A2 (n = 4) and A5 (n = 1), which they shared predominantly with Niger landraces, A6 (n = 2) and A7 (n = 1), which they shared with research-bred varieties from Nigeria. This scattered distribution suggests a variable degree of genetic relatedness within research-bred varieties from Burkina and the other accessions in the panel, likely reflecting the diverse origin of parental lines used in Burkinabe breeding programs. Nearly all accessions from Senegal (99%) were assigned to cluster A4, which showed moderate differentiation from A1 and A2 but pronounced differentiation from A3 and A5, suggesting moderate genetic distance between Senegalese accessions and most Niger landraces. The grouping of accessions from Senegal into a single cluster may reflect their status as farmers’ varieties rather than research-derived materials, implying a more localized and less genetically diverse origin. This pattern is consistent with the findings of Kouakou et al. (Reference Kouakou, Roy-Macauley, Gueye, Otto, Rami and Cissé2007), who reported low gene flow among local cowpea accessions in the Louga region of Senegal using SSR markers, a phenomenon attributed to concentrated seed purchases and small effective population sizes. The genetic distinctiveness of cluster A4, therefore, reflects the specific evolutionary trajectory of landraces from Senegal under farmer management, rather than a narrow breeding base as observed for research-bred varieties from Nigeria.
Regarding our third hypothesis that genetic diversity maintained by farmers in landraces is higher than that maintained in research-bred varieties, the results provide only partial support. While research-bred varieties from Nigeria were predominantly confined to a single cluster (A7) with a well-documented narrow genetic base (Li et al. Reference Li, Fatokun, Ubi, Singh and Scoles2001), consistent with the hypothesis, research-bred varieties from Burkina Faso were distributed across five clusters (A1, A2, A5, A6 and A7), suggesting a level of genetic diversity comparable to that observed among farmer-managed landraces. These contrasting patterns indicate that the genetic diversity of research-bred varieties is not uniformly narrow, but rather reflects the breeding strategies and diversity of parental lines used in each country’s programs. The hypothesis is therefore only partially validated and should be interpreted with caution when generalizing across different institutional contexts.
Within Niger, however, landraces were predominantly assigned to clusters A1, A2, A3 and A5, with no clear geographic pattern among localities. Geographical origin does not always predict the underlying genetic structure (Xiong et al. Reference Xiong, Shi, Mou, Qin, Motes, Lu, Ma, Weng, Yang and Wu2016; Fatokun et al. Reference Fatokun, Girma, Abberton, Gedil, Unachukwu, Oyatomi, Yusuf, Rabbi and Boukar2018; Sarr et al. Reference Sarr, Bodian, Gbedevi, Ndoye Ndir, Oyatomi, Gueye, Foncéka, Diop, Diop Baye, Cissé and Diouf2021). This lack of fine-scale geographic structuring within the country is likely attributable to gene flow facilitated by seed exchanges among farmers from different localities, including donations, seed companies and agricultural extension services (Sarr et al. Reference Sarr, Bodian, Gbedevi, Ndoye Ndir, Oyatomi, Gueye, Foncéka, Diop, Diop Baye, Cissé and Diouf2021). This finding partially supports our second hypothesis, which predicted that landraces sharing the same variety name would belong to the same genetic cluster when sampled within a restricted geographic area. In general, accessions sharing a given variety name, regardless of their locality of origin, were assigned to the same genetic cluster. The exceptions observed for varieties Baadare, Dan Bauchi and Doungouri Kirey may be related to farmers’ naming practices, which are typically based on observed agro-morphological characteristics. As a result, two genetically distinct landraces with similar morphology may receive the same name. According to Gbaguidi et al. (Reference Gbaguidi, Dansi, Loko, Dansi and Sanni2013), synonyms and duplicates need to be clarified to correctly assess diversity within local varieties.
The phenotypic characterization reported here was carried out over a single growing season. While multi-year evaluation is generally recommended to capture genotype × environment interactions at the individual genotype level, the objective of the present study was to characterize phenotypic distribution at the cluster level, not to evaluate the stability of individual accessions. Because each cluster comprises multiple accessions, within-cluster variation inherently buffers the influence of environmental variation due to block or plot effects, and cluster-level phenotypic patterns are expected to be comparable with no bias. This approach is consistent with published studies on crop species in which single-season phenotypic data were sufficient to identify meaningful and agronomically interpretable genetic clusters. Nkhoma et al. (Reference Nkhoma, Shimelis, Laing, Shayanowako and Mathew2020), characterizing cowpea germplasm from Zambia and Malawi using SNP markers and phenotypic traits in a single crop season, successfully identified four genetically and phenotypically distinct clusters and selected complementary parental lines for breeding. Similarly, Aski et al. (Reference Aski, Rai, Reddy, Gayacharan, Dikshit, Mishra and Schafleitner2021), screening a mungbean mini-core collection for root traits in a single experimental period, delineated eight homogeneous phenotypic clusters with clear implications for drought adaptation breeding. The phenotypic data presented here should therefore be interpreted as cluster-level profiles, which provide useful information on phenotype distribution, while acknowledging that further multi-environment evaluation of candidate accessions would strengthen recommendations for specific breeding crosses.
Among the seven genetic clusters, A5 combined early maturity, high haulm yield and superior grain yield, whereas the other clusters showed variable flowering and maturity but consistently low, multimodal yields, making it a high-priority cluster for breeding and a potential source of candidate parents for yield improvement. Cluster A2 exhibited late maturity, late flowering and late branching, but low grain and haulm yield. This cluster could be valuable for incorporating late-maturing traits relevant to specific drought response strategies. Cluster A7 represented a potential source of earliness with limited productivity. Cluster A3 exhibited bimodal phenological patterns, indicating substructure within the cluster and suggesting its potential as a source of contrasting alleles for genetic studies. The identification of genetically and phenotypically contrasting clusters provided a practical framework for parent selection in decentralized participatory breeding programs. Combining complementary traits such as early maturity (A5 and A7) and late phenology (A2) may enhance adaptation across contrasting Sahelian environments.
Crosses between high-performing clusters (A5) and genetically distant but phenotypically contrasting clusters (A2 or A3) would be expected to maximize allelic recombination and transgressive segregation, thereby increasing the probability of selecting superior lines under farmer-managed conditions. Furthermore, the absence of clear geographic structuring among landraces suggests that selection strategies could be guided by empirical genetic and phenotypic variation rather than geographic origin. This would be particularly relevant for participatory varietal selection in heterogeneous production systems.
A high variability of haulm yield within and among genetic clusters was observed. Previous reports showed limited correspondence between vegetative biomass production and geographic or genetic clustering in cowpea germplasm as reported in earlier (Gumede et al. Reference Gumede, Gerrano, Modi and Thungo2022).
The phenotypic differentiation observed among the seven genetic clusters indicates that molecularly inferred population structure corresponds to functionally relevant agronomic variation, as reported in earlier cowpea diversity studies (Nkhoma et al. Reference Nkhoma, Shimelis, Laing, Shayanowako and Mathew2020).
Conclusion
This study identified 20,918 SNPs, enabling the identification of the inference of genetic structure with seven well-differentiated genetic clusters. The major cluster, which contained 59.67% of Niger landraces, was composed of accessions from the two main cowpea production zones (west and south-central), suggesting limited geographical differentiation. Research-bred varieties from Nigeria were genetically distant from Niger landraces. Some accessions from Burkina Faso showed close genetic affinity with Niger landraces. The accessions from Senegal formed a separate cluster, even though they showed moderate genetic distance from Niger landraces. The combination of genomic structure inference with the analysis of phenotypic traits distribution provided a robust framework for further association mapping and breeding. The identification of phenotypic variation within and among genetic clusters enhances the power for the detection of marker-trait associations. The complementary profiles of clusters for phenology and yield-related traits should support the selection of genetically diverse parents to promote recombination and adaptation in breeding programs.
Supplementary material
The supplementary material for this article can be found at https://doi.org/10.1017/S1479262126100781.
Acknowledgements
The authors thank Daniel Fonceka, Caroline Calatayud, Pierre Mournet and Stéphanie Sidibé Bocs from CIRAD (Montpellier) for their support and assistance with data analyses. We thank Souleymane Abdou (INRAN, Niger), Amy Bodian (Ceraas/ISRA, Senegal), Saadou Souley Mahaman Nourou (Université Dan Dicko Dankoulodo de Maradi, Niger) and Ousmane Boukar (IITA, Nigeria) for the cowpea accessions provided. We are thankful to Hélène. I Joly (CIRAD) and Fanna Maina (INRAN) for fruitful discussions throughout the study. The authors are also grateful to Issoufou Hassane Bil-Assanou, Salifou Nouhou Jangorzo and Abou-Soufianou Sadda from the Université Dan Dicko Dankoulodo de Maradi (Niger) for their valuable advice and support. Artificial intelligence (AI) tools, including ChatGPT (OpenAI) and Claude (Anthropic), were used during the preparation of this manuscript exclusively to improve English language quality, grammar and readability. All scientific analyses, data processing, validation of results, interpretations and conclusions were performed by classical/human processes and verified by the authors. The authors take full responsibility for the content of this manuscript.
Funding statement
This work was funded by the McKnight Foundation’s CRFS Programme (formerly CCRP) under grant No. 15-114 (CowpeaSquare project). H.H.H was supported by a PhD fellowship from the CowpeaSquare project and the French Embassy in Niger (SCAC).




 Open access

