I. INTRODUCTION
Shape memory alloys (SMAs) have been extensively studied from the fundamental and technological viewpoints. The most commonly studied SMAs are the Ti–Ni systems with nearly equiatomic composition because of their superior shape memory effect (SME) and superelasticity (SE) resulting from its austenitic and martensitic structures. Reference Otsuka and Shimizu1–Reference Wu and Lin4 In addition to its corrosion resistance, wear resistance, and biocompatibility, Ti–Ni SMAs exhibit high damping capacity that is of great importance to devices, where minimization of vibration during operation is critical to the device performance. Below the martensite finish temperature, M f, transformation of the parent phase to the martensitic phase is complete. When Ti–Ni SMA is deformed below the M f temperature, a residual strain remains after unloading. However, heating the specimen up to above the austenite finish temperature, A f, the residual strain can be completely recovered and the specimen retains its original shape. This phenomenon is known as SME. Reference Muir Wood and Clyne5 Above the A f temperature, SMAs can demonstrate SE, in which relatively large mechanically imposed strains (up to ∼8%) can be accommodated by the stress-induced martensitic transformation. This martensitic phase reverts to the parent phase upon removal of the applied load to result in SE. Reference Muir Wood and Clyne5
Most existing studies on SMAs dealing with SME and SE are at the macroscale. Recent advances in semiconductor processing techniques and microdevices have prompted the studies of SE of SMAs at the micro/nanoscale. Reference Nespoli, Besseghini, Pittaccio, Villa and Viscuso6–Reference Bellouard8 Indentation is one of the typical techniques to characterize the mechanical response of materials. Recently, the nanoindentation technique has been used to characterize the local mechanical response at the submicrometer scale. Reference Shaw, Stone, Johnson, Ellis and Crone9–Reference Pfetzing-Micklich, Wieczorek, Simon, Maaß and Eggeler13 During loading, the displacement could result from the elastic/plastic deformation and phase transformation. The load–displacement curve can be used to extract the information on whether the displacement is accommodated by the phase transformation and whether SE takes place. Also, equipped with a heating stage, nanoindentation on SMAs can be performed at various temperatures. Specifically, when the A f temperature is above the room temperature, tests can be performed either below or above A f using the heating stage. In this case, systematic studies can be performed by controlling the amount of the parent phase present prior to loading, and the degree of superelastic response can be controlled. Unlike nanoindentation for which the stress field is localized and the stress-induced phase transformation is also localized, pillar compression Reference San Juan, No and Schuh14–Reference Bowers, Chen, De Graef, Anderson and Mills19 yields relatively uniform stress in the SMA pillar and it was also adopted in the present study to explore the global superelastic behavior of TiNi-based SMAs.
The objective of the present study is to develop TiNi-based SMAs for the possible applications at the micro/nanoscale, such as actuators. To achieve this, we processed three TiNi-based SMAs, Ti49.05Ni50.95, Ti49.49Ni49.71Fe0.8, and Ti49.93Ni50.07, whose A f temperatures were −29.2, 10.0, and 95.1 °C, respectively. Nanoindentations performed on Ti49.05Ni50.95 and Ti49.49Ni49.71Fe0.8 at room temperature and different peak loads resulted in stress-induced martensitic transformation and revealed the superelastic behavior upon unloading. For Ti49.93Ni50.07, nanoindentations performed at various temperatures showed different degrees of SE because of the different amounts of phase transformation taking place during the indentation process. While nanoindentation was used to study the localized superelastic behavior, micropillar compression tests were also performed to study the global superelastic behavior of TiNi-based SMAs. The findings of this work demonstrate the potential of integrating TiNi-based SMAs into MEMS and NEMS components that exhibit SE which, in turn, would result in a new generation of functional micro- and nanodevices.
II. EXPERIMENTAL PROCEDURES
A. Materials and preparation
In the present study, three compositions of TiNi-based SMAs, Ti49.93Ni50.07, Ti49.05Ni50.95, and Ti49.49Ni49.71Fe0.8 were processed, and they were named as 50Ni, 51Ni, and 1Fe, respectively. Specifically, the alloys were prepared from sponge Ti (99.9 mass%), electrolytic Ni (99.9 mass%), and electrolytic Fe (99.9 mass%) in a high-frequency vacuum induction furnace using a graphite crucible, followed by casting into an iron mold. Ingots were homogenized at 1273 K for 5 h in air. Then, wires were hot forged, hot and cold swaged into 2 mm in diameter from the ingots.
Specimens for nanoindentation were cut into ∼3 mm in length from wires. The specimens were solution treated in vacuum at 1273 K for 1 h and then quenched into water. To remove surface scales, chemical polishing was performed in a mixture of HF:HNO3:H2SO4:H2O = 1:1:1:1 in volume. Electropolishing of the specimen was performed by Buehler electromet4 polisher/etching using the solution of 90%CH3OH + 10%H2SO4. For indentation tests, the specimens were cold-mounted with Buehler EpoxiCure® (Buehler, Lake Bluff, IL). The solidification time of cold mounting was longer than 24 h. During the solidification process, the samples were put in the vacuum to avoid bubbles trapped in the mounting compound. The mounted samples were subsequently ground with #80, #150, #320, #600, #1200, #2000, and #4000 grinding papers. Thereafter, the samples were polished with 1 and 0.25 μm diamond suspensions by Buehler MiniMet®1000 (Buehler, Lake Bluff, IL). The MicroCloth® polishing cloth was used for both 1 and 0.25 μm diamond suspensions.
B. Characterization
The phase transformation temperatures were determined by differential scanning calorimetry (DSC, Q10, TA Instruments). A high power monochromatized x-ray diffractometer (XRD, TTRAX Ⅲ, Rigaku Co., Tokyo, Japan) with Cu Kα using an acceleration voltage of 50 kV and working current of 250 mA was used to analyze the structure. Electron backscatter diffraction (EBSD) was used to examine the crystallographic orientation. Microindentation was performed using Mitutoyo HM Vickers Hardness Tester to measure the micro-Vickers hardness (HV) of the specimen. The load was 50 g and the loading time was 15 s. The hardness measurements were performed on the cross section of 2 mm diameter specimen in both the center and the edge regions. Ten indentations were measured in each region of the specimen and the HV value was taken from the average of these data without the maximum and the minimum values.
Nanoindentation was performed using Hysitron TI 950 TriboIndenter (Minnesota) to characterize the localized superelastic behavior of TiNi-based SMAs. The load function was fixed at a constant strain rate of 0.2 s−1 without holding time. Also, with a heating stage in Hysitron TI 950 TriboIndenter, nanoindentation can be performed at various temperatures. Specifically, the specimen was first heated up to the desired temperature during the test, and the indenter tip was then brought to be in contact with the specimen surface. To stabilize the temperature, the holding time before performing indentation was at last 30 min. Also, the specimen was heated at the bottom and a thermal couple was attached to the upper surface of the specimen to ensure that the indented surface reached the set temperature. While a conical diamond indenter tip of 5 μm tip radius was used for indentations at room temperature, a Berkovich probe of 150 nm tip radius was adopted for indentations at high temperatures.
Micropillar compression tests were performed using the same nanoindenter, and a conical diamond indenter tip of 5 μm radius was used in the present study. The equipment is capable of scanning the surface of the specimen with a constant force by means of a piezoelectric scanning system, and it is useful in precisely positioning the indenter tip over the pillar. The contact force for scanning the surface was set at 1 μN in the present study to prevent preloading and bending of the pillar. Multiple-cycle compression tests were performed on the pillar. In this case, a constant loading rate of 250 μN s−1 was used and the peak load for each cycle was increased by 500 μN compared with the previous cycle. Also, to fabricate the micropillars, focused ion beam (FIB) and electron beam system (FEI Helios 600i, Hillsboro, OR) were used to micromachine the cylindrical pillars with ∼1 μm radius from TiNi-based SMA samples. To minimize the surface damage by FIB milling, a low power condition was used to clean the pillar surface.
III. RESULTS AND DISCUSSION
The phase transformation temperatures obtained from DSC, the structure obtained from XRD, the grain orientation obtained from EBSD, the hardness obtained from Vickers indentation, SE obtained from nanoindentation, and the results from micropillar compression tests are presented as follows.
A. Phase transformation temperatures
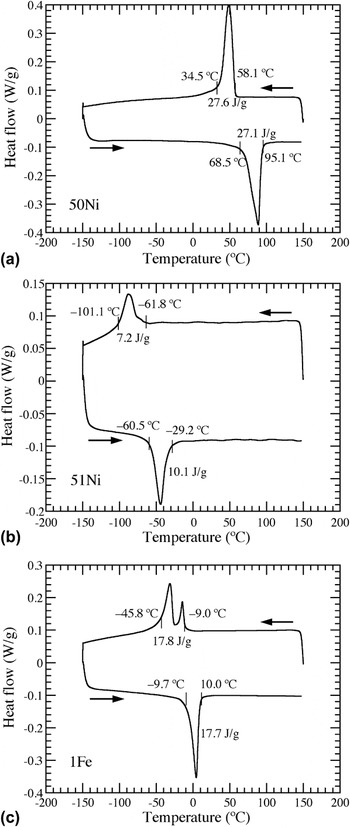
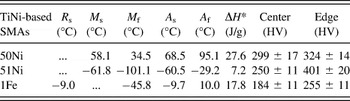
The transformation temperatures of TiNi-based SMAs were determined using DSC with a heating/cooling rate of 10 K/min. DSC curves of 50Ni, 51Ni, and 1Fe are shown, respectively, in Figs. 1(a) and 1(c). The starting (M s) and finishing (M f) temperatures of martensitic transformation and the starting (A s) and finishing (A f) temperatures of austenitic transformation of these SMAs are listed in Table I. Both 50Ni and 51Ni exhibit one-stage transformation of B2 → B19′ as shown in Figs. 1(a) and 1(b). The M s temperature of 50Ni (58.1 °C) is higher than that of 51Ni (−61.8 °C). This is in agreement with the report elsewhere Reference Frenzel, George, Dlouhy, Somsen, Wagner and Eggeler20 that M s decreased with increasing Ni content by ∼100 K/at.% for TiNi SMAs. For 1Fe, a rhombohedral R-phase structure occurs prior to B19′ phase due to the addition of Fe, Reference Miyazaki and Otsuka21,Reference Olbricht, Yawny, Pelegrina, Dlouhy and Eggeler22 and thus a two-stage B2 → R → B19′ transformation in cooling and B19′ → B2 transformation in heating are observed in Fig. 1(c). The formation of R-phase was believed to result from the presence of precipitates or dislocations in SMAs. Reference Miyazaki and Otsuka21,Reference Olbricht, Yawny, Pelegrina, Dlouhy and Eggeler22 The starting transformation temperature of R-phase, R s, of 1Fe is also listed in Table I. Since the transformation peaks of B2 → R and R → B19′ overlap each other, the R f and M s temperatures cannot be clearly defined from the curve. According to the transformation temperatures determined from the DSC curves, both 51Ni and 1Fe SMAs are in B2 parent phase and 50Ni SMA is in B19′ martensite at room temperature.
DSC curves of (a) 50Ni, (b) 51Ni, and (c) 1Fe showing the phase transformation temperatures.

The transformation temperatures and enthalpy of transformation determined from DSC curves and the hardness values in the center and the edge regions determined from Vickers indentation of 50Ni, 51Ni, and 1Fe.

B. XRD and EBSD results
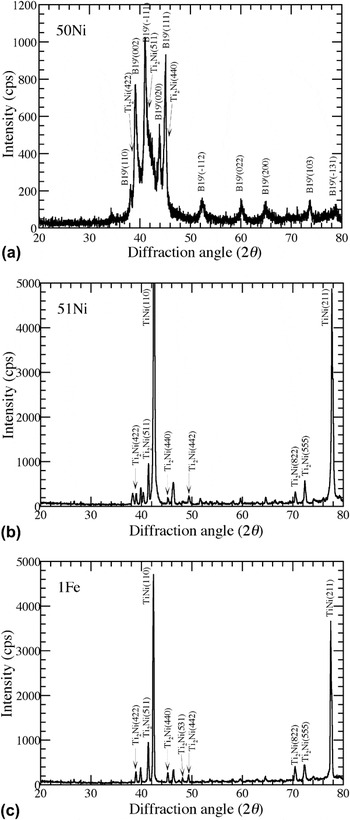
The XRD profiles of the three TiNi-based SMAs are shown in Fig. 2. The B2, B19′, and Ti2Ni phases in TiNi-based SMAs are indexed with JCPDS cards of numbers 65-7711, 65-145, and 72-442, respectively. While the XRD result shows a
 $\left( {\bar 111} \right)$
B19′ preferred orientation for 50Ni in Fig. 2(a), it shows a strong (110)B2 preferred orientation for both 51Ni and 1Fe in Figs. 2(b) and 2(c). Furthermore, the strong diffraction peak of the precipitate Ti2Ni phase from {511} planes can be observed at 41.4° for the three TiNi-based SMAs. Hence, the phases obtained from XRD at room temperature (Fig. 2) agree with the DSC results shown in Fig. 1. However, the presence of Ti2Ni precipitates in TiNi-based SMAs is noted from the XRD results.
XRD results of (a) 50Ni with B19′ phase, (b) 51Ni and (c) 1Fe with B2 phase. Ti2Ni precipitates are present in the three TiNi-based SMAs.

To identify the texture and preferred orientation of SMAs, EBSD was used. However, because the Kikuchi lines associated with B19′ structure are absent in the data bank of EBSD, the inverse pole figure was not mapped for 50Ni. The inverse pole figure maps of 51Ni and 1Fe revealed a strong (111) preferred orientation (figure not shown). This indicates that the specimens show strong texture from the forging/swaging process of SMA wires.
C. Hardness measurements
The microindentation hardness measurements were performed on the cross section of 2 mm diameter specimens in both the center and the edge regions. The measured hardness was in the range of ∼200 to 400 HV and the results are also listed in Table I. However, it is worth noting that the hardness in the edge region is always higher than that at the center for all three TiNi-based SMAs. This could be attributed to the work hardening effect during forging and swaging and the accumulation of lattice defects such as dislocations on the lateral surface of the wire enhances the hardness in the edge region.
D. Superelasticity
1. 51Ni and 1Fe
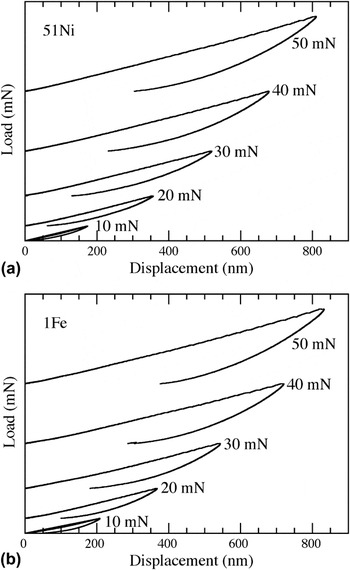
The A f temperatures of 51Ni and 1Fe are −29.2 and 10.0 °C, respectively, which are below the room temperature and both SMAs remain in B2 parent phase at room temperature. Using nanoindentation, the load–indent depth curves of 51Ni and 1Fe are shown in Figs. 3(a) and 3(b), respectively. Upon stress-induced martensitic transformation, a sudden increase in the indent depth (i.e., pop-in) is expected in the loading curve. However, this pop-in behavior could not be observed in the curves. This could be attributed to the fact that only a small volume of the specimen under the indenter tip is subjected to sufficiently high stress to induce phase transformation and the contribution of the volume change due to the phase transformation from this small volume to the total displacement is too small to reveal observable pop-in events in the curve.
Nanoindentation load–displacement curves for (a) 51Ni and (b) 1Fe at different peak loads. Curves are offset vertically from the origin for clear viewing.

To quantify the amount of SE recovery during nanoindentation, the remnant depth ratio (RDR) has been defined. This index is the ratio of the remnant depth to the maximum depth in the load–indent depth curve, such that Reference Muir Wood and Clyne5,Reference Muir Wood, Sanjabi, Fu, Barber and Clyne23
 $${\rm{Remnant\ depth\ ratio\ }}\left( {{\rm{RDR}}} \right) =\; {{{\rm{Remnant\ depth}}} \over {{\rm{Maximum\ depth}}}} \;\times 100\% \quad {\rm{.}}$$
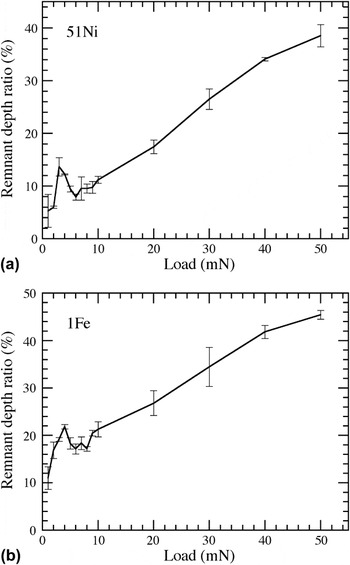
Based on the load–indent depth curves shown in Fig. 3, RDR as a function of the peak load is shown in Figs. 4(a) and 4(b) for 51Ni and 1Fe, respectively. For 51Ni, RDR increases initially when the peak load increases from 1 to 3 mN and then decreases with the peak load until the peak load reaches ∼6 mN. Afterward, RDR increases again with the peak load. In this case, the initial increase in RDR could result from the breaking of surface oxidation layer and/or the increasing plastic deformation with loading. It has been reported that Ti–Ni SMAs are prone to oxidation with an oxide layer TiO2 of ∼7 nm. Reference Ishida and Sato24 This breaking of surface oxidation layer during indentation cannot be recovered after unloading. When the load reaches 3 mN, stress-induced martensitic transformation is triggered to contribute to the displacement during loading which recovers after unloading and results in the decrease in RDR. As the load reaches ∼6 mN, plastic deformation controls the indent displacement and RDR increases with peak loading. It is shown in Fig. 4(a) that RDR is 7.9% when the peak load is 6 mN, and RDR increases up to 38.5% when the peak load is 50 mN. Our results are in agreement with a previous report Reference Muir Wood and Clyne5 that RDR is typically higher than 30% for Ni-rich TiNi SMAs in the loading range of 10–50 mN. For 1Fe, the trend of RDR versus peak load shown in Fig. 4(b) is similar to that shown in Fig. 4(a) for 51Ni. In this case, stress-induced martensitic transformation contributes to the indent displacement during loading for the peak loading range of 4–8 mN. However, compared to 51Ni, 1Fe shows higher RDR and less superelastic recovery. This could be attributed to the lower hardness and the ease of generating dislocations in 1Fe. Reference Otsuka and Shimizu1 Also, it is worth noting that the above superelastic behavior was obtained from indentation performed at the center of the sample. This superelastic behavior became much less obvious in the edge region of the specimen. This indicates that the presence of work hardening and accumulation of dislocations in the edge region inhibit the phase transformation and suppress the superelastic behavior. It has also been reported elsewhere that increasing dislocation density would make stress-induced martensitic transformation more difficult to form. Reference Zhang, Somsen, Simon, Ding, Hou, Ren, Ren, Eggeler, Otsuka and Sun25
The RDR as a function of the peak load for (a) 51Ni and (b) 1Fe.

The stress required to trigger martensitic transformation can be evaluated using Hertz theory of elastic contact. Reference Johnson26,Reference Hsueh and Miranda27 In this case, the contact radius, a, can be related to the indentation load, P, by
 $$a = {\left( {{{3PR} \over {4{E_{\rm{r}}}}}} \right)^{1/3}}\quad {\rm{,}}$$
where R is the radius of the indenter tip and E r is the reduced Young's modulus, such that
 $${1 \over {{E_{\rm{r}}}}} = {{1 - \nu _{\rm{i}}^2} \over {{E_{\rm{i}}}}} + {{1 - \nu _{\rm{s}}^2} \over {{E_{\rm{s}}}}}\quad {\rm{,}}$$
where E and ν are the Young's modulus and Poisson's ratio and the subscripts, i and s, denote the indenter tip and the specimen, respectively. With the contact radius given by Eq. (2), the average contact stress under the indenter, σ, is
 $$\sigma = {P \over {\pi {a^2}}} = {\left( {{{16PE_{\rm{r}}^2} \over {9{\pi ^3}{R^2}}}} \right)^{1/3}}\quad {\rm{.}}$$
Also, the corresponding indenter displacement, d, is
 $$d = {{{a^2}} \over R} = {\left( {{{9{P^2}} \over {16RE_{\rm{r}}^2}}} \right)^{1/3}}\quad {\rm{.}}$$
This indenter displacement is elastic and recovered upon unloading.
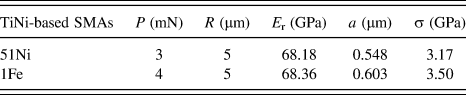
The Young's modulus and Poisson's ratio of Ti–Ni SMAs have been reported as 71 GPa and 0.3, respectively. Reference Tsuchiya, Hada, Ohnuma, Nakajima, Koike, Todaka and Umemoto28,Reference Frick, Lang, Spark and Gall29 Also, for a diamond indenter tip, E i is 1140 GPa and νi is 0.07. Using the above data, the reduced Young's modulus, E r, calculated from Eq. (3) is 73.05 GPa. In the meanwhile, E r can also be obtained directly from the unloading curve of our nanoindentation measurements and it is 68.18 GPa for 51Ni and 68.36 GPa for 1Fe and both are not very different from 73.05 GPa. Using P obtained from Fig. 4, R = 5 μm, E r obtained from our nanoindentation load–displacement curves, the contact radius, a, and the average contact stress, σ, calculated from Eqs. (3) and (4) are listed in Table II. The average contact stress, σ, at the critical load to trigger martensitic transformation in 51Ni and 1Fe obtained in the present study are 3.17 and 3.50 GPa, respectively, which are not very different from the reported value of 4 GPa. Reference Frick, Lang, Spark and Gall29
The contact radius, a, and the average contact stress, σ, at the critical load to trigger martensitic transformation in 51Ni and 1Fe.

Based on the thermodynamic model of stress-induced martensitic transformation above the M s temperature, the relation between the critical stress, σ, required to induce martensitic transformation and the test temperature, T, can be described by Clausius–Clapeyron equation, such that Reference Otsuka and Ren30
 $${{{\mathop{\rm d}\nolimits} \sigma } \over {{\mathop{\rm d}\nolimits} T}} = - {{\Delta {H^*}} \over {\varepsilon T}}\quad {\rm{,}}$$
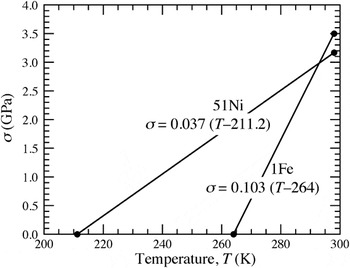
where ΔH* is the enthalpy of transformation per unit volume and ε is the transformation strain. In this study, σ values were evaluated to be 3.17 and 3.50 GPa for 51Ni and 1Fe, respectively, at room temperature (25 °C) as mentioned above. From Table I, the M s temperature for 51Ni and R s temperature for 1Fe are −61.8 and −9.0 °C, respectively. The ε values for 51Ni and 1Fe were assumed to be about the same because both SMAs were stress-induced B19′ martensite. Using Eq. (6) and the above data and assuming a constant slope, the σ–T curves of Clausius–Clapeyron equation can be plotted for 51Ni and 1Fe and are shown in Fig. 5. The slopes of the σ–T curves are calculated to be 0.037 and 0.103, respectively, for 51Ni and 1Fe. In this case, the slope ratio of 1Fe to 51Ni is ∼2.78. The values evaluated from DSC curves were 7.2 and 17.8 J/g, respectively, for 51Ni and 1Fe, and the ratio of 1Fe to 51Ni is ∼2.47, which is similar to the slope ratio.
The plot of Clausius–Clapeyron equation showing the relation between the critical stress, σ, required to induce martensitic transformation and the test temperature, T, for 51Ni and 1Fe.

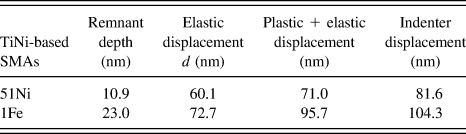
While the remnant displacement after unloading shown in Fig. 3 is the plastic displacement, the indenter displacement calculated from Eq. (5) is the elastic displacement. The plastic, elastic, and total (i.e., plastic + elastic) displacements for nanoindentation loads of 3 mN for 51Ni and 4 mN for 1Fe are listed in Table III. The corresponding measured indenter displacements are also listed in Table III. Compared to the measured indenter displacement, the calculated total displacement is about 10 nm less for both 51Ni and 1Fe. This could be attributed to the fact that the displacement resulting from stress-induced martensitic transformation was not included in calculating the total displacement.
The remnant depth, indenter elastic displacement, calculated total displacement, and measured indenter displacement at the critical load to trigger martensitic transformation in 51Ni and 1Fe.

2. 50Ni
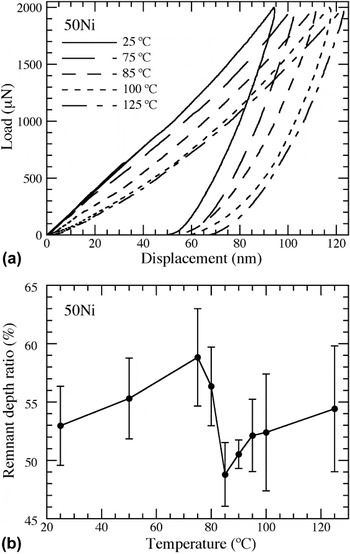
The M f temperature of 50Ni is 34.5 °C that is above the room temperature, and 50Ni is in B19′ martensite at room temperature. Temperature-controlled nanoindentation was performed on 50Ni with a Berkovich probe of 150 nm tip radius and a fixed peak load of 2 mN in the temperature range of 25–125 °C. Based on the load–indent depth curves at various temperatures shown in Fig. 6(a), RDR as a function of the test temperature is shown in Fig. 6(b). RDR increases initially when the temperature increases from room temperature 25 °C to 75 °C and then decreases with the temperature until the temperature reaches ∼85 °C. Afterward, RDR increases again with the temperature. In this case, no stress-induced martensitic transformation is expected when 50Ni is in the martensitic phase. Because the A s temperature is 68.5 °C, no B2 parent phase is expected at temperature below the A s temperature. The initial increase in RDR with temperature shown in Fig. 6(b) results from the elastic–plastic behavior of the material and the plastic deformation contributes to RDR. At 75 °C, which is above the A s temperature, the austenitic transformation and the stress-induced martensitic transformation (i.e., the decreasing RDR) through nanoindentation starts to show in Fig. 6(b). More B2 parent phase are formed as the temperature increases beyond the A s temperature until reaching the A f temperature. When the temperature reaches ∼85 °C, which is close to the A f temperature, the increase in RDR with temperature signifies that the plastic deformation starts to control the deformation mechanism as the ductility increases with the temperature.
(a) Nanoindentation load–indent depth curves at different temperatures and (b) the RDR as a function of the test temperature for 50Ni.

It is worth noting that for nanoindentation performed below the A s temperature, reorientation of martensite variants could occur. Since these reoriented variants did not revert to their original configuration upon unloading, the deformation resulting from reorientation of martensite variants could also contribute to the remnant displacement. It is also worth noting that the drift of the indenter tip is a critical issue at high temperatures. To resolve this issue, the drift rate of the indenter tip before each indentation was measured by the nanoindentation system for 40 s and the displacement data were automatically corrected based on the measured drift rate.
E. Compression of 51Ni and 1Fe micropillars
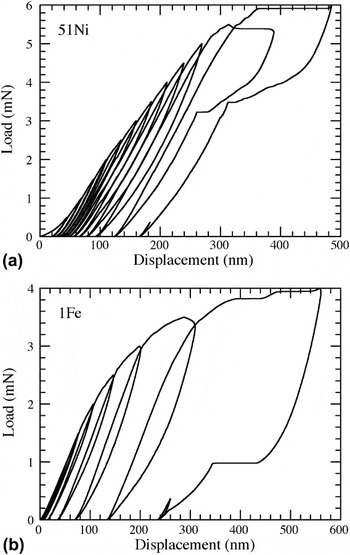
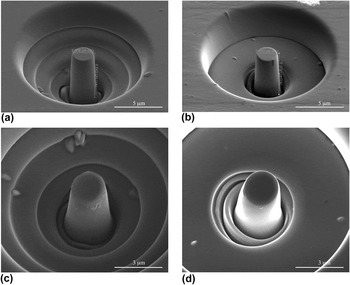
Using the cyclic loading function, the load–displacement curves for microcompression tests performed on 51Ni and 1Fe micropillars with a (111) preferred orientation are shown in Figs. 7(a) and 7(b), respectively. The SEM micrographs of the pillars before the test are shown in Figs. 8(a) and 8(b), respectively, for 51Ni and 1Fe which have a diameter of ∼2 μm and the pillar length to diameter ratio (i.e., the aspect ratio) of ∼3, which has been recommended for microcompression tests. Reference Zhang, Schuster, Wei and Ramesh31 For peak loading below 5 mN, Fig. 7(a) shows no sign of stress-induced martensitic transformation for 51Ni and the remnant displacement after unloading results from the plastic deformation. However, for peak loading of 5.5 mN, a sudden displacement plateau of ∼100 nm displacement can be observed in Fig. 7(a). While the pop-in events due to dislocation motion during incipient plasticity usually have a much smaller displacement of only few nanometers, Reference Schuh, Mason and Lund32 this displacement plateau is the superelastic effect in which the stress-induced martensitic transformation is triggered at a critical load. The load–displacement curve shows a step-like behavior due to the fast nucleation and growth of martensitic variants under stresses. During unloading, martensite becomes unstable and the reverse martensitic transformation takes place with recovery of the displacement as the load decreases to ∼4 mN. However, while the forward martensitic transformation takes place at a fixed load of ∼5.5 mN during loading, the reverse martensitic transformation takes place in the loading range of 4 to 3.2 mN during unloading. This could be attributed to the generation of dislocations during the loading process which inhibit the reverse phase transformation. It is also noted in Fig. 7(a) that during the following loading cycle, a higher load of ∼6 mN is required to trigger stress-induced martensitic transformation. Again, this could be the result of the accumulated dislocations from previous loading cycles to delay the stress-induced phase transformation. Reference Zhang, Somsen, Simon, Ding, Hou, Ren, Ren, Eggeler, Otsuka and Sun25 This increase in loading required to trigger stress-induced martensitic transformation with the loading cycle for pillar compression tests of TiNi SMAs has also been reported elsewhere. Reference Frick, Orso and Arzt15 However, it should be noted that the critical stress for stress-induced martensitic transformation has been found to decrease with the number of cycles in cyclic tensile loading tests of TiNi SMAs. Reference Miyazaki, Imai, Igo and Otsuka33–Reference San Juan and Nó35 It was suggested that the internal stress induced by the residual strain from the previous cycles assisted the stress-induced martensites and, hence, decreased the critical stress. Reference Miyazaki, Imai, Igo and Otsuka33–Reference San Juan and Nó35 The reason for the above two contradictory results is presently unknown.
Load–displacement curves for microcompression tests performed on (a) 51Ni and (b) 1Fe micropillars.

SEM micrographs of micropillar before compression for (a) 51Ni and (b) 1Fe and after compression for (c) 51Ni and (d) 1Fe.

For 1Fe, the similar trend is observed in Fig. 7(b); however, the load–displacement curve shows two plateaus and the stress-induced phase transformation takes place at loading of ∼3.8 and 3.9 mN while the reverse phase transformation takes place at ∼1 mN during unloading. These two plateaus could result from the two-stage B2 → R → B19′ transformation for 1Fe, as shown in Fig. 1(c). Also, a single plateau in the unloading curve shown in Fig. 7(b) could result from the one stage B19′ → B2 reverse transformation shown in Fig. 1(c). Despite the evidence of SE for both 51Ni and 1Fe in micropillar compression tests, large deformation due to plasticity remains after tests. The micrographs of the pillar after tests are shown in Figs. 8(c) and 8(d), respectively, for 51Ni and 1Fe. Compared to Figs. 8(a) and 8(b), buckling of pillars are observed in Figs. 8(c) and 8(d) which shows the plastic deformation of pillars after tests.
During the microcompression test, the pillar can be approximated as being subjected to uniform compression. Using the pillar radius of 1 μm and the critical load for triggering phase transformation of 5.5 mN for 51Ni and 3.8 mN for 1Fe, the calculated critical stresses are 1.75 and 1.21 GPa, respectively, for 51Ni and 1Fe. These values are lower than those obtained from nanoindentation tests. However, it should be noted that while the phase-transformation region in nanoindentation tests is constrained by the surrounding elastic region, the phase transformation can span the entire pillar without constraints in pillar compression tests. Hence, it would be easier to trigger stress-induced martensitic transformation in pillar compression tests compared to nanoindentation tests.
IV. CONCLUSIONS
Three TiNi-based SMAs, Ti49.05Ni50.95 (51Ni), Ti49.49Ni49.71Fe0.8 (1Fe), and Ti49.93Ni50.07 (50Ni), with a diameter of 2 mm were processed which had different austenite finish temperatures of −29.2, 10.0, and 95.1 °C, respectively. The superelastic behavior was characterized using nanoindentation. While both 51Ni and 1Fe SMAs are in B2 parent phase (austenite), 50Ni SMA is in B19′ martensite at room temperature. Nanoindentations performed on 51Ni and 1Fe at room temperature and different peak loads revealed stress-induced martensitic transformation and the superelastic behavior. For 50Ni, nanoindentations were conducted using a fixed peak load at various temperatures. In this case, superelastic behavior was observed when the test temperature was slightly above the austenite starting temperature because of the presence of austenite prior to loading. However, plasticity started to dominate the deformation when the test temperature approached the austenite finish temperature. While SE of TiNi-based SMAs characterized by nanoindentation is localized behavior, we also performed microcompression on 51Ni and 1Fe pillars fabricated by FIB milling to study the global superelastic behavior. When the peak load reached a critical value, the global superelastic behavior was observed. However, our studies also showed that TiNi-based SMAs did not exhibit completely recoverable superelastic behavior and remnant displacement remained after unloading because of the plastic deformation. This plastic deformation of Ti–Ni alloys has also been reported elsewhere, Reference Frick, Orso and Arzt15,Reference Ye, Mishra, Pelton and Minor17 and it would unavoidably degrade the damping capability of Ti–Ni SMAs. Also, compared to the center region of our specimen cut from the SMA wire, the edge region showed higher hardness and negligible SE presumably resulting from work hardening and accumulation of dislocations. The future work will be aimed to prohibit plasticity while to promote SE of TiNi-based SMAs.
ACKNOWLEDGMENTS
This project was jointly supported by National Taiwan University under Contract No. 102R104100 and Contract No. 103R8918 and SI was supported by the Grant-in-Aid for Scientific Research (C) (KAKENHI, No. 13350837) from Japan Society for the Promotion of Science (JSPS).