Introduction
Varietal sorting is an essential part of the quality control process of a seed lot, either in germplasm bank management, production or commercialization, in order to identify its genetic quality and avoid species mixture (Elmasry et al., Reference Elmasry, Mandour, Al-Rajaie, Belin and Rousseau2019). For plant breeding programmes, cultivar discrimination is also crucial to prove the correct crossing between plants, identify superior genotypes and guarantee seed homogeneity according to their minimum descriptors for the purposes of registering new cultivars. For all these purposes, the process of separating seeds by its morphological characteristics, such as colour, texture and shape, requires well-trained analysts and sometimes time-consuming and expensive biochemical and molecular techniques (Hansen et al., Reference Hansen, Hay and Carstensen2016; Zhu et al., Reference Zhu, Zhang, Chao, Xu, Song, Zhang and Huang2020).
Thus, non-destructive, rapid and non-subjective methods are of great interest in determining seed quality (Elmasry et al., Reference Elmasry, Mandour, Al-Rajaie, Belin and Rousseau2019; Xia et al., Reference Xia, Xu, Li, Zhang and Fan2019b). In this regard, multispectral image analysis is a promising alternative that combines spectroscopy with digital imaging. The technique is based on the reflectance of an object – the intensity that a given surface reflects a wavelength. An object can be illuminated by different wavelengths [e.g. visible light, near-infrared (NIR)], and when combined with a digital image, the reflectance of each pixel of this object's image can be measured to differentiate it from another (Boelt et al., Reference Boelt, Shrestha, Salimi, Jørgensen, Nocolaisen and Cartensen2018; Xia et al., Reference Xia, Yang, Huang, Zhu, Guo and Qin2019a,Reference Xia, Xu, Li, Zhang and Fanb).
Since each pixel contains a dataset (reflectance from each wavelength), the result is a large amount of data proportional to the number of wavelengths used and the size of the image. As these data are considered chemical information, the role of chemometrics is to use statistical and mathematical tools to obtain the most important information from the dataset of each object (Amigo, Reference Amigo2020).
Spectral image analysis is considered one of the major emerging technologies in seed analysis and technology. Its versatility, non-destructive characteristics and rapid determination of quality attributes of a seed lot, combined with data science, make it possible to automate the entire seed sorting process (Elmasry et al., Reference Elmasry, Mandour, Al-Rajaie, Belin and Rousseau2019; Xia et al., Reference Xia, Yang, Huang, Zhu, Guo and Qin2019a,Reference Xia, Xu, Li, Zhang and Fanb; Amigo, Reference Amigo2020; Zhou et al., Reference Zhou, Zhang, Taha, Wei, He, Qiu and Liu2020a,Reference Zhou, Huang, Fan, Zhao, Liang and Tianb).
The success in applying the technique lies in combining experimental issues with the process of extracting information from the seeds and the chemometric strategy used, which may include from the choice of classification algorithms to data dimensionality reduction processes. Therefore, the process of choosing each aspect involved in the analysis is not trivial, and thus, this systematic review aims to evaluate the main procedures in terms of spectral imaging analysis and chemometric procedures applied in seed phenotyping as well as its practical application.
Methodology
The study followed the Preferred Reporting Items for Systematic Reviews and Meta-analyses (PRISMA) methodology (Moher et al., Reference Moher, Liberati, Tetzlaff and Altman2009; Page et al., Reference Page, Moher, Bossuyt, Boutron, Hoffmann, Mulrow, Shamseer, Tetzlaff, Akl, Brennan, Chou, Glanville, Grimshaw, Hróbjartsson, Lalu, Li, Loder, Mayo-Wilson, McDonald SmcGuiness, Stewart, Thomas, Tricco, Welch, Whiting and McKenzie2021), as it presents a clear and systematic research method with a focus on reproducibility.
Inclusion and exclusion criteria
The inclusion and exclusion criteria were based on literature type, access, period, language and scope (Table 1). The 15-year period was chosen to limit the search to new papers, given the recent expansion of spectral imaging technology in seed science. Regarding the scope, only papers on spectral imaging analysis (multispectral and hyperspectral) in seeds were considered; thus, papers using material not considered as seeds (i.e. grains) were not considered. Articles using spectral analysis only to quantify chemical components (e.g. oil, protein content) of seeds but did not classify them into different genotypes (e.g. cultivars or varieties) were not considered. Language was considered as a criterion to avoid bias in the translation of non-English language papers.
Inclusion and exclusion criteria

Search methodology
The keywords for the present work, as well as their synonyms, were obtained through prior review in studies related to the areas of seed science and technology and spectroscopy (Table 2). The databases used were the Web of Science Core Collection (WOS) and Scopus and were chosen according to previous research on the number of articles related to the scope present in each one. WOS is the database of Clarivate Analytics and has indexed more than 21,000 papers covering 256 disciplines, while the Scopus database belongs to Elsevier and is one of the most related to plant science with peer-reviewed articles. In addition to covering a large quantity of articles related to the topic, these databases allow the inclusion of Boolean operators for the search strategy, as well as symbols that allow the inclusion of all possible terms with the same root.
The search strategy used for the systematic review process

The search consisted of three steps: identification of potential articles, screening, and inclusion of articles (Fig. 1). A total of 1304 articles were identified and duplicates were removed with the aid of the Mendeley Reference Manager management programme (Dearden et al., Reference Dearden, Kowalski, Lowe, Roland, Surridge, Thomas and Jones2011). A total of 308 articles were eliminated based on their characteristics as per the exclusion criteria, while 508 articles were excluded as per the scope from the evaluation of the title and abstract. A total of 60 articles were evaluated in full and 44 were included in the review.
Selection of articles according to the PRISMA framework.

Statistical analysis
From the articles evaluated, data were collected regarding the experiment, the best classification model obtained in each study, as well as other information deemed relevant (Table 3), to identify possible factors influencing the accuracy of seed classification through spectral imaging analysis. A multiple generalized linear regression model with gamma distribution and log-link function was used, due to the non-normality of the data, in conjunction with the stepwise feature selection algorithm (backward and forward) to select the final model. The algorithm adds and removes features and compares the models by means of Akaike's Selection Criterion (AIC), in order to obtain a final model with the feature (or the combination of features) best-fitted (with the lowest AIC value) to predict the accuracy of spectral imaging analysis applied to seed phenotyping.
Features that might affect the accuracy of seed distinction in spectral analysis applied to seed phenotyping

Results and applications
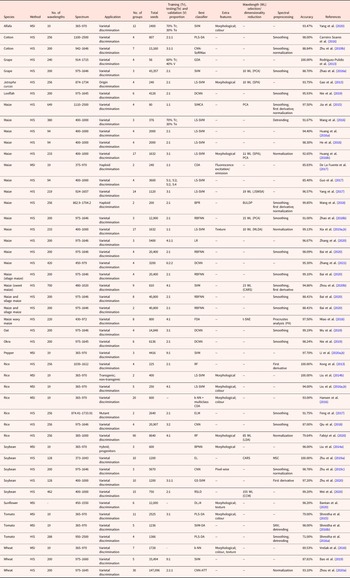
A total of 44 articles from the systematic review were included; since the authors reported more than one experiment in some papers, data from all the experiments performed were listed, including data from the best-performing classification model (Table 4).
Characteristics and applications of spectral imaging (HIS – hyperspectral imaging; MSI – multispectral imaging) applied in seed phenotyping

Accuracy, data splitting and validation methods
The average accuracy of the reviewed studies (considering all experiments listed in Table 4) was 93.33% (±7.07%). In some studies, the application of spectral image analysis resulted in 100% classification accuracy, as in Zhu et al. (Reference Zhu, Chao, Zhang, Xu, Song, Zhang and Huang2019a), on 10 soybean seed varieties using the Ensemble Learning classification algorithm. A similar result was found for Liu et al. (Reference Liu, Liu, Lu, Chen, Yang and Zheng2014b), whose study on transgenic and non-transgenic rice seeds, by means of the Least-squares support vector machine (LS-SVM) algorithm, used both spectral information and biometric data regarding seed morphology. It was also the case of the study of Kong et al. (Reference Kong, Zhang, Liu, Nie and He2013) on four rice seed varieties, using the Random Forest (RF) algorithm, and the study of Rodríguez-Pulido et al. (Reference Rodríguez-Pulido, Barbin, Sun, Gordillo, González-Miret and Heredia2013), which separated four grape varieties using general discriminant analysis (GDA).
Their high accuracy suggests a promising feature of spectral image analysis in distinguishing genotypes, but there are some concerns. The first is about the amount of classification groups: only 46 and 23% of the experiments had more than 5 and 10 categories, respectively. In works that used many categories, for example, Fabiyi et al. (Reference Fabiyi, Vu, Tachtatzis, Murray, Harle, Dao, Andonovic, Ren and Marshall2020), with 90 cultivars, although the overall accuracy was relatively high (79.64%) using the RF algorithm, for some cultivars accuracy was only 30–50%. The same result was found in the study of Zhou et al. (Reference Zhou, Zhang, Taha, Wei, He, Qiu and Liu2020a), in which the overall accuracy was 93.10% using a deep learning algorithm (convolutional neural network – CNN) for the classification of 30 cultivars, while there was a variation of more than 20% in classification accuracy for certain cultivars.
It is not clear, in most of the reviewed papers, if spectral image analysis was applied owing to its agility and automation or because of the ability to classify cultivars in situations in which classification by visual morphological characteristics was not possible. This point is important because knowing whether the genotypes were chosen randomly or whether they were chosen arbitrarily from characteristics where separation would be possible even by eye allows one to establish to what extent spectral image analysis is applicable in situations of cultivar diversity, as occurs in the seed industry.
Another point of concern is test and validation data: in most works, there was (1) the absence of test data and (2) the absence of test and/or validation lots (e.g. seeds from other harvests). Ideally, when enough data are available, seed samples should be divided into training, validation and test data. Training data are used by the algorithm to estimate the model; validation data are not to be used in training, in order to gather unbiased information about the quality of the models developed. Validation data are used for predicting errors in each model for the purpose of selecting the best model. Since validation data are used constantly (depending on the number of models to be tested), test data (i.e. data not yet used) are commonly used to obtain the true error of the final model (i.e. generalization error), and these data are used only once so as not to overestimate accuracy (Hastie et al., Reference Hastie, Tibshirani and Friedman2017).
In most works of the present review, despite the large number of seeds being used, test data were not used – only validation data (even when it was referred to as test data in the studies, owing to different definitions), which may lead to high accuracy. In studies with a small number of seeds, an alternative is to use cross-validation, in which samples go through n data splitting cycles (in training and validation), model building and error computation, and final accuracy is determined from the average error of the n models obtained (Hastie et al., Reference Hastie, Tibshirani and Friedman2017). However, of the experiments that used approximately less than 100 seeds per classification category (referring to the first quartile of the variable number of seeds in Table 4), 37% did not perform cross-validation, which may cause overestimation of the resulting accuracy.
Another aspect regarding data division is that only 6% of the studies used validation and/or test lots (i.e. from other harvests and/or regions). In the works that did not use validation lots, high accuracy may have been due to a model overfitted to the lot; consequently, there may not be such accuracy in the classification of the same cultivars from other harvests and regions (He et al., Reference He, Zhu, Huang and Mendoza2016; Huang et al., Reference Huang, Tang, Yang and Zhu2016a). For example, Huang et al. (Reference Huang, Tang, Yang and Zhu2016a), when classifying seeds of four wheat varieties and using – as test data – seeds from the same year as those used for training, found 100% classification accuracy using the LS-SVM algorithm. However, when using seeds from other years, accuracy was only 75.4%. Similarly, Shrestha et al. (Reference Shrestha, Knapič, Žibrat, Deleuran and Gislum2016a) used tomato seeds of four cultivars from three harvest years, in experiments with seeds only from the same year and with the mixture of seeds from the other years, both in the test and training data. For the fitted and validated models with seeds from the same year, they found accuracy per cultivar from 73 to 100%, whereas for the sample with mixed seeds from other harvests, accuracy ranged from 34 to 88%.
There was a great variation in the total number of seeds used per classified genotype, as observed in each experiment, even in those that used the same species. For example, in the works performed on wheat seeds, the number of seeds used per class ranged from 20 to 5100 seeds. Few of the reviewed studies evaluated the influence of seed quantity on training samples. For instance, Qiu et al. (Reference Qiu, Chen, Zhao, Zhu, He and Zhang2018) tested training samples with different amounts for designing their classification models, ranging from 100 to 3000 seeds, for each of the four cultivars. They found when using more than 1500 seeds, the increment in accuracy was not significant. Certainly, the accuracy determined in experiments that used larger samples leads to more confidence, but the approach of studying the ideal number of seeds has more practical applicability, since the increase in the amount of samples generates extra processing costs, without necessarily leading to a significant increase in the accuracy of the models. Thus, stipulating the optimal number of seeds is important to achieve a balance between the cost and performance of a model, which would, thus, facilitate the applicability of the analysis (Qiu et al., Reference Qiu, Chen, Zhao, Zhu, He and Zhang2018).
One way to obtain more data without necessarily increasing the number of seeds in a sample is by using the spectral information of each seed pixel (i.e. pixel-wise spectrum), as opposed to averaging the seed spectrum (i.e. object-wise), as evaluated by Zhu et al. (Reference Zhu, Zhou, Zhang, Bao, Wu, Chu, Yu, He and Feng2019c) in classifying three soybean cultivars. The authors used the pixel-wise spectrum of 60 seeds and reported the equivalent performance of a sample with 810 seeds using object-wise spectrum. However, this technique requires a great deal of data processing, as there is a significant increase in the amount of information (i.e. equivalent to the number of pixels). Moreover, it also needs to be explored in different situations (e.g. species, cultivars, crops).
Crop-type application
Out of the 44 articles evaluated, approximately 80% performed an analysis of agricultural crops species (e.g. soybean, maize, wheat), 11% of horticultural seeds, 5% of fruit production and 5% of other classes (pasture and medicinal plants), while there was no work on forest seeds (Fig. 2).
Species used in each article of the review.

As with the present study, Rahman and Cho (Reference Rahman and Cho2016), in a narrative review with 32 papers that applied seed variety identification using image analysis techniques, 31 focused on agricultural crops. Given the emerging feature of the spectral imaging analysis technique in seed phenotyping, the use of it in agricultural crop seeds over other seeds may be mainly linked to the economic appeal of these species, as well as to the greater number of plant breeding programmes related to them.
Wavelength spectrum
Of the evaluated studies, 75% used hyperspectral equipment, and according to the density plot, the frequency distribution of the wavelengths applied in the studies varies according to the type of equipment (Fig. 3). Commercial hyperspectral equipment operates in bands with greater amplitude in the NIR spectrum (750–2500 nm), whereas commercial multispectral imaging equipment concentrates on the visible light range up to the beginning of the NIR (350–950 nm).
Density plot of the wavelengths used according to the hyperspectral (HIS) or multispectral (MSI) method.

The wavelength range used is closely linked with the components measured in the seeds, and the visible spectrum is related to superficial characteristics, such as pigmentation (e.g. flavonoids, carotenoids, chlorophyll) and oxidation. These characteristics are ideal for distinguishing seeds with marked physical characteristics, for example, tegument colour or texture. As regards the NIR spectrum, this region is sensitive to the molecular overtone of hydrogen-containing groups, such as C–H, N–H, O–H chemical bonds, which represent seed starch, protein and oil contents, and can penetrate deeper than visible light through the subsurface layer of seed coat (Rodríguez-Pulido et al., Reference Rodríguez-Pulido, Barbin, Sun, Gordillo, González-Miret and Heredia2013; Li et al., Reference Li, Zhang and Huang2014, Reference Li, Jiang, Cao and Zhang2020a; Mortensen et al., Reference Mortensen, Gislum, Jørgensen and Boelt2021). For works that used hyperspectral cameras, there was a peak near the 1000 nm range. In this range, the 1122, 1200 and 1314 nm bands (related to organic C–H compounds, such as starch) stand out, while the 1402 nm wavelength is associated with the O–H region of carboxylic acids, as well as regions near the 1580 nm band (Osborne and Douglas, Reference Osborne and Douglas1981; Lammertyn et al., Reference Lammertyn, Nicolai, Ooms, De Smedt and De Baerdemaeker1998; Serranti et al., Reference Serranti, Cesare, Marini and Bonifazi2013; Zhao et al., Reference Zhao, Guo, Wei and Zhang2014).
Shrestha et al. (Reference Shrestha, Knapič, Žibrat, Deleuran and Gislum2016a), using hyperspectral image analysis in the NIR region for the classification of four tomato seed varieties, found that the 1417, 1901, 2102 and 2238 nm bands, associated with protein and water content, and the 1222 and 1695 nm bands, associated with fatty acid content, represent an important spectral signature for this species. Rodríguez-Pulido et al. (Reference Rodríguez-Pulido, Barbin, Sun, Gordillo, González-Miret and Heredia2013), when separating seeds of three grape cultivars, with one coming from two different regions, using the principal component analysis (PCA) score, found that the bands at 928, 940, 1148, 1620 and 1652 nm, referring to organic compounds with C–H chemical bonds, were primarily responsible for distinguishing the seeds. Zhao et al. (Reference Zhao, Zhu, Zhang, Feng, Feng and He2018b), based on the score of the first six principal components of PCA, selected the bands in the 1100 and 1390 nm region and the bands at 1436, 1453 and 1554 nm (with the latter three corresponding to the first overtone of O–H stretching, to classify grape seeds of three cultivars). Zhang et al. (Reference Zhang, Dai and Cheng2021), using multispectral equipment and classifying four maize cultivars, found that the wavelength bands with the greatest contribution to the distinction of cultivars were 450–700 nm, related to the chlorophyll and β-carotene content of the endosperm, 730 and 785 nm, related to organic compounds with O–H and N–H bonding, and 850–950 nm, related to C–H hydrocarbons. Huang et al. (Reference Huang, He, Zhu and Qin2016b) found 92.65% accuracy when they classified 17 corn cultivars, using 11 wavelengths selected by the Successive Projection Algorithm (SPA), located in the 500–750 nm region, which are sensitive to seed starch and oil contents. Similarly, Xia et al. (Reference Xia, Yang, Huang, Zhu, Guo and Qin2019a) classified 17 corn cultivars based on 10 optimal wavelengths, belonging to the regions of 410–470 nm, 524–790 and the wavelength of 988 nm, which represent seed texture, starch and oil content, and water content, respectively.
Thus, since the NIR region is sensitive to organic compounds in seeds in deeper layers than visible light, this region seems to be a good strategy to differentiate seeds with similar surface characteristics (i.e. where the visible spectrum region acts more intensely) (Williams and Norris, Reference Williams and Norris2001; Rodríguez-Pulido et al., Reference Rodríguez-Pulido, Barbin, Sun, Gordillo, González-Miret and Heredia2013). For example, Wang et al. (Reference Wang, Lv, Liu, Wei, Zhang, An and Wu2018) separated haploid from diploid maize seeds, whose visual similarity makes it difficult to separate them by traditional or machine vision methods. Using hyperspectral image analysis in the NIR region (860–1700 nm), they were able to identify differences in oil content and other organic components, differentiating the seeds with 99.85% accuracy.
As for the equipment, the basic difference between multispectral and hyperspectral devices is in the number of wavelengths that each one can measure. Multispectral equipment measures up to 20 wavelengths, while hyperspectral cameras can reach higher values, as reported in the work of Zhou et al. (Reference Zhou, Huang, Fan, Zhao, Liang and Tian2020b) with sweet corn and 700 wavelengths measured. The use of hyperspectral equipment results in a larger amount of data and, consequently, more time for processing and development of the classifier models. Therefore, all the studies that performed some form of wavelength selection or dimensionality reduction used hyperspectral equipment. Dimensionality reduction aims to mitigate the problem of correlation between predictor variables and model overfitting (Wu et al., Reference Wu, Zhang, Na, Mi, Zhu, He and Zhang2019; Amigo, Reference Amigo2020). For example, Gao et al. (Reference Gao, Li, Zhu and He2013) used SPA to reduce from 256 to 10 wavelengths and obtained 93.75% accuracy.
Classifiers
For seed classification based on the selected wavelength and other features, the evaluated papers used machine learning and deep learning class algorithms on 30 and 17 occasions, respectively; in 2017, the percentage of papers that used machine learning was 95% (Fig. 4).
Proportion and absolute quantity (number in square) of the classification algorithm classes used in each paper over the years.

In 2018 and later, the number of papers using deep learning not only increased but was proportionally higher than the number of papers using machine learning. Deep learning is an unsupervised classification method (the class of seeds is not previously provided to the algorithm) and brings the advantage of identifying abstract patterns in a large amount of data that supervised methods would not be able to find (i.e. deep features) (Gheisari et al., Reference Gheisari, Wang and Bhuiyan2017; Wu et al., Reference Wu, Zhang, Na, Mi, Zhu, He and Zhang2019). However, to achieve successful classification, deep learning algorithms preferentially need a larger volume of data, and this is represented in the average number of seeds used in the evaluated papers that applied machine learning: 3897, compared to 22,765 in deep learning.
The larger the amount of data, the greater the demand for technology and processing time, which may be linked to the low frequency of use of deep learning in previous studies. In contrast to processing time, this class of algorithms seems to be more advantageous in seed classification as highlighted by Zhu et al. (Reference Zhu, Zhang, Chao, Xu, Song, Zhang and Huang2020), who found that all tested deep learning algorithms had higher accuracy than machine learning algorithms. Similarly, Qiu et al. (Reference Qiu, Chen, Zhao, Zhu, He and Zhang2018), comparing the deep learning algorithm CNN with the machine learning algorithms SVM and K-nearest neighbour (K-NN), found that, as the training samples increased, the CNN model outperformed the others. Nie et al. (Reference Nie, Zhang, Feng, Yu and He2019), when classifying hybrid okra and loofah seeds using the deep learning model deep CNN (DCNN) and comparing it to partial least-square discriminant analysis (PLS-DA) and SVM, found that the number of varieties increased from two to six. The authors reported that with increased complexity (number of varieties), the accuracy of the DCNN model remains more stable than that of the others.
Thus, the main advantage of using deep learning algorithms lies in their ability to integrate the steps of feature learning, feature extraction, dimensionality reduction and classification into just one system, which brings greater convenience in the use of data with more complexity (i.e. a larger number of features), as occurs when hyperspectral images are used (Wu et al., Reference Wu, Zhang, Na, Mi, Zhu, He and Zhang2019).
Chemometric features
The adjusted model, which was identified by the stepwise algorithm with the lowest AIC (−07.9015), used the following features: number of seeds, seed classification groups and use of methods for wavelength selection and/or data dimensionality reduction. Only the first feature was significant (Table 5). According to the estimated and exponentialized coefficient (to reverse the logarithmic scale) of the number of groups (0.998), as the number of seed classification groups increases, the final model accuracy tends to decrease by approximately 0.2% with each new group.
Coefficients estimated from the adjusted model identified by the stepwise algorithm with the features that may influence the accuracy of the spectral imaging analysis of the evaluated studies

a Papers that used wavelength selection or dimensionality reduction procedure to obtain the most accurate model.
Classification accuracy tends to naturally decrease as the number of possible groups increases, but the non-significant influence of the other factors is due to the fact that the technique can result in high classification models using different strategies in the process (e.g. method, feature selection, preprocessing), that is, an isolated factor is not enough to determine the accuracy of an analysis. It must be clear that the final model only indicates a possible relationship between the variables, since other factors not listed may be relevant to determine classification accuracy (e.g. species, seed quality); moreover, further research is needed to make a robust analysis.
Discussion
Overall strengths
In the 44 evaluated studies, it was clear that the information collected through spectral image analysis, both reflectance and biometric measures of morphology and texture, are sufficient to classify seeds of different genotypes. Although one needs to further explore the ability to generalize the use of the analysis between seeds from other regions and/or harvests, as well as make different combinations of genotypes in future work, the fact is that well-fitted classification models have high accuracy in several situations: between cultivars, hybrids and progenitors, and hybrids and lines; transgenic and non-transgenic seeds.
Spectral image analysis allows the separation of genotypes even in coated seeds, mainly by using the NIR, which penetrates beyond the surface of the seed. Coated seeds are common in the industry, as coating provides protection against fungi and microorganisms, and aids germination by supplying nutrients and amino acids, among other benefits. In the case of these treated seeds, even when dyes are applied for identification, classification using spectral image analysis has still proved possible (Jia et al., Reference Jia, An, Liu, Gu, Li, Zhang, Zhu, Guo and Yan2015; Zhang et al., Reference Zhang, Zhao, Yan, Bai, Xiao, Gao, Li, Huang, Bao, He and Liu2020). However, for small and/or non-uniform seeds, which are coated with thicker layers (which occurs by the encrustation or pelleting process), the analysis may not be applicable.
Reflectance offers sufficient information for the separation of the seeds of different genotypes, and spectral information can be collected quickly, through an image or set of images according to the number of bands measured; seeds remain intact and there is no need for prior treatment. Therefore, multispectral image analysis has a huge advantage over conventional tests, because its limitations refer to treatment and processing of data rather than data collection. Traditional methods, such as molecular markers, are indeed highly reliable, robust methods; thus, they can hardly be replaced. However, in routine work in seed analysis laboratories, when identifying hybrid seeds in breeding programmes or in identifying cultivar mixtures in purity testing, traditional methods are not necessary if there is an alternative way that is reliable, fast and agile enough to meet the industry's demands (Shrestha et al., Reference Shrestha, Deleuran, Olesen and Gislum2015; Bao et al., Reference Bao, Mi, Wu, Liu and He2019; Zhang et al., Reference Zhang, Zhao, Yan, Bai, Xiao, Gao, Li, Huang, Bao, He and Liu2020).
Challenges and limitations
Phenotypic variation
The main challenge of the spectral image analysis technique applied to seed phenotyping surely lies in the extrapolation of the fitted model to seeds coming from other harvests/regions (Zhu et al., Reference Zhu, Zhang, Chao, Xu, Song, Zhang and Huang2020). The development of a prediction model is somewhat difficult and laborious and requires professionals specialized in data analysis. In the process, seeds need to be used to train the proposed model, test different forms of data processing and validate the model with new seeds. This is time-consuming and not easily adapted to the work routine in seed-producing companies. Thus, the model created to classify produced cultivars must be able to classify seeds over the years and also those grown in different regions (He et al., Reference He, Zhu, Huang and Mendoza2016).
When it comes to biological data, there is great variation among seeds from different years and regions, since morphophysiological characteristics are highly affected by climate, soil, parent plant characteristics, among other factors. Importantly, the biometric data obtained by spectral image analysis are sensitive to morphophysiological characteristics (e.g. pigmentation and organic compounds); therefore, variations in the characteristics of cultivars obtained in other harvests may be enough to misclassify them (Shrestha et al., Reference Shrestha, Knapič, Žibrat, Deleuran and Gislum2016a,Reference Shrestha, Deleuran and Gislumb).
The intensity of phenotypic influence varies with species and the characteristics used for the classification of cultivars. For some species, there are cultivars with outstanding characteristics that facilitate differentiation, as is the case with the tegument colour of bean seeds or peanut seeds. However, in many species, with subtle differences among cultivars, the influence on phenotypic variation can be a problem. For example, in some maize cultivars, the balance between sugar and amylopectin, which can be used as a spectral marker, can be affected by variations in water content in the seed from different regions, which can influence classification (Wang et al., Reference Wang, Sun, Pu and Zhu2016).
An alternative would be to use seeds from cultivars from other years and/or regions to train the classification model, but this poses some difficulties. The first is to obtain a sufficient number of seeds from other years and/or regions, since a large volume of samples is needed to overcome the effect of location. In addition, the use of seeds from a seed bank or archive samples, which were stored in different periods, could influence the classification of newly harvested seeds (Shrestha et al., Reference Shrestha, Knapič, Žibrat, Deleuran and Gislum2016a,Reference Shrestha, Deleuran and Gislumb).
Some studies suggest the use of model updating, which seems to be a promising alternative. In this method, the original model, previously prepared using seeds from the same harvest, is updated with seeds from the following harvests, in order to have a more accurate model, without the need to perform the whole process of adjusting a new model. Some studies show a 10–35% increase in overall accuracy when classifying cultivars coming from other years, when compared to a non-updated model (Guo et al., Reference Guo, Zhu, Huang, Guo and Qin2017; He et al., Reference He, Zhu, Huang and Mendoza2016; Huang et al., Reference Huang, Tang, Yang and Zhu2016a). Such a practice would partly solve the model portability problem; however, most model updating methods need to be updated with previously classified seeds, which requires time for sampling and classification. An alternative to updating the model is through semi-supervised classification algorithms that use the pre-label approach, that is, they use the original model to classify a new seed sample (from another year) based on retraining the model with seeds classified with a high degree of confidence. However, these methods still need to be evaluated for different species and situations (Guo et al., Reference Guo, Zhu, Huang, Guo and Qin2017).
Seed coat influence
The external structures of the seeds can cause a great influence on the analysis, either by using the visible spectrum, which is sensitive to their surface characteristics, or by using the NIR spectrum, which can penetrate the subsurface layer and is sensitive to the organic compounds present in these structures, for example, the bands of 1180 and 1470 nm, which are sensitive to the presence of lignin and fibre, commonly present in the seed coat of several species. Thus, among species whose external structures are the same, as occurs in palea and lemma in hybrid and self-pollinating cereals, the influence of these structures can be a limiting factor (Blackwell et al., Reference Blackwell, Cael and Koenig1977; Gao et al., Reference Gao, Li, Zhu and He2013; Feng et al., Reference Feng, Peng, Chen, Liu, Feng and He2017; Caporaso et al., Reference Caporaso, Whitworth and Fisk2021).
Thus, when it comes to the differentiation of genotypes that present external structures without enough distinguishing characteristics, the use of spectral imaging is not the best choice, since it would merely describe the composition of these structures. For this type of seed, processing would be necessary, but the commercial use of spectral image analysis requires processing, which leads to extra costs and is time-consuming. In addition, the removal of the husk in cereal seeds limits their use of them, since the husk has an important protective function against fungi and insects (Abebe et al., Reference Abebe, Skadsen and Kaeppler2004; Mortensen et al., Reference Mortensen, Gislum, Jørgensen and Boelt2021).
Seed orientation
The area exposed to the analysis may influence classification accuracy, given the sensitivity of the spectra used by the analysis to seed surface and subsurface compounds. The influence of orientation was reported in work using models fitted with measurements obtained from corn caryopses with the embryo facing up and the face facing down. The endosperm and the embryo have different compositions; therefore, choosing between the face of the caryopsis that has both structures (i.e. the face in which the embryo is facing up) or the face with only the endosperm can influence one's ability to distinguish different genotypes. The influence of orientation can vary across genotypes, and in the case of differentiation between cultivars, there was an average variation of 10% (Miao et al., Reference Miao, Zhuang, Tang, He, Chu and Luo2018; Tang et al., Reference Tang, Cheng, Miao, Zhuang, Hou, He, Chu and Luo2020). Sorting seeds with a certain orientation is a laborious job; therefore, when seed orientation plays a role but does not impair genotype differentiation, loss of accuracy can be accepted.
However, when the difference between genotypes is found in the embryo, as occurs between haploid and diploid maize caryopses, and separation is performed in breeding programmes of the species for different purposes, seed orientation is essential. Thus, seed orientation can be a limiting factor when it comes to haploid seed identification if there is no processing before the analysis is performed; however, on a large scale, processing the seeds may be impractical (De La Fuente et al., Reference De La Fuente, Carstensen, Edberg and Lü bberstedt2017; Wang et al., Reference Wang, Lv, Liu, Wei, Zhang, An and Wu2018).
Specificity
Unlike other techniques, such as molecular markers, in which we can state with great certainty that a seed belongs to a particular genotype from a segment of its genetic code, in spectral image analysis we cannot use reflectance as an absolute marker of species/cultivar, because it is influenced by seed composition. In other words, to identify an unknown seed, it must always come from a sample in which all the possible classifications are known, which were previously defined considering lot-specific issues (e.g. harvest, year, storage). This is not a major limitation in a seed-producing company, where the cultivars produced are known, but in situations when one must identify possible seeds and/or adulterants from an unknown sample, the use of spectral image analysis is impractical.
Adulterant genotypes can be identified in a seed lot when this genotype is commonly used in the trade of adulterated species. In this case, spectral image analysis tends to have good applicability, as the marked difference among species allows a model fitted to a particular variety or crop of the adulterated species to be distinguished with some ease from the adulterant species, as reported by Faqeerzada et al. (Reference Faqeerzada, Perez, Lohumi, Lee, Kim, Wakholi, Joshi and Cho2020) in separating seeds of two varieties of almonds from adulterant apricot seeds.
Perspectives
Open database and key wavelength
There has been increased interest in sharing the data collected through spectral image analysis – be it reflectance or biometric data regarding morphological characteristics of the seeds of the species used in the experiments (e.g. diameter, texture) – through online repositories. Data sharing can leverage the use of the analysis by directly allowing researchers to (1) test different chemometric techniques (e.g. preprocessing, classifier algorithms) on real data, without the need to perform a new experiment, and (2) more accurately identify key bands in certain species and cultivars when comparing different experiments.
The identification of key bands would help in the transition from hyperspectral equipment to multispectral equipment with more accurate and relevant bands in seed phenotyping. Hyperspectral equipment can measure many bands. However, many of these bands contain redundant or unnecessary information for the classification of most species; in addition, hyperspectral equipment is very expensive and more difficult to handle, since the reflectance of the various wavelengths is usually obtained by the point-by-point or the line-by-line system, in which the object moves and reflectance is obtained for every pixel or line of pixels at a time, making the process more time-consuming (Jaillais et al., Reference Jaillais, Roumet, Pinson-Gadais and Bertrand2015; Zhou et al., Reference Zhou, Zhang, Taha, Wei, He, Qiu and Liu2020a).
Thus, the migration to multispectral equipment seems to be the most obvious trend, since it requires fewer wavelengths that are applied to all pixels of the image at once, and it is more agile and suitable for application in the seed industry, especially in sectors that work with large numbers of cultivars and lots. A fast identification system is essential, especially in real time, and multispectral equipment is ideal for this purpose (Elmasry et al., Reference Elmasry, Mandour, Al-Rajaie, Belin and Rousseau2019).
However, in order to efficiently develop multispectral equipment with key wavelengths, a deeper understanding is needed for the interaction of the different wavelengths with the organic compounds of the different evaluated genotypes. To this end, an open database would facilitate such understanding (Elmasry et al., Reference Elmasry, Mandour, Al-Rajaie, Belin and Rousseau2019). Some technologies greatly benefit from an open database, for example, to share data from Raman spectrometry and X-ray diffraction, which can be combined to identify different materials (Mendili et al., Reference Mendili, Vaitkus, Merkys, Grazulis, Chateigner, Mathevet, Gascoin, Petit, Bardeau, Zanatta, Secchi, Mariotto, Kumar, Cassetta, Lutterotti, Borovin, Orberger, Simon, Hehlen and Le Guen2019). Naturally, when it comes to seeds, external factors have a great influence on the analysis (e.g. environment, parent plant) and consequently on their ability to be distinguished. However, with a large amount of data, one can identify relevant patterns between genotypes and at least direct the development of equipment, even if specific to certain species, to obtain a system capable of providing sufficient information for decision-making in accepting or rejecting a seed lot, which would save a great deal of time and money (Elmasry et al., Reference Elmasry, Mandour, Al-Rajaie, Belin and Rousseau2019; Xia et al., Reference Xia, Yang, Huang, Zhu, Guo and Qin2019a,Reference Xia, Xu, Li, Zhang and Fanb).
Field of application
One of the areas where spectral image analysis presents great potential is in breeding programmes, especially in the production of hybrid seeds. Differentiating hybrid seeds from seeds generated by unwanted pollination, either from their parents or from self-pollination, is indispensable. This means differentiating between a few classes from samples with high genetic purity and coming from areas with production control and, thus with less variability among seeds, which is ideal for applying spectral analysis (Nie et al., Reference Nie, Zhang, Feng, Yu and He2019).
Forest species, for example, have a great lack of quality control methods. For species with great economic importance, such as the species of the genus Eucalyptus spp., the use of seeds is especially important in breeding programmes for the production of hybrids. The correct hybridization must be confirmed, given the difficulties of controlling pollination, either in indoor orchards or in the field. Thus, spectral image analysis has great potential to meet this need and bring great advances to forest improvement programmes (Ribeiro-Oliveira and Ranal, Reference Ribeiro-Oliveira and Ranal2014).
Another relevant point that makes spectral image analysis an important tool in breeding programmes is that images show individual morphological features of seeds, since the analysis allows the collection of both reflectance and spatial biometric data. The use of morphological features is especially important to check the homogeneity of seed morphological descriptors, because morphology is an attribute relatively unaffected by environmental issues and could be used to evaluate the genetic quality of a lot, which decreases with every generation (Mortensen et al., Reference Mortensen, Gislum, Jørgensen and Boelt2021).
Online and real-time sorting systems
Probably the most promising aspect of spectral image analysis is the possibility of integration with an online system that allows real-time estimation of the quality of a seed lot. According to the International Seed Testing Association (ISTA, 2020), a certain amount of mixing of other cultivars is allowed in a seed lot. This is evaluated through purity analysis; however, there is great difficulty in determining the presence of other cultivars mixed in a lot in certain species, since the analysis depends on the analysts experience and their ability to identify cultivars by eye (Elmasry et al., Reference Elmasry, Mandour, Al-Rajaie, Belin and Rousseau2019).
Although each company presents a specific situation (i.e. different combinations of genotypes, number of genotypes, presence of different years and/or regions) and it is not clear to what extent spectral image analysis can handle these different situations, the fact is that in the studies identified in the present review, the analysis was effective. This means that, at least in certain situations, the analysis could be integrated into a system to estimate the genetic quality of a seed lot, since the alternative way (i.e. through purity analysis) is extremely laborious and, in many situations, impractical (Elmasry et al., Reference Elmasry, Mandour, Al-Rajaie, Belin and Rousseau2019).
Some researchers, such as Faqeerzada et al. (Reference Faqeerzada, Perez, Lohumi, Lee, Kim, Wakholi, Joshi and Cho2020), reported the feasibility of an online system for real-time classification of seeds moved by a conveyor belt, in which the classification model previously adjusted using hyperspectral images in the infrared region was transferred to an online system. However, some problems still need to be overcome; for example, the speed of the conveyor belt, the variation in light, the overlapping of the seeds on the belt, among other points described by the authors.
Several studies have shown that the models developed from spectral information of seeds are robust enough for large-scale application of the analysis in real-time seed phenotyping through the design of classification maps. In this way, the seeds are determined in real time as to the probability of belonging to a certain class based on the colour scale stipulated for each class. This approach enables decision-making by the analyst and would act as a powerful tool to differentiate cultivars that would hardly be identified with the naked eye (Wang et al., Reference Wang, Sun, Pu and Zhu2016; Zhao et al., Reference Zhao, Zhang, Zhu, Gao, Feng and He2018a, Reference Zhao, Zhu, Zhang, Feng, Feng and Heb; Zhang et al., Reference Zhang, Dai and Cheng2021).
Conclusions
The present review evaluated 44 papers that applied spectral image analysis in seed phenotyping; they were selected among 1304 papers identified in the main journal databases. The review sought to identify the main characteristics of the experiments described in the published papers, as well as to guide researchers in the choice of strategies for experimental design and data analysis, since there are many ways to obtain a highly accurate classification model. Thus, after analysing the papers, the following points summarize the main findings:
• All the evaluated studies presented satisfactory final accuracy; however, few used test data, as well as test and/or validation lots, which may have contributed to the high accuracy reported.
• As the application of multispectral analysis is relatively new in seed phenotyping, the works are still focused on agricultural species with a greater economic appeal.
• Most studies have focused on the use of hyperspectral equipment, which works mainly in the NIR region and is sensitive to seed organic compounds and able to penetrate the subsurface layer. The use of the NIR region seems to be a good strategy to identify differences between genotypes with similar surface structures, where visible light acts with greater intensity.
• The use of deep learning algorithms has been a trend in recent years, mostly because of its ability to work with more complex data, for example, data collected by using hyperspectral cameras.
• Reflectance and biometric data on seed morphology provide sufficient information to separate different genotypes in several situations: among cultivars; hybrids and progenitors; and hybrids and lines, as well as in the separation of coated seeds.
• The main challenge of the analysis is certainly the phenotypic variation of the seeds, which implies the difficulty of using the adjusted model in the classification of cultivars from other harvest, years and/or regions. The main limitations refer to the sensitivity of reflectance to seed compounds, which are highly influenced by environmental issues; the influence of seed coat on the classification of genotypes with similar external characteristics and the influence of seed orientation when the information needed for classification is on a certain face of the seed (e.g. face with the embryo).
Thus, the present review allowed a critical analysis of the use of spectral imaging in seed phenotyping, as well as a thorough evaluation of the limitations of this method. The practical application of this technique needs to be developed for use in laboratories with large volumes of analyses, lots, genotypes and harvests. However, research has been accelerated to overcome the practical challenges of this method, as seen in work using model update algorithms, online classification systems, real-time classification maps; also, spectral information of genotypes is being shared through online repositories. Thus, there are strong indications that the application of multispectral image analysis will become a part of the routine of seed analysis laboratories.
Acknowledgements
The authors thank the Coordination for the Improvement of Higher Education Personnel (CAPES) for granting the scholarships.
Conflicts of interest
None declared.