Introduction
Bipolar disorder is a familial psychiatric condition, characterized by recurrent episodes of disordered mood, with at least one episode of mania or hypomania, frequently accompanied by psychotic symptoms. Impairments of neuropsychological function have been consistently reported in patients with established bipolar disorder, even when euthymic. Deficits have been demonstrated in verbal learning (Cavanagh et al. Reference Cavanagh, Van Beck, Muir and Blackwood2001), memory (Martínez-Arán et al. Reference Martínez-Arán, Vieta, Reinares, Colom, Torrent, Sánchez-Moreno, Benabarre, Goikolea, Comes and Salamero2004) and motor function (Zubieta et al. Reference Zubieta, Huguelet, O'Neil and Giordani2001). Executive function deficits are also prominent (Murphy & Sahakian, Reference Murphy and Sahakian2001; Zubieta et al. Reference Zubieta, Huguelet, O'Neil and Giordani2001; Torrent et al. Reference Torrent, Martinez-Arán, Daban, Sanchez-Moreno, Comes, Goikolea, Salamero and Vieta2006; Robinson et al. Reference Robinson, Thompson, Gallagher, Goswami, Young, Ferrier and Moore2006). Arts et al. (Reference Arts, Jabben, Krabbendam and van Os2008) performed a meta-analysis of bipolar patients and first degree relatives and propose that executive function and verbal memory are candidate ‘endophenotypes’ for bipolar disorder – being state independent and present in unaffected relatives who are likely to be carrying susceptibility genes for the illness. Verbal fluency showed a relatively large effect size in this meta-analysis. Bora et al. (Reference Bora, Vahip, Akdeniz, İlerisoy, Aldemir and Alkan2008) in a small study in bipolar patients and their relatives also suggest that executive dysfunction is shared by bipolar patients in remission and their first degree relatives. A meta-analysis by the same group (Bora et al. Reference Bora, Yucel and Pantelis2009) concluded that executive function is a consistent deficit in remitted bipolar patients and first degree relatives, although they attributed a higher effect size to response inhibition than to verbal fluency. Against this, the systematic review of Balanza-Martinez et al. (Reference Balanza-Martınez, Rubio, Selva-Vera, Anabel Martinez-Aran, Sánchez-Moreno, Salazar-Fraile, Eduard Vieta and Tabares-Seisdedos2008) concluded that verbal learning and working memory were the consistent deficits.
Functional magnetic resonance imaging (fMRI) has begun to identify dysfunctional networks in patients with bipolar disorder (Friedman et al. Reference Friedman, Hurley and Taber2006). This evidence is largely consistent with a model in which impaired prefrontal (cognitive) modulation of anterior limbic (emotional) networks underlies mood symptoms in bipolar disorder (Blumberg et al. Reference Blumberg, Stern, Martinez, Ricketts, de Asis, White, Epstein, McBride, Eidelberg, Kocsis and Silbersweig2000; Strakowski et al. Reference Strakowski, DelBello, Adler, Cecil and Sax2000). Strakowski et al. (Reference Strakowski, DelBello and Adler2005) demonstrated increased activation in regions involved in emotional regulation during an attention task, while Monks et al. (Reference Monks, Thompson, Bullmore, Suckling, Brammer, Williams, Simmons, Giles, Lloyd, Harrison, Seal, Murray, Ferrier, Young and Curtis2004) demonstrated frontal hypo-activation during a working memory task in euthymic bipolar patients. There has been very little work addressing the neural substrates of cognitive deficits in the genetically liable unaffected relatives of individuals with bipolar disorder. Here we report a fMRI study of remitted bipolar 1 disorder patients, their unaffected first degree relatives who are presumed to be at increased genetic liability for bipolar illness and healthy controls, utilizing a frontal executive task. The task used – verbal fluency – is a sensitive indicator of frontal lobe function (Schlösser et al. Reference Schlösser, Hutchinson, Joseffer, Rusinek, Saarimaki, Stevenson, Dewey and Brodie1998). Curtis et al. (Reference Curtis, Dixon, Morris, Bullmore, Brammer, Williams, Sharma, Murray and McGuire2001) have demonstrated that euthymic bipolar patients showed greater prefrontal activation than healthy controls on a fMRI verbal fluency task. For the present study we employed a verbal fluency task similar to that of Fu et al. (Reference Fu, Morgan, Suckling, Williams, Andrew, Vythelingum and McGuire2002, Reference Fu, Suckling, Williams, Andrew, Vythelingum and McGuire2005) to probe alterations in neural networks underlying executive function. We predicted that patients with bipolar disorder would show impaired performance on this task compared with healthy controls and that the performance of unaffected relatives would be intermediate between these two groups. We further predicted that both remitted bipolar patients and their unaffected relatives would show reduced frontal activation compared with controls consistent with a familial aetiology.
Method and materials
Study participants
Patients with a diagnosis of bipolar 1 disorder and a history of psychotic symptoms were recruited via referral from mental health services, by self-referral or through advertisements circulated by voluntary support organizations. These patients came from multiply affected families – i.e. two or more affected members among first and/or second degree relatives. Unaffected first degree relatives of these patients were recruited to form the second group (relatives group). These groups have been described in detail previously (McDonald et al. Reference McDonald, Marshall, Sham, Bullmore, Schulze, Chapple, Bramon, Filbey, Quraishi, Walshe and Murray2006; Drapier et al. Reference Drapier, Surguladze, Marshall, Schulze, Fern, Hall, Walshe, Murray and McDonald2008; Chaddock et al. Reference Chaddock, Barker, Marshall, Schulze, Hall, Fern, Walshe, Bramon, Chitnis, Murray and McDonald2009). A comparison group was recruited by press advertisement, screened for personal and family history of bipolar disorder or psychotic illness. Participants from all three groups were excluded if they had a history of neurological illness (including head injury resulting in loss of consciousness, stroke and intracranial infection) and substance or alcohol dependence (according to DSM-IV criteria) within the 12 months prior to assessment. We did not exclude relatives or controls with a lifetime history of psychiatric disorders other than psychosis or bipolar disorder – i.e. the only recruitment criterion differentiating unaffected relatives and controls was that the former group had a first degree relative with psychotic bipolar disorder. This avoided the potential bias of recruiting ‘supernormal’ controls (Kendler, Reference Kendler2003) in such studies. All participants were well at the time of scanning. The groups were matched for age, sex and parental socio-economic status. A total of 20 bipolar patients, 20 unaffected relatives and 20 controls were recruited.
Clinical assessment
Participants were assessed using the Schedule for Affective Disorders and Schizophrenia – Lifetime Version (Endicott & Spitzer, Reference Endicott and Spitzer1978), completed by a trained psychiatrist and supplemented with additional clinical information to enable DSM-IV diagnoses to be derived. Mood state at the time of scanning was assessed using the Altman Self-Rated Mania Scale (ASRM; Altman et al. Reference Altman, Hedeker, Peterson and Davis1997) and the Beck Depression Inventory (BDI; Beck et al. Reference Beck, Ward, Mendelson, Mock and Erbaugh1961). Sociodemographic details and information about current medication usage was also acquired.
Verbal fluency task
The overt verbal fluency paradigm of Fu et al. (Reference Fu, Morgan, Suckling, Williams, Andrew, Vythelingum and McGuire2002) was used. Subjects in the scanner were requested to generate a word beginning with a cue letter, presented at a rate of one letter every 4 s. The ‘easy’ condition used the following two sets of letters: T, L, B, R, S or T, C, B, P, S. The ‘hard’ condition used O, A, N, E, G or I, F, N, E, G. The validity of this task load classification on the basis of the cue letters has been established in a normative population study (Fu et al. Reference Fu, Morgan, Suckling, Williams, Andrew, Vythelingum and McGuire2002). Each letter was presented seven times and each subject viewed one easy and one hard set of letters, with the order of presentation randomized between subjects. Letter presentations alternated with a control condition, consisting of the word ‘rest’, which subjects were instructed to say out loud. Verbal responses were recorded using Cool Edit 2000 (Syntrillium Software Corp., USA). For the purpose of scoring the verbal fluency performances, neologisms, non-existent words, words beginning with the wrong letter, proper nouns, repetitions and multiple uses of the same word stem were all counted as ‘incorrect’ (Strauss et al. Reference Strauss, Sherman and Spreen2006). Incorrect responses were excluded from fMRI analysis.
Magnetic resonance imaging
In total, 74 T2*-weighted gradient-echo single-shot echo-planar images were acquired on a 1.5-T IGE LX System (General Electric, USA), at the Maudsley Hospital, London, UK. A total of 12 non-contiguous axial planes (7 mm thickness, slice skip 1 mm) parallel to the anterior commissure – posterior commissure line were collected over 1100 ms in a ‘clustered’ acquisition (TE=40 ms, flip angle=70°). Immediately after each acquisition, a letter was presented (remaining visible for 750 ms, height 7 cm, subtending a 0.4° field of view) and a single overt verbal response was made during the remaining silent portion (entire duration=2900 ms) of each repetition (TR=4000 ms). Head movement was minimized by a forehead strap. The potential effects of head movement during speech were also mitigated by the use of a clustered acquisition, as verbal responses were made in the period between, and not during, MRI acquisitions. To ensure that subjects heard their responses clearly, their speech was amplified by a computer sound card and relayed to the subject through an acoustic MRI sound system (Ward Ray, UK) and noise-insulated, stereo headphones at a mean volume of 91 dB (s.d.=2).
fMRI analysis
fMRI data were analysed using the X-Brain Activation Mapping package (Institute of Psychiatry, UK) (version 3.4) (Bullmore et al. Reference Bullmore, Suckling, Overmeyer, Rabe-Hesketh, Taylor and Brammer1999). The initial five volumes of each time series were discarded. These were the four images acquired while the magnetic resonance signal was reaching steady state and a fifth image used to trigger the software program for letter presentation. Images were reviewed for the presence of motion artefact before processing. Images were realigned and smoothed using a Gaussian kernel (s.d.=3). The experimental condition of interest was correct task performance, contrasted with baseline. Blood oxygen level-dependent (BOLD) responses during incorrect verbal fluency responses were discarded. The amplitude of the response to each event was estimated by least-squares regression of a linear model, a convolution of the experimental design with two Poisson kernels (λ=2 and 4 s respectively). A map of responses derived under the null hypothesis of no experimental effect was generated by regression of the model after repeated permutation of the data following orthogonal transformation into the wavelet domain (Bullmore et al. Reference Bullmore, Long, Suckling, Fadili, Calvert, Zelaya, Carpenter and Brammer2001). Individual brain activation maps were transformed into stereotactic space by a rigid body transformation into a high-resolution inversion recovery image, followed by affine transformation on to a template in Talairach space. Median observed and permuted responses were calculated by inference against the permutation distribution used to create the maps at the individual level. Activation maps of the easy and hard task conditions were generated for each group. As the data were acquired in a blocked design for each condition, the easy and difficult conditions were contrasted within each group using a categorical comparison. Group differences, and group-by-task difficulty interactions, were assessed by fitting a general linear model at each intracerebral voxel in standard space. The primary analysis used a 3×2 repeated-measures design, with task difficulty as the within-subject variable and group as the between-subjects variable. ‘Incorrect’ trials were excluded from the analysis. Probabilistic thresholds were set such that the estimated number of type 1 error clusters across the entire volume was <0.5 (Branner et al. 1997; Bullmore et al. Reference Bullmore, Suckling, Overmeyer, Rabe-Hesketh, Taylor and Brammer1999).
Statistics
Sociodemographic characteristics were analysed using χ2 or Fisher's exact test, and (two-tailed) independent t tests, as appropriate. Verbal fluency performance data were non-parametric; group differences were analysed using Wilcoxon signed ranks test and relationships with clinical ratings assessed using non-parametric (Spearman) correlations. Data were analysed using the Statistical Package for the Social Sciences (SPSS) version 13.0 (SPSS Inc., USA).
Ethics
The study was approved by the joint Maudsley Hospital/Institute of Psychiatry ethical committee. All subjects received full information and provided written consent.
Results
Subject groups
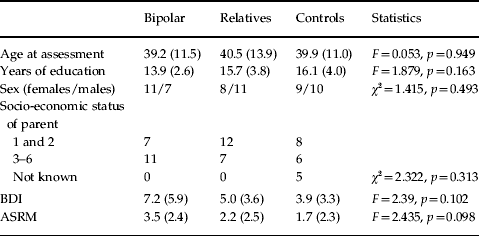
fMRI data were successfully acquired in 18 bipolar individuals, 19 first degree relatives and 19 controls. Sociodemographic details are summarized in Table 1. There were no significant differences between the groups in age at assessment, sex distribution or parental socio-economic status.
Demographic and mood characteristics of the study groups

BDI, Beck Depression Inventory; ASRM, Altman Self-Rated Mania Scale.
Values are shown as mean (s.d.).
In the bipolar group, mean age at diagnosis was 27 years (s.d.=10) and mean age of onset of symptoms was 23 years (s.d.=6). Three individuals in the relatives group and two in the control group had experienced a major depressive disorder (by DSM-IV criteria) at some point in their lifetime. One participant from the relative group had had substance-induced mood disorder and one individual from the control group had abused alcohol in the past. None of the relatives or controls was unwell at the time of scanning or receiving psychotropic treatment. A total of 13 individuals from the bipolar group were receiving one or more psychotropic medication at time of scanning [eight with lithium; seven with other mood stabilisers; three with antidepressants; three with antipsychotics (olanzapine)]. Five were on no medication. BDI and ASRM scores were not significantly different between the groups (see Table 1). No individual scored >6 (cut-off for hypomania) on the ASRM or >19 (cut-off for moderate depression) on the BDI. There were no correlations between BDI or ASRM scores and verbal fluency task performance in any group.
Behavioural data
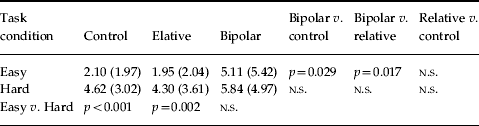
Bipolar individuals made significantly more errors than both controls (Z=−2.19, p=0.029) and relatives (Z=−2.379, p=0.017) in the easy but not in the hard condition (see Table 2). There were no significant differences between controls and relatives in either task condition. Significantly more errors were made in the hard condition than the easy condition by both controls (Z=−3.54, p<0.001) and relatives (Z=−3.05, p=0.002), but not by bipolar patients (Z=−1.18, p=0.237). There was no significant difference in task performance between bipolar patients taking medication and those on no medication, either at easy (F=0.001, p=0.974) or hard (F=0.008, p=0.931) levels of difficulty.
Mean (s.d.) number of errors made by each group in easy and hard verbal fluency conditions

p values for group and task difficulty comparisons (determined by Wilcoxon signed ranks test) are given.
Generic brain activation maps
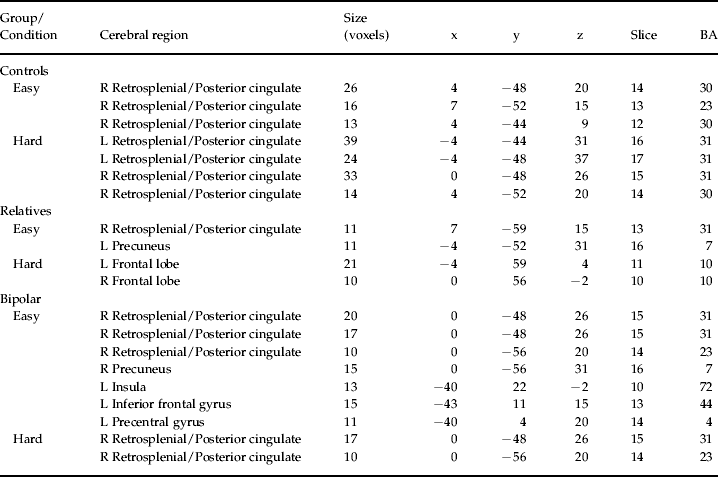
Widespread brain areas were activated by both easy and hard verbal fluency conditions in all three groups (Table 3), consistent with other studies that have used this paradigm (Fu et al. Reference Fu, Morgan, Suckling, Williams, Andrew, Vythelingum and McGuire2002, Reference Fu, Suckling, Williams, Andrew, Vythelingum and McGuire2005).
Areas of significant activation (p<0.05) in generic brain activation maps in the control, relative and bipolar groups in the easy and hard task conditions

R, Right; L, left.
Coordinates, slice number and Brodman area (BA) are given.
Group and task differences
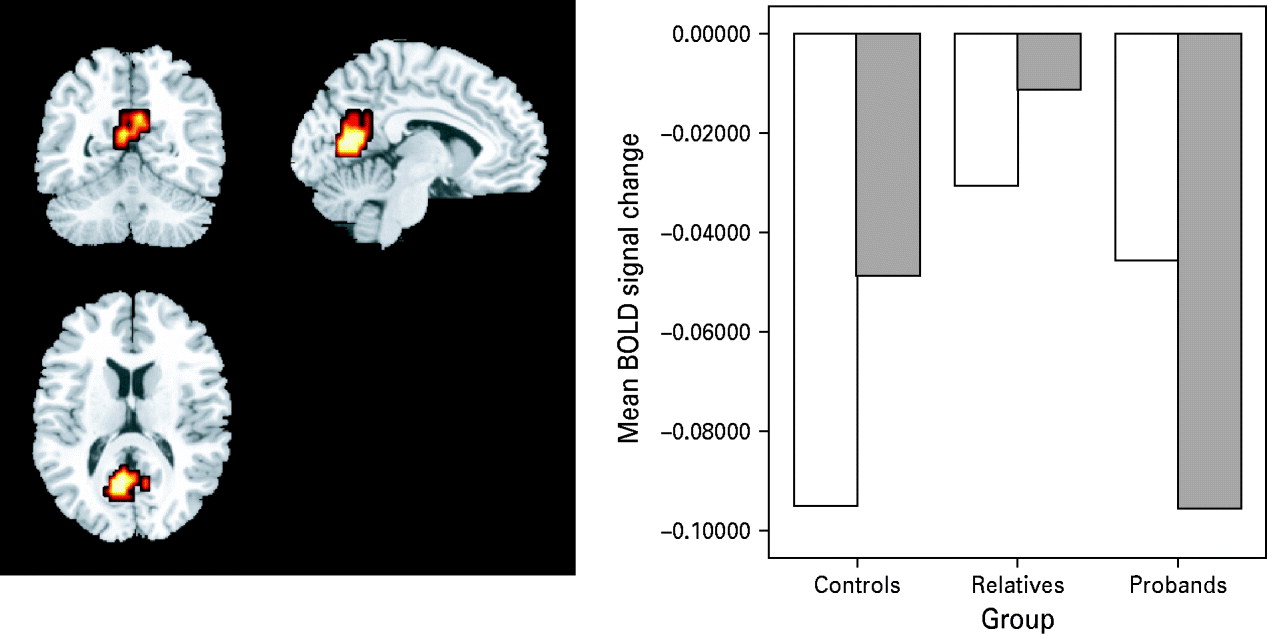
There was a significant main effect of group in one cluster, which included the precuneus and posterior cingulate and retrosplenial cortex bilaterally (centre of cluster mass: x=7, y=−56, x=15) (<1 expected false positive cluster at p=0.01) (Fig. 1). There was a significant main effect of task difficulty, in the middle temporal gyrus (x=−51, y=−7, z=−7), ventrolateral prefrontal cortex (x=−43, y=26, z=−7) and thalamus (x=4, y=−4, z=9) (<1 false positive expected at p=0.01) (Fig. 1). There were no interactions between group and task difficulty.
Differential activation of retrosplenial cortex in patients, relatives and controls. Brain activation map showing results of repeated-measures analysis of variance (three groups, two task conditions). The clusters in red/orange represent significant main effect of group (p<0.001). Centre of activation in retrosplenial/posterior cingulate cortex (x=7, y=−56, x=15). In this cluster, relatives demonstrated reduced deactivation relative to controls [in the easy condition (□)] and reduced deactivation relative to bipolar patients [in the hard condition ( )]. The mean change in blood oxygen level-dependent (BOLD) signal for each group and each condition is shown in the graph on the right of the panel.

BOLD responses
Mean sum of squares of BOLD signal for each participant were extracted from the retrosplenial cluster, which showed group differences. All three groups showed deactivation of this cluster relative to the neutral condition, with a significant group difference in both the easy condition [F(2, 55)=3.42, p=0.04] and the hard condition [F(2, 55)=4.34, p=0.018]. Covarying for use of psychotropic medication and level of education did not significantly alter these results [easy: F(2, 55)=3.83, p=0.028; hard: F(2, 55)=4.46, p=0.016]. When controls (n=1) and relatives (n=3) with a lifetime history of psychiatric illness were excluded from the analysis, group differences were no longer significant in the easy condition [F(2, 55)=1.96, p=0.151], but remained significant in the hard condition [F(2, 55)=3.86, p=0.028]. There were no significant differences in BOLD response between relatives and controls who had a lifetime history of psychiatric illness and those who did not [easy: F(1, 55)=0.004, p=0.948; hard: F(1, 55)=0.012, p=0.915]. Post-hoc analysis of variance revealed that significant group differences in the easy condition were driven by greater retrosplenial deactivation (relative to the ‘rest’ condition) in controls compared with relatives [F(1, 37)=6.89, p=0.013]. In the hard condition, group differences were driven by relatively greater retrosplenial deactivation in bipolar patients compared with relatives [F(1, 3 6)=6.85, p=0.013]. Within-group paired sample t tests showed a significant reduction in retrosplenial deactivation with increasing task difficulty in the control group (t=−2.44, df=18, p=0.025), but not in patients or relatives. There were no significant correlations between retrosplenial BOLD response and ASRM or BDI scores in any of the participant groups at either level of task difficulty.
Group differences in brain activation
Bipolar versus control
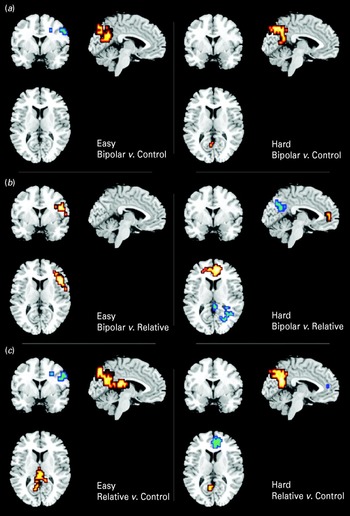
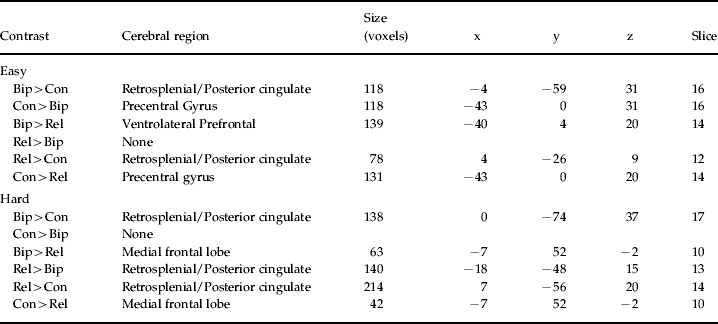
The bipolar group showed greater activation than controls in one cluster, located in the retrosplenial/posterior cingulate cortex in both the easy and hard task conditions (for both: <1 expected false positive cluster, at p=0.01). In the easy condition, the bipolar group additionally showed a smaller cluster of reduced activation, centred on left frontal cortex (p=0.01) (Fig. 2, Table 4).
Brain activation maps showing between-group differences in easy and hard tasks. (a) Bipolar patients versus controls. Red clusters represent areas of greater activation in the bipolar group; blue clusters represent greater activation in the control group. (b) Bipolar patients versus unaffected relatives. Red clusters represent areas of greater activation in the bipolar group; blue clusters represent greater activation in the relatives group. (c) Unaffected relatives versus controls. Red clusters represent greater activation in relatives; blue clusters represent greater activation in controls.

Post-hoc group comparisons in easy and hard task conditions

Bip, Bipolar; Rel, relatives; Con, control.
Coordinates and slice number of the centre of each cluster are given.
Bipolar versus relatives
In the easy condition, the bipolar group showed greater activation than relatives in one cluster, centred in ventrolateral prefrontal cortex (<1 false positive at p=0.01). In the hard condition, the bipolar group showed relatively reduced activation in one cluster centred on the retrosplenial/posterior cingulate cortex, and increased activation in a cluster situated in medial frontal cortex (<1 false positive at p=0.0075) (Fig. 2, Table 4).
Relatives versus controls
In the easy condition, relatives showed greater activation than controls in two clusters, centred on the retrosplenial/posterior cingulate cortex and the precuneus, and reduced activation in one cluster in the left frontotemporal areas (<1 false positive at p=0.01). In the hard condition, relatives again showed greater activation than controls in one cluster in the retrosplenial/posterior cingulate cortex, and reduced activation in a cluster centred on the medial frontal cortex (<1 false positive at p=0.01) (Fig. 2, Table 4).
Discussion
Using a fMRI verbal fluency task, we have demonstrated activation differences between bipolar 1 disorder patients in remission, their unaffected relatives and controls. The primary group difference was a reduction in deactivation of retrosplenial cortex during task performance in unaffected relatives. Post-hoc group comparisons also revealed relative prefrontal hypo-activation in both bipolar patients and unaffected relatives, consistent with our initial hypothesis.
These results are consistent with an inherited abnormality of the neural networks subserving verbal fluency in bipolar disorder. A recent diffusion tensor imaging study by our group employing similar participants (Chaddock et al. Reference Chaddock, Barker, Marshall, Schulze, Hall, Fern, Walshe, Bramon, Chitnis, Murray and McDonald2009) demonstrated that the genetic liability to bipolar disorder is associated with alterations of connectivity in associative white matter tracts. A fMRI study of working memory in these same participants demonstrated increased prefrontal activation in unaffected relatives with high genetic liability for bipolar disorder (Drapier et al. Reference Drapier, Surguladze, Marshall, Schulze, Fern, Hall, Walshe, Murray and McDonald2008). Taken together, these results suggest that abnormalities in neural processing are present in those with high genetic loading for bipolar disorder. However, the principal group differences that we demonstrate here were driven by differences between relatives and controls and between relatives and patients. In this analysis, patients seemed, counter-intuitively, to have activation patterns more similar to controls than to their relatives. Since bipolar disorder is likely to be influenced by many genetic and epigenetic factors, the lack of a simple linear relationship here is perhaps not surprising. Familial genetic effects may also be confounded by influences specific to the patient group, such as lifetime episodes of mania and depression or medication (including lithium), which may be associated with neuroplastic changes that are likely to further confound differences in neural activation patterns (Carlson et al. 2006). It has been suggested that medication in bipolar patients could normalize activation differences on fMRI (Caligiuri et al. Reference Caligiuri, Brown, Meloy, Eberson, Kindermann, Frank, Zorrilla and Lohr2003). Post-hoc testing did indeed reveal similar patterns of reduced deactivation in retrosplenial cortex in both patients and relatives, when compared with controls.
The retrosplenial cortex receives inputs from several areas, including prefrontal, anterior cingulate, parahippocampal and superior temporal cortex and thalamus (Maddock, Reference Maddock2000). Animal studies suggest that it may function as a ‘relay’ between visual cortex and hippocampus (Yoshimura et al. 2005). In humans, this area is involved in memory – possibly as a relay between thalamus and frontal and temporal lobes (Reed et al. 2005). fMRI studies (Maddock, Reference Maddock2000) indicate that it is activated in tasks requiring the retrieval of visual and verbal memories. The precuneus, which is also part of the main cluster of group activation differences that we report, is also involved in visuospatial processing, memory-related imagery and attention (Fletcher et al. Reference Fletcher, Frith, Baker, Shallice, Frackowiak and Dolan1995). The retrosplenial cortex has been conceptualized as part of an ‘evaluative’ system, in comparison with the ‘executive’ system involving anterior cingulate and prefrontal cortex (Maddock, Reference Maddock2000; Maddock et al. Reference Maddock, Garrett and Buonocore2003). The cued verbal fluency task that we used, in which subjects generated a word in response to a letter displayed on a screen, is likely to involve both visual and verbal memory and evaluation of the stimulus (the presented letter) along with the selection of an appropriate word from memory. The retrosplenial cortex is also activated by emotionally salient stimuli (Maddock, Reference Maddock2000) – for example, when judging the pleasantness or unpleasantness of words (Maddock et al. Reference Maddock, Garrett and Buonocore2003). Posterior cingulate activity is increased in schizophrenia (Andreasen et al. 1997) and in major depressive disorder (Ho et al. 1996). Posterior cingulate and retrosplenial cortices have efferent connections to the anterior cingulate and other areas involved in the regulation of emotional behaviour (Nugent et al. Reference Nugent, Milham and Bain2006) and receive projections from hippocampal subiculum (Mesulam, Reference Mesulam and Mesulam2000; Maddock et al. Reference Maddock, Garrett and Buonocore2003). The retrosplenial cortex has been found to be reduced in volume in unmedicated bipolar patients (Nugent et al. Reference Nugent, Milham and Bain2006). However, the study of Sassi et al. (2004), which used a different methodology, found volumetric differences in the anterior but not the posterior cingulate in a similar patient group.
A third possible function of the retrosplenial cortex has been revealed in healthy controls during word generation tasks (Fletcher et al. Reference Fletcher, Frith, Baker, Shallice, Frackowiak and Dolan1995). During such tasks there is deactivation of retrosplenial cortex – which has been explained as the possible role of this structure in the putative ‘default mode network’ (Sonuga-Barke & Castellanos, Reference Sonuga-Barke and Castellanos2007; Fair et al. Reference Fair, Cohen, Dosenbach, Church, Miezin and Barch2008). This network is active at rest and suppressed during effortful cognitive tasks. According to this model, resting state activity of the default mode network is associated with spontaneous thinking – e.g. retrieval of emotionally salient memories or encoding of new reflections into memory – which is suspended when effort is required to perform the task. Failure to deactivate this area may thus be expected to impair task performance. Manic patients are more distractible than healthy controls (Hoffman et al. 1986) and, even when euthymic, bipolar patients may make more impulsive responses (Strakowski et al. Reference Strakowski, DelBello, Adler, Cecil and Sax2000, 2005). Our results are consistent with an inherited deficit in retrosplenial cortex function – either as part of the ‘evaluative’ system, in its role as a regulator of emotion and affect or over-activity of the ‘default-mode’, which interferes with task performance. McIntosh et al. (Reference McIntosh, Heather, McKirdy, Hall, Sussmann, Shankar, Johnstone and Lawrie2008) suggest that bipolar patients may be more likely to activate emotional areas when performing a linguistic frontal lobe task (the Hayling Sentence Completion Test). The observation that bipolar individuals make similar levels of errors regardless of task difficulty, whereas relatives and controls make significantly more errors in the hard task than in the easy task, could be consistent with this feature of the functional neuro-anatomy. It implies that errors in the bipolar group are not due to a failure of the neural networks necessary for task performance. In this context, errors made by bipolar patients could be due to a failure to suppress ‘default mode’ activity in the retrosplenial cortex. This would be expected to be relatively insensitive to task difficulty.
In the present study, patients with bipolar disorder showed reduced left frontal activation during the easy condition, along with increased performance errors. This is not consistent with the study of Curtis et al. (Reference Curtis, Dixon, Morris, Bullmore, Brammer, Williams, Sharma, Murray and McGuire2001), who reported greater frontal activation in bipolar patients than in controls when performing this task. This sample consisted of five bipolar patients, who were not recruited to be euthymic at the time of scanning, which may limit its comparability with our study. However, Curtis et al. (Reference Curtis, Thompson, Seal, Monks, Lloyd, Harrison, Brammer, Williams, Murray, Young and Ferrier2007) later reported verbal fluency fMRI in a slightly larger bipolar sample (n=12), with stringent criteria for euthymia. This study also found increased frontal activation in bipolar patients compared with controls, along with reduced activation in anterior cingulate and frontal motor areas. The inconsistency between these studies could be due to the relatively small sample sizes involved and the complexity of the likely activation patterns (Curtis et al. Reference Curtis, Thompson, Seal, Monks, Lloyd, Harrison, Brammer, Williams, Murray, Young and Ferrier2007 report regional increases and decreases in frontal activation, for example). Additionally, all of the patients in the study of Curtis et al. (Reference Curtis, Thompson, Seal, Monks, Lloyd, Harrison, Brammer, Williams, Murray, Young and Ferrier2007) were taking lithium and it is possible that they may have had altered neural responses as a result. Larger fMRI studies, with careful patient inclusion criteria, might help to resolve some of these differences.
Strakowski et al. (Reference Strakowski, DelBello, Adler, Cecil and Sax2000) noted that euthymic bipolar patients tended to make more impulsive responses, resulting in greater errors – which would be consistent with our findings. They suggest that the anterior cingulate and dorsolateral prefrontal cortex are part of a neural network involved in response inhibition and that the bipolar group also under-activated other areas, including temporal regions, midline cerebellum, ventrolateral prefrontal cortex and putamen, which may be involved in error detection. Our results are conceptually consistent with this, although the group differences that we have found do not fully overlap (Strakowski et al. Reference Strakowski, DelBello and Adler2005). The reduced frontal activation in the bipolar group also included Broca's area. This is conceptually congruent, because of the role of Broca's area in speech and language. Amunts et al. (2004) consider Broca's area to be also involved in ‘high-level aspects of programming speech production’. Under-activity of this area may thus be related to the increased tendency to make errors in the bipolar group.
Limitations
This is a study of highly selected bipolar individuals from multiply affected families with severe illness, who had also experienced psychosis during episodes of illness exacerbation. The results may not be generalizable to milder forms of bipolar disorder or non-familial samples. Although comparable with other fMRI studies, the sample size is small. We thus cannot exclude the possibility that the study lacked power to identify some group differences in activation patterns. The MRI acquisition that we used has a relatively coarse slice thickness (because of the need to acquire images for whole head). The data do not include the cerebellum, which has been shown to be activated by verbal fluency tasks (Schlösser et al. Reference Schlösser, Hutchinson, Joseffer, Rusinek, Saarimaki, Stevenson, Dewey and Brodie1998) and consequently we may not have assessed the full extent of the neural network affected. In general, fMRI experiments may be confounded by task performance differences, symptoms and medication effects. We controlled for the effect of task performance in the analyses. We did not find manic or depressive symptoms to influence verbal fluency performance, but we cannot exclude the possibility that subthreshold mood symptoms could affect brain activation patterns. Medication effects cannot be completely excluded in the patient sample, but we found no evidence for any effect on task performance or on BOLD signal in the posterior cingulate and the results were not altered by entering medication as a confounding variable. This was a cross-sectional study and we cannot rule out the possibility that some of the currently unaffected relatives may be at risk of developing manic episodes in the future. Longitudinal follow-up could clarify this possibility. However, a key strength of the present study is the inclusion of unaffected relatives of patients – the abnormalities detected in these participants cannot be confounded by medication usage or other illness-related confounds and indicates that retrosplenial hyperactivation during verbal fluency may represent a stable, heritable characteristic.
Summary
When performing a verbal fluency task, bipolar patients showed failure to deactivate retrosplenial cortex, along with under-activation of left prefrontal cortex, compared with controls. A similar pattern was observed in their unaffected relatives, consistent with an inherited abnormality of functional brain architecture in bipolar patients and their relatives.
Acknowledgement
This study was supported by a Medical Research Council (UK) Pathfinder Award (C.McD.).
Declaration of Interest
None.