I. INTRODUCTION
Following the successful path of nanostructure-reinforced polymer composites, metal-based composites, commonly referred to as metal matrix composites (MMCs), are receiving increasing attention due to the availability of advanced metal processing technologies. As MMCs offer unique characteristics, often a combination of properties not found for pristine metals or polymer composites, for example lightweight and high strength, these materials are increasingly utilized in the automotive and aircraft industries, in shipbuilding, as well as in widespread military applications. Reference Suryanarayana1–Reference Ramasamy, Hill, Hepper, Bull and Clasper3
The majority of the studies found in the literature, focusing on the design of nanostructure-reinforced MMCs, has used carbon nanotubes (CNTs) as the primary reinforcement agent. CNTs, which can be imagined as one or more layers of graphite rolled into a cylinder, are characterized by exceptionally high aspect ratios and extraordinary physical properties, making them an ideal candidate for composite applications and structural reinforcement. Reference Salvetat, Bonard, Thomson, Kulik, Forro, Benoit and Zuppiroli4–Reference Bakshi, Lahiri and Agarwal9 For example, mechanical testing data on multiwalled carbon nanotubes (MWCNTs) reported an average Young's modulus of 1.8 TPa, while theoretical calculations predict values as high as 4.15 TPa. Reference Treacy, Ebbesen and Gibson7 More recent measurements conducted on the outermost layers of MWCNTs using a “nanostressing stage” indicated that Young's modulus varied from 270 to 950 GPa, Reference Ajayan10 depending on the structural variety and defects of CNT samples. Unlike traditional reinforcement agents (e.g., oxides, carbides), CNTs possess an extremely low density (1.2–1.8 g/cm3) and thus enable substantial weight saving while improving the overall performance of the matrix material. Reference Ajayan10
As with most advanced material systems, there are a number of practical challenges on the path toward successful synthesis and application of CNT–MMCs. Similar to CNT-based polymer composites, the performance of CNT–MMCs depends largely on the ability to effectively disperse the reinforcement agent in the metal matrix, to maintain the structural integrity of the CNTs during composite synthesis and processing, and to establish a suitable metal–CNT interface. Reference Kuzumaki, Miyazawa, Ichinose and Ito11–Reference Sridhar and Narayanan14 Like most carbon nanostructures, CNTs exhibit a strong tendency to agglomerate, form bundles, and entangle, which can prevent an effective dispersion in the matrix material. Several attempts have been made to reduce the agglomeration of CNTs prior to composite synthesis including ultrasonication, chemical functionalization, and mechanical grinding. Reference Yamamoto, Miyauchi, Motoyanagi, Fukushima, Aida, Kato and Maruyama15–Reference Chen, Conway and Fitzgerald17 In addition to the agglomeration issue, due to the sp 2-nature of CNTs, high synthesis or processing temperatures may lead to chemical reactions between the reinforcement agent and the matrix material, putting at risk the structural integrity of the CNTs. These material- and process-related challenges have the potential to severely deteriorate the physical and mechanical properties of CNT–MMCs and, must be taken in consideration.
To overcome these limitations, a series of powder processing techniques have been developed. Their primary objective is to account for the fact that, unlike polymers, metals require relatively high temperatures for processing. Many carbon nanostructures are unable to withstand the temperatures required to melt metals. In fact, chemical reactions between CNT and metal matrix, such as carbide formation, often occur at significantly lower temperatures. Reference Garosshen and McCarthy18
Various forms of ball-milling, also referred to as mechanical alloying (MA) or mechanical mixing, have been utilized to disperse nanometer-sized reinforcement agents, including CNTs, in MMCs, as the process allows for thorough mixing at relatively low temperatures. At the same time, it is well known that milling under improper conditions can also damage the CNT Reference Welch19–Reference Kukovecz, Kanyó, Kónya and Kiricsi21 or lead to carbide formations. Reference Poirier, Gauvin and Drew22 Even if temperatures remain low during milling, the induced residual strain and defects in the material enhance the likelihood for chemical reactions to occur during the following powder consolidation steps.
Esawi et al. dispersed CNTs in an Al matrix using a planetary ball mill and reported that milling times around 3 h were found most suitable for improved mechanical properties. Reference Esawi and Morsi12,Reference Esawi, Morsi, Sayed, Gawad and Borah23 Due to a different operating mechanism, planetary ball mills inject less energy into the material during mixing, as compared to high-energy shaker mills, and thus lower the risk of CNT damage and/or heat-induced chemical reactions. Reference DeCastro and Mitchell24 To further protect CNTs against structural damage during ball milling, chemical modifications such as natural rubber treatment, Reference Kwon, Estili, Takagi, Miyazaki and Kawasaki25 and processing control additives such as methanol or ethanol can be applied. Stein et al. suggested that ultrasonication prior to milling can improve dispersion, resulting in a homogeneous distribution of CNTs inside the matrix particles at the scale of a few micrometers, while requiring shorter milling times. Reference Stein, Lenczowski, Fréty and Anglaret26
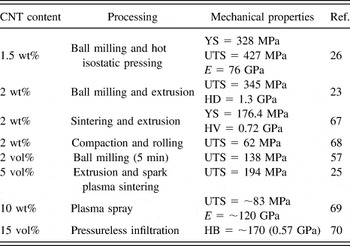
Although there exist different approaches to CNT–MMC synthesis, Reference Bakshi, Lahiri and Agarwal9 the majority of the studies found in the literature involving ductile matrix metals used milling methods for CNT–MMC production. Reference Kuzumaki, Miyazawa, Ichinose and Ito11,Reference Lamotte, Phillips, Perry and Killias28–Reference Dong, Tu and Zhang30 Particularly the reinforcement of aluminum (Al) has benefited from intense research efforts in this area. Table I lists some recent studies on CNT–Al MMCs, including the reported mechanical properties. For a more comprehensive summary of CNT–MMC, the reader is referred to the review by Bakshi et al. Reference Bakshi, Lahiri and Agarwal9
Mechanical properties of Al–CNT composites.

Note: YS, yield tensile strength; UTS, ultimate tensile strength; E, Young's modulus; HV, Vickers hardness; HD = nanoindentation hardness; HB, Brinell hardness.
In addition to nanostructure dispersion, there are a number of other benefits resulting from ball milling that can yield further improvements in MMC performance, depending on the type of milling technique in use. For example, the milling process is known to enhance the strength of MMCs by reducing the grain size of the metal matrix to the nanoscale. Reference Meyers and Chawla31 Another benefit of milling is the control over particle size and size distribution, Reference Hüller, Chernik, Fokina and Budim32 which is of great importance for most powder consolidation techniques, particularly cold spray (CS) in which particle velocity, deposition efficiency, and coating density are sensitive to the size and shape of precursor powders. Reference Wu, Fang, Yoon, Kim and Lee33,Reference Jodoin, Ajdelsztajn, Sansoucy, Zúñiga, Richer and Lavernia34 While a variety of studies reported on the synthesis of CNT-reinforced Al MMCs, the temperatures reached during processing commonly resulted in the formation of carbides and aluminum grain growth.
One strategy to circumvent heat-induced changes in the powders during milling is the use of cryogenic techniques. In addition to preventing chemical reactions in the sample, milling at cryogenic temperatures improves the hardness of the material, in accordance with the Hall–Petch relation. Reference Dieter35 The low temperatures expedite grain refinement and allow for further reduction in grain size, as compared to room temperature milling, due to the increased brittleness of the material and reduced grain growth. Reference Suryanarayana36–Reference Witkin and Lavernia39 Therefore, cryogenic milling conditions are believed to reduce processing times, to yield finer grain structures, and to lower the risk of temperature-induced changes during processing, as compared to conventional ball milling techniques. As we will show in this study, the ability to disperse CNTs in the metal matrix and to prevent shortening of the nanostructures depends on the actual milling mechanism. Cryogenic milling refers to milling at very low, normally <100 K, temperatures, however, the grinding method and milling media can vary. Lee et al. Reference Lee, Jeong, Heo, Park, Lee, Park, Han, Kwon, Kovalev and Yoon40 studied the milling behavior of CNTs at low temperatures using an agitator-applied ball mill and found that, due to their rigid and inflexible shapes at cryogenic conditions, CNTs were opened and shortened.
In this study, we utilized a SamplePrep 6870 Freezer/Mill impact grinder (Spex Sample Prep, Metuchen, NJ) to synthesize CNT-reinforced Al MMC powders. The primary focus is on investigating the effect of different cryogenic milling parameters on CNT–Al MMC powders with different CNT contents by varying (a) the duration of the individual milling cycle and (b) the total number of cycles. While there exist numerous studies investigating the effects of ball milling at ambient conditions on the characteristics of CNT–Al MMC powders and the performance after subsequent consolidation, less attention has been given to powder processing at cryogenic temperatures. We systematically explore the relationships between the various cryogenic milling parameters and report their effect on structure and properties of CNT–Al MMC powders. Powder morphology, grain size, CNT dispersion, and mechanical properties of the CNT–Al MMCs were analyzed using a combination of material characterization techniques, including scanning electron microscopy (SEM), x-ray diffraction (XRD), Raman spectroscopy, and nanoindentation.
II. EXPERIMENTAL
A. Materials
Spray atomized Al powder (H-10) was purchased from Valimet, Inc. (Stockton, CA). Particle size and purity were given by the manufacturer as −325 mesh and >99.7%, respectively. MWCNTs (Graphistrength, 90–97% purity) were obtained from Arkema (King of Prussia, PA). The number of walls, average diameter, and tube length were reported as 5–15, 10–15 nm, and 0.1–10 μm, respectively. The processing control agent (PCA) used during milling was stearic acid (FCC-type, >95% purity) purchased from Sigma–Aldrich Corp. (St. Louis, MO). Isopropyl alcohol (>95% purity) was purchased from Fisher Scientific (Fair Lawn, NJ). EpoFix resin and hardener for nanoindentation sample preparation were obtained from Struers (Cleveland, OH). All chemicals were used as-received, without further purification.
B. Composite synthesis
To investigate the effect of cryogenic milling on the characteristics of CNT–Al MMC powders, a series of 27 different composite samples was produced by varying powder composition (CNT contents of 0, 5, and 10 wt%) and milling parameters, including the number of milling cycles (3, 6, 9) and milling time per cycle (2, 5, and 10 min). MMC powders were prepared using a SPEX SamplePrep 6870 Freezer/Mill with a SPEX 6751 small grinding vial set. Vials were filled in an argon-filled glove box to remove oxygen and moisture prior to milling. For all experiments, 3.0 wt% stearic acid (PCA) was added to the powder mixture to prevent agglomeration. The filled vial was then placed in the magnetic shaker of the mill, which was subsequently filled with liquid nitrogen (LN). A-10 min precooling step was conducted prior to each milling experiment, while 2-min cooling intervals were used between cycles. The shaker frequency was set to 12 per second.
C. Material characterization
The morphology of the cryogenic milled MMC powders was characterized using a Neon 40 focused ion beam scanning electron microscope with a field emission gun (FIB-SEM) from Zeiss (Jena, Germany), operated at a voltage of 20 kV. Epoxy embedded and polished specimens containing the milled powders were coated with a nanometer-thick layer of chromium (Cr) to reduce charging during imaging.
A laser diffraction particle size analyzer (Partica LA-950, Horiba, Kyoto, Japan) was used for quantitative particle size analysis. Around 300 mg of each sample was mixed with isopropanol (dispersant liquid), and transferred to an analytic glass cell. The particle size range used referred to the distance between the 10 (D 10) and 90 (D 90) percentile diameter of the size measurement.
Raman spectra were recorded with an inVia Raman microspectrometer from Renishaw (UK) using a 514 nm Ar ion laser and 50x objective (power density <80 kW/cm2) offering a spatial resolution of ∼0.8 μm. Spectra were collected for 100 s (10 accumulations with 10 s exposure time) in spectral mode and 2 s (1 accumulation and 2 s exposure time) in Raman imaging mode. For Raman imaging, the laser powder was increased to ∼4 mW, while the beam was changed from spot to line focus, thus keeping the overall power density low. Raman imaging was conducted on the polished samples used for nanoindentation.
XRD was conducted utilizing a PW1830 diffractometer (Phillips, Amsterdam, Netherlands) with graphite monochromator and Cu anode (λ = 0.154 nm) at a current of 30 mA and voltage of 35 kV. XRD patterns (2θ) were recorded between 20 and 120 degrees using a step time and step size of 5 s and 0.04 degree, respectively. Calibration and instrumental broadening were determined using a LaB6 standard (SRM 660b from National Institute of Standards & Technology). Grain size analysis was conducted using the Williamson–Hall method following the approach outlined in Ref. Reference Woo, Sneed, Peerally, Heer, Brewer, Hooper and Osswald41
 $${{{\beta _{{\rm{sample}}}}\cos \theta } \over \lambda } = {\varepsilon \over \lambda }\sin \theta + {k \over L}\quad {\rm{,}}$$
where βsample is the integral breadth of the XRD peaks, ε is the lattice strain, L is the grain size, k is the Scherrer constant (k = 0.94), and λ is the wave length of x-ray radiation (λ = 0.1542 nm).
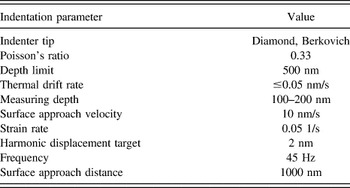
For nanoindentation measurements, sample powders were mixed with epoxy resin, transferred to a silicone rubber mold, and cured for 24 h at room temperature. To expose the cross-sectional areas of the composite particles, the embedded sample was ground and polished using grit paper (320, 800, 1200, and 4000) and textile with 1 and 0.05 μm diameter-aluminum oxide suspensions. The hardness of the composite was characterized using G200 nanoindenter from Agilent Technologies (Santa Clara, CA). Indentation data were collected in continuous stiffness monitoring (CSM) mode using the conditions listed in Table II. The indenting tip was calibrated using a fused silica reference standard. Depending on the sample's surface, a 60 or 100x objective lens was used to locate suitable indenting points in the center of the individual powder particles. Between 10 and 15 different points were measured for each sample. Because the powder particles were embedded in an epoxy matrix, the effective machine compliance for each particle varied and was corrected using the approach of Buchheit et al., Reference Buchheit and Vogler42 in which the effective machine compliance is measured for each powder sample and then used to adjust the data such that the stiffness-square divided by the load is constant for all depths.
Summary of nanoindentation conditions.

III. RESULTS AND DISCUSSION
A. Particle morphology
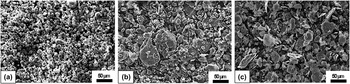
In the presented study, a total of 27 powder samples were produced and characterized. However, to limit the length of the manuscript, only data that exhibit clear trends and unambiguous correlations are shown. Figure 1 depicts the evolution in powder morphology of a CNT–Al MMC sample containing 5 wt% CNT upon cryogenic milling. After 9 × 2-min cycles, corresponding to a total milling time of 18 min, the sample contains larger, flattened particles as compared to the Al precursor powder, resulting in wide size distribution ranging from less than 5 to 100 μm or more. Prolonged milling for 90 min (9 × 10-min cycles) led to a further increase in particle size and extensive formation of flakes with roughened surfaces. Similar to other milling techniques, during cryogenic milling, powders undergo repeated cold welding, fracturing, and rewelding, which yield the observed changes in particle size and morphology. Reference Fecht43 While the average particle size and size distribution seem to be smaller than those reported for Al and Al-based MMC powders produced by high energy ball-milling, Reference Woo, Sneed, Peerally, Heer, Brewer, Hooper and Osswald41 the particle size does not decrease with milling time as observed in these studies. Further differences exist in the shape of the final powder particles, which become increasingly rounded upon ball milling and increasingly flattened during cryogenic milling. The origin for these discrepancies lies in the actual milling mechanism and will be discussed in more detail below.
SEM micrographs of Al and CNT–Al MMC powders: (a) as-received Al and (b) CNT–Al MMC containing 5 wt% CNT after milling for 18 min (9 × 2 min) and (c) 90 min (9 × 10 min).

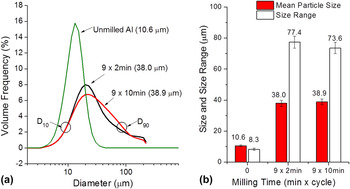
Particle size and shape are crucial process parameters for powder-based consolidation methods, particularly CS, as they directly affect the particle velocity and impact energies during processing. In most cases, particle sizes in the range 5–50 μm are desirable for CS. Reference Jodoin, Ajdelsztajn, Sansoucy, Zúñiga, Richer and Lavernia34,Reference Wang, Li, Yang, Li, Zhang and Li44 To obtain more quantitative information on changes in the particle size and size distribution of the MMC powders upon milling, we analyzed all powder samples using dynamic light scattering. Figure 2 displays the particle size distributions of the MMC samples shown in Fig. 1. The size distribution curves [Fig. 2(a)] were used to determine the average (mean) particle size and the size range of powder particles in each sample. The size range, marked as the distance between D 10 and D 90, refers to the 10- and 90-percentile diameter of the size distribution, respectively [Fig. 2(a)]. The average particle sizes and size ranges (width of size distribution) of the powders shown in Fig. 1 were measured as 10.6, 38.0, and 38.9 μm and 8.3, 77.4, and 73.6 μm for the as-received Al and the 5 wt% CNT–Al MMC milled for 9 × 2 min and 9 × 10 min, respectively. The shown values represent the average of three consecutive measurements. The error bars in Fig. 2(b) reflect the corresponding standard deviation. The size analysis using laser diffraction was in good agreement with SEM observations.
Particle size analysis of as-received Al and CNT–Al MMC powders containing 5 wt% CNT: (a) particle size distributions as-measured by light scattering and (b) corresponding average size and size range.

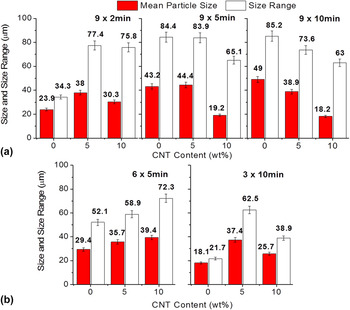
Figure 3(a) shows the effects of both CNT content and milling time on the particle size. For pure Al, both particle size and size distribution increase with milling time. This trend is reversed when CNTs are added. In the case of 10 wt% CNT–Al MMC, particle size and size distribution decrease with increasing milling time, suggesting that CNT-reinforcement agents have a large impact on the milling process. The reduction in particle size with increasing CNT content was observed in previous studies on Al-based MMC Reference Kaftelen and Öveçoğlu45,Reference Morsi and Esawi46 in which particle welding was more pronounced in the MA of powders containing 2 wt% CNT (D 50 = 1.73 mm), as compared to 5 wt% CNT (D 50 = 110 μm). Several different mechanisms may contribute to the observed behavior, including thermal, mechanical, and morphological effects. In MA, there are three competing processes: (1) work hardening of the powders, which leads to a decrease in ductility and eventual fracturing of the particles; (2) cold-welding of particles, which tends to increase the particle size; Reference Suryanarayana36 and (3) friction-induced thermal effects, which likely soften the particles and affect the cold welding behavior. Due to the ductility of pure Al, compared with 5 and 10 wt% CNT–Al composites, particle welding may be more pronounced in Al particles, leading to the large particle agglomerates with increasing milling time from 9 × 2 min to 9 × 10 min [Fig. 3(a)], implying that cold welding does not seem to be dramatically reduced in spite of the cryogenic environment. Another hypothesis is that the observed behavior may be explained by a thermal effect. At low temperatures, particles cold-weld, strain-harden, and fracture, and as a consequence, maintain or reduce their small particle size. However, at elevated temperatures, the thermal energy is sufficient to anneal the dislocation structure of the cold-welded particles, resulting in increased ductility and reduced fracturing. In this case, the reduction in particle size progresses more slowly upon milling, whereas the minimum particle size that can be achieved is dependent on the temperature conditions in the sample during milling. Due to the increased thermal conductivity of CNT-containing samples, Reference Kumari, Zhang, Du, Li, Wang, Datye and Wu47–Reference Zhang, Chen, Yoon, Ahn, Wang, Zhou, Wang and Li49 cooling of the sample during milling is more efficient, resulting in lower sample temperatures and thus reduced particle size. Therefore, for a given milling time, the milling process in CNT-containing samples has progressed more. In other words, with increasing CNT-content, it will take less time to achieve the same milling results. Figure 3(b) investigates the effects of cycle number and cycle time on the particle size, while keeping the overall milling time constant (30 min). It can be noted that for short milling times and larger number of cycles (6 × 5 min), both particle size and size range increase with increasing CNT content, similar to the 9 × 2 min condition in Fig. 3(a). If longer cycle times and a smaller number of cycles are used, particle size and size range increase for 5 wt% CNTs, but decrease when 10 wt% CNTs are added, indicating a more complex relationship between cycle time, cycle number, and CNT content.
Particle size (a) and particle size (b) range for Al and Al–CNT powders produced by cryogenic milling: (a) with increasing milling time from 9 x 2min to 9 x 10min and (b) with keeping the overall milling time constant (30 min).

The above results, however, demonstrate that the particle size of the CNT–Al MMCs can be adjusted by both milling time as well as CNT content. The mean particle sizes of the 5 and 10 wt% CNT–Al MMC powders are in the range from 18.2 to 44.4 μm, which is very suitable for use in CS applications.
B. CNT structure in composite
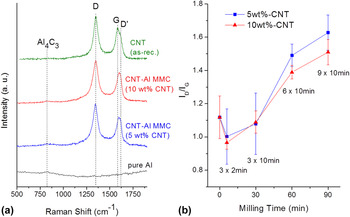
Raman spectroscopy was used to verify the presence of CNTs in the MMC particles and to evaluate the dispersion of the reinforcement agent upon milling. Figure 4 shows the Raman spectra of the CNT–Al MMCs containing 5 and 10 wt% CNTs, in comparison to pure Al and as-received MWCNTs. All samples were milled for 90 min (9 × 10 min), except the as-received MWCNTs.
(a) Raman spectra for Al and CNT–Al MMC powders milled for 9 × 10 min and (b) intensity ratio of Raman peaks (I D/I G) of CNT–Al MMCs with increasing total milling time.

The Raman spectrum of the MWCNTs shows two broad bands centered around 1350 and 1580 cm−1, known as D and G bands, respectively. Reference Osswald, Mochalin, Havel, Yushin and Gogotsi50,Reference Ferrari and Robertson51 In addition, a third feature, referred to as D′ band, is commonly observed around 1620 cm−1. The G band is a doubly degenerate, zone center phonon mode and ascribed to the in-plane vibrations of the carbon–carbon bonds. Both D band (intervalley scattering) and D′ band (intravalley scattering) result from a defect-activated, double-resonant Raman scattering process. The intensity ratio between the D and G Raman bands, I D/I G, can therefore be used to evaluate the purity and number of defects in MWCNT samples. Reference Osswald, Havel and Gogotsi52 The I D/I G of the as-received MWCNTs was measured as 1.27 ± 0.07, which is in good agreement with previous studies. Reference Poirier, Gauvin and Drew22,Reference Delhaes, Couzi, Trinquecoste, Dentzer, Hamidou and Vix-Guterl53 The milled Al sample containing only PCA does not show any notable Raman signal, suggesting that all spectral features observed in the Raman spectra of CNT–Al MMCs in the frequency range 1200–1900 cm−1 can be ascribed to the CNTs embedded in the metal matrix.
The Raman spectra of CNT–Al MMCs containing 5 and 10 wt% of CNTs, recorded after milling for 90 min (9 × 10 min), are similar to those of the as-received MWCNTs. However, while the D band is centered around 1350 cm−1, similar to the as-received MWCNTs, both the position and shape of the broad Raman feature between 1500 and 1700 cm−1 are different. The observed changes are the result of differences in the relative intensity contributions from the G and D′ Raman bands in this frequency range. Upon milling, the Raman intensity of the D′ increases relative to the G band due to the formation of additional defects during milling. Similarly, the D band increases relative to the G band, leading to an increase in I D/I G. Figure 4(b) shows the changes in I D/I G as a function of milling time for both CNT–Al MMCs. The error bar reflects the standard deviation obtained from 5 different sample spots. It can be seen that for short milling times (<30 min), the measured I D/I G is similar to the values obtained for the as-received CNTs, while for long milling times I D/I G increases substantially, approaching values as high as 1.7. This increase in I D/I G upon cryogenic milling of CNTs was observed in previous studies, Reference Wu, Wang, Yao, Liu, Chen, Lu and Cheng54,Reference Lee, Rhee and Park55 however, in this case the damage to the CNTs seems to occur particularly at the later stages of the milling process. Finally, we would like to comment on the small peak centered around 850 cm−1. This Raman feature is commonly ascribed to the formation of aluminum carbide (Al4C3). Reference Kozlov, Hirabayashi, Nozaki, Tokumoto and Ihara56
While formation of metal carbides is commonly observed during CNT-based MMC processing, Reference George, Kashyap, Rahul and Yamdagni57,Reference Ci, Ryu, Jin-Phillipp and Rühle58 due to the low processing temperatures, cryogenic milling is not expected to yield significant carbide formation. As formation of carbide is expected to occur at the metal–CNT interface, the observation of only a weak Raman signal around 850 cm−1 suggests that only trace amounts of Al4C3 are present in the sample. Raman spectroscopy is highly surface sensitive for opaque materials due to strong absorption of photons in the visible spectral range, often resulting in penetration depths of only tens of nanometers. Moreover, it should be noted that a similar peak appears in the Raman spectrum of the pure Al sample. All powders including the pure Al contain a PCA (stearic acid), which is an organic compound containing ∼32 at.% carbon. Therefore, carbide formation seems to be induced by the stearic acid rather the CNTs. This is in support off earlier studies suggesting that CNTs are thermodynamically stable in Al matrix, even at higher temperature due to their cylindrical graphitic structure. Reference Kuzumaki, Miyazawa, Ichinose and Ito11,Reference Kuzumaki, Ujiie, Ichinose and Ito59
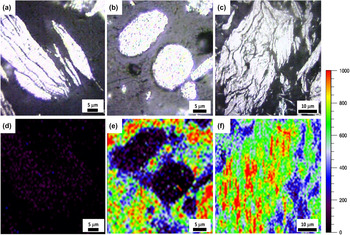
To investigate the dispersion of the CNT in the Al matrix, we recorded Raman images of the cross-section of powder particles of three selected samples. Since Al metal is not Raman active, Reference Kozlov, Hirabayashi, Nozaki, Tokumoto and Ihara56 the Raman features of CNT can be used to evaluate the dispersion of the reinforcement agent in the metal matrix. To exclude any possible overlap with Raman features of the epoxy matrix, Raman images area based on the integrated Raman intensity (area under curve) in the wave number range 1320–1420 cm−1 after baseline correction. All Raman images use the same color scale and were recorded under the same experimental conditions. The exact methodology used to obtain the Raman images displayed in Fig. 5 is explained in more detail in the supplementary section. Figure 5 shows the optical microscopy images (upper row) and the corresponding Raman images (lower row) of pure Al milled for 9 × 10 min (c, f) in comparison to a CNT–Al MMC containing 10 wt% CNT, after milling for 3 × 2 min (a, d) and 9 × 10 min (b, e). Because the cross-sectional surface was polished, the entire mapping area was in the focal plane of the objective and intensity changes can be assigned solely to the content of CNT in the Al matrix. However, it should be noted that in the presence of Al, due to the increased background signal, the integration over the Raman intensity likely yields values that are larger or smaller than zero, even though no Raman peaks are observed. Since a negative area has no physical meaning, values are plotted for the integrated intensity range of 0–1000.
Optical microscopy (upper row) and Raman images (bottom row) of (a and d) cross-sectioned Al powder particles milled for 9 × 10 min in comparison to (b and e) CNT–Al MMC powder particles containing 10 wt% CNT–Al, after milling for 3 × 2 min and (c and f) 9 × 10 min. The Raman image shows the distribution of the integrated intensity (area under curve) of CNT Raman signal in the wave number range of 1320–1420 cm−1.

It can be seen that for pure Al containing no CNTs, the observed Raman intensity is very low, as expected, and only noticeable over the Al particles due to the discussed background effect. For short milling times [Figs. 5(b) and 5(e)], strong Raman intensity is only observed around the metal particles, suggesting that the selected milling conditions are not sufficient to properly mix reinforcement agent and metal powders and to homogeneously distribute the CNTs in the Al matrix. CNTs exist primarily in the form of larger agglomerates and are co-embedded in the epoxy. For long milling times, however, the recorded Raman intensity distributions largely match the optical images taken by the digital camera of the microscope [Figs. 5(c) and 5(f)]. In this case, the CNTs are well dispersed within the Al particles. It should be pointed out that since the spatial resolution of the Raman spectrometer is limited to about 0.8 μm, statements about CNT dispersion below this spatial limit cannot be made.
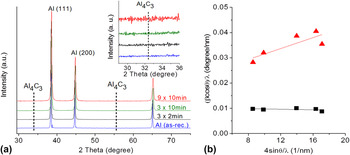
Figure 6(a) shows the XRD patterns of three CNT–Al MMC samples containing 10 wt% CNT, after milling for 3 × 2 min, 3 × 10 min, and 9 × 10 min. The XRD pattern of the as-received Al is shown for comparison. The CNT–Al MMCs exhibit the diffraction features of the Al matrix, as expected. Furthermore, it can be noted that no additional diffraction peaks were observed [inset of Fig. 6(a)], supporting our assumption that carbide formation is only an interfacial effect. Unlike Raman spectroscopy, which is highly surface sensitive in solid samples, the XRD signal requires constructive interference from many atomic layers and is thus proportional to the volume of the crystals. The intensity of the diffraction signal coming from surface layers and nanocrystals is relatively low and typically overshadowed by the much stronger XRD signal from the metal matrix. Therefore, while both CNTs and Al4C3 were detected by Raman spectroscopy, they are not observed in the XRD pattern of the MMCs (inset of Fig. 6). The result also suggests that there are no large amounts (percent volume fraction or more) of carbide in the CNT–Al MMCs investigated in the study. A closer inspection of the (111) Al peaks of the as-received Al and the milled CNT–Al MMC powder reveals a commonly observed increase in peak width upon milling, indicating a reduction in grain size and/or presence of residual lattice strain. For each powder, a plot of (βcosθ)/λ as a function of (sinθ)/λ was drawn for the first five peaks of the Al XRD spectrum as shown in Fig. 6(b). According to Eq. (1), the grain size can be calculated from the Y-axis intercept of the plot, as discussed in greater detail below.
(a) XRD analysis of as-received Al and 10 wt% CNT–Al composite powders. (Inset) The magnification of the low-angle range reveals the absence of metal carbides in the composite powders. (b) Williamson–Hall analysis was performed to determine the grain size of the Al matrix. The Williamson–Hall plot for the 9 × 10 min milled composite and as-received Al powders is shown in (b).

C. Grain size
The observed changes in XRD peak position and peak width can be used to determine both grain size and residual strain within the Al matrix after milling. In the case of milled powders, peak broadening is caused by three primary factors: reduction in grain size, presence of microstrain, and instrumental broadening. Reference He60 The existing analytical methods that use the observed broadening to determine grain size and residual strain, utilize either the full width at half maximum (FWHM) or the integral breadth (β) of the diffraction peaks. The integral breadth is the width of a rectangle with the same area as the integrated intensity for each peak and defined as
 $$\beta = {{{\rm{Area}}} \over {{I_{{\rm{max}}}}}}\quad {\rm{.}}$$
Because the peak area is little affected by the variation of peak intensity compared to maximum intensity (I max), integral breadth method is the more reliable estimate to determine the structural characteristics than FWHM; Reference He60 therefore, β was utilized in the present study to determine grain size and lattice strain.
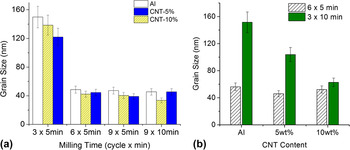
Figure 7 depicts the changes of the grain size for CNT–Al MMCs and pure Al with the different milling conditions. Both Al and CNT–Al MMC are subject to a grain size reduction with increasing total milling time. The smallest average grain sizes for all samples were found after 45 min of milling (9 × 5 min) measuring 47.2, 39.1, and 40.4 nm for Al, 5 wt% CNT, and 10 wt% CNT-containing MMCs, respectively [Fig. 7(a)]. Increasing the total milling time to 90 min (9 × 10 min) did not yield any further size reductions. Furthermore, Fig. 7(b) indicates that for long cycle times and small cycle numbers, the addition of CNTs expedites the grain size reduction, as for the same milling time (3 × 10 min), the addition of 10 wt% CNTs yields the smallest crystal size. A similar trend was observed in other MMC studies. Using mechanical attrition, Fecht and He et al. demonstrated that the presence of reinforcement agents (aluminum nitride) in the form of hard nanoparticles accelerated grain refinement in a Ni matrix, Reference Fecht43,Reference He and Schoenung61 indicating the formation of nanograins during cryogenic milling due to dynamic rearrangement of dislocations and recrystallization. Reference Zhang, Wang, Narayan and Koch62 At the same time, the CNT content does not substantially affect the final minimum grain size obtained after extended milling (9 × 10 min), suggesting that the milling temperature largely determines the final grain size; Fig. 7(b) compares the effect of the CNT content on the Al grain size for two different milling conditions. While both milling conditions are based on the same total milling time, they vary in the number of milling cycles and the respective time per cycle (cycle time). For the combination of low cycle numbers and long cycle times (3 × 10 min), the smallest grain size is achieved for the sample containing the largest amount of CNTs. In contrast, for higher number of cycles and shorter cycle times (6 × 5 min), the CNT content does not affect the final grain size. Moreover, the minimum grain size achieved is smaller than that obtained for longer cycle times. This is an important finding, as it points out that not only the total milling time is critical for size reduction, but also that cycle number and cycle time must be taken into consideration as well. The above observations might be explained as follows. During milling, the energy input of the cylindrical impactor results in a temperature increase in the powder, even at cryogenic temperatures. Since the LN is only in direct contact with the polycarbonate milling vial, heat transport through the bulk milling powder out to the LN bath may be limited, thus powder temperatures can rise far above that of the LN bath during milling. The addition of CNTs likely improves the overall thermal conductivity of the powder mixture, allowing for more effective sample cooling during cryogenic milling. Similar to the particle size, the grain size of the powders is determined by different competing mechanisms. The continued work hardening increases the dislocation density in the material. The grain size of a powder particle will be reduced as the dislocation cell size decreases. At a sufficient dislocation density, and with some thermal energy, the microstructure of the powder particle can recrystallize resulting in a significant reduction in grain size. However, friction caused by the milling media can also anneal the sample, resulting in reduction in dislocation density and in grain growth. Reference Shewmon63 The competition between the two processes determines the final grain size for a given milling condition. The addition of CNTs to the metal matrix can pin grain boundaries and thus prevent grain growth. Since the kinetics of the annealing process are significantly reduced at cryogenic temperatures, the smallest grain size that can be achieved by milling decreases with decreasing temperature.
Grain size of cryomilled Al and CNT–Al MMC powders with (a) increasing total milling time and (b) different milling configuration for 30 min total milling.

During cryogenic milling, each cycle is followed by a 2-min cooling step. Shorter cycle times minimize sample heating and the thermal conductivity of the powder would play less of a role. In this case, the temperature of the powder remains low, leading to a smaller final grain size even though the total milling time is the same as the 3 × 10 min sample. While the decrease in grain size with increasing CNT content in the case of the 3 × 10 min experiment series may also be attributed to the pinning of grain boundaries by the CNTs, it does not explain the observed behavior for short milling times. It also would require a homogeneous CNT distribution at the nanoscale, which cannot be confirmed in this study. Such a dispersion in MMCs was previously observed to make nanocrystalline structures highly stable at elevated temperatures as a barrier to the movement of grain boundaries. Reference Zhou, Liao, Zhu, Dallek and Lavernia64
D. Hardness
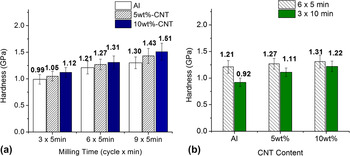
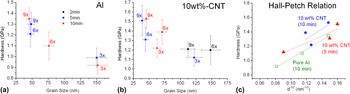
Figure 8(a) demonstrates that the hardness of Al gradually increases with total milling time, resulting from the work-hardening and crystal size reduction after cryogenic milling. For all milling times, the highest CNT content was found to yield the highest hardness. These results are consistent with the data obtained from crystal size measurements, suggesting that hardness increases are primarily linked to grain size-refinement following the Hall–Petch relation. Reference Weertman65 It should be noted that for long milling times (>30 min), the content of CNTs does not affect the final equilibrium grain size and hardness of the powders, it only accelerates the process of achieving the maximum, grain size-limited hardness. This effect and the importance of the different milling parameters on the powder hardness are emphasized in Fig. 8(b). It can be seen that the behavior of the hardness is inverse to that observed for the grain size (Fig. 7). For high cycle numbers and short cycle times, the hardness decreases with increasing CNT content. In this case, the thermal conductivity plays less of a critical role due to the more frequent cooling step between the short cycles. In fact, the CNT agglomerates as observed by Raman spectroscopy seem to act as a buffer during the early stages of milling and are slowing down the grain size reduction of the Al matrix, yielding lower hardness values. In contrast, for low cycle numbers and long cycle times, the thermal conductivity strongly affects the milling process, resulting in the highest hardness value for the sample containing 10 wt% CNTs. Since under these milling conditions the final grain size is dictated by the thermal properties of the powders, the final hardness remains lower than that of the pure Al during 6 × 5 min milling. Figures 9(a) and 9(b) show the direct relationship between hardness and grain size for pure Al and 10 wt% CNT–Al MMC powders, respectively, after milling at different conditions. For the shortest cycle time (2 min), even the largest number of milling cycles (9x) did not yield grain sizes below 150 nm. To determine the exact nature of the grain size-hardness relation, we displayed the data in a Hall–Petch style plot [Fig. 9(c)]. Given the fact that XRD-based grain size measurements become increasingly inaccurate for grains larger than ∼150 nm, as the instrumental broadening is dominating the line width of the XRD peaks, only data for the longest milling times (5 and 10 min) are shown.
Hardness of cryomilled Al and CNT–Al MMC powders; the effect of CNT content with (a) milling time and (b) different milling configuration for 30 min total milling.

Relationship between measured hardness and metal matrix grain size for (a) Al and (b) CNT–Al MMC powders containing 10 wt% CNT after cryogenic milling under different conditions, and (c) corresponding Hall–Petch plot.

The obtained data do suggest that in the case of pure Al, the hardness is controlled primarily by the grain size [Fig. 9(c)]. The hardness for the 10 wt% CNT–Al sample does increase with decreasing grain size, but the Hall–Petch relation becomes increasingly nonlinear with continued milling. This is in agreement with the data shown in Figs. 7(a) and 8(a). While the grain size [Fig. 7(a)] does not show a significant reduction when going from the 6 × 5 min to 9 × 5 min milling condition, the hardness continues to increase [Fig. 8(a)]. It should be noted that hardness measurements are sensitive to both changes in yield strength and in strain hardening. The hardness for materials with significant strain hardening may not show Hall–Petch behavior. The Hall–Petch constants from this data are calculated to be k = 0.064 MPa m1/2 and σ0 = 130 MPa for pure aluminum and k = 0.069 MPa m1/2 and σ0 = 200 MPa for Al–10 wt% CNT for the 10 min milling time. These k values are quite similar to each other and are in reasonably good agreement (k = 0.059) with those reported in the literature for pure aluminum. Reference Mukai, Ishikawa and Higashi66 These data suggest that the primary role of the CNTs in strengthening the aluminum powder is in keeping the aluminum grain size small during milling.
IV. CONCLUSIONS
CNT-reinforced aluminum composite (CNT–Al MMC) powders were synthesized by cryogenic milling. The composite powders were found to exhibit suitable particle sizes for possible use as a precursor for CS deposition. With increasing CNT content, both powder particle size and size range generally decreased. Furthermore, it was observed that the microscale dispersion of CNTs gradually progressed with milling time, while extensive milling (∼90 min) lead to tube damage, as measured by Raman spectroscopy. Interestingly, it was discovered that, although the content of CNTs has little effect on the final minimum Al grain size after extended milling, for short overall milling times with long cycle times, samples containing CNTs were subject to a more rapid grain size reduction, an effect ascribed to the improved thermal conductivity of CNT-containing powders. Furthermore, it was observed that for the same total milling time, shorter cycle times and larger number of cycles are more efficient in reducing grain size and increasing hardness, independent of CNT-content. This is an important finding as it demonstrates that even at cryogenic temperatures sample heating can play a critical role during milling, depending on the experimental conditions and the configuration of the mill.
ACKNOWLEDGMENTS
The authors would like to thank Dr. Sarath Menon (NPS) for his assistance with SEM analysis. This work was supported by the Office of Naval Research (Code 30).