


Introduction
Towards the centre of an ice cap, horizontal ice movement approaches zero and ice flows vertically downwards. For a symmetrical ice cap resting on a horizontal bed, shear stress is zero at the ice divide, and, in a region close to the ice divide, analyses based on ice-flow modelling show that longitudinal stress deviators have a significant effect on the local ice flow (Reference RaymondRaymond, 1983; Reference Dahl-JensenDahl-Jensen, 1989a, Reference Dahl-Jensenb; Reference Szidarovszky, Hutter and YakowitzSzidarovszky and others, 1989; Reference HvidbergHvidberg, 1996). These analyses assumed ice to flow according to the isotropic power law, Glen’s flow law (Reference GlenGlen, 1955),

where
 and sij
are components of strain rate and stress deviator, respectively, A(T) is a temperature-dependent rate factor (usually an Arrhenius relation), τ is the effective stress deviator, defined by the square root of the second invariant of the stress deviator tensor, and n is the power-law exponent, which was set to 3 in the analyses. n is 1–3 for polycrystalline ice (Reference Lliboutry and DuvalLliboutry and Duval, 1985), and a value of 3 is often used, as suggested by Reference PatersonPaterson (1994). Within a region around the dome corresponding to a few ice thicknesses, vertical deformation is more concentrated in the upper part than away from this region, and longitudinal surface strain rate increases to a local maximum at the dome. The surface slope drops sharply to zero within a narrow region of about 1 ice thickness from the divide. Normalized vertical profiles of velocity, stress and strain-rate components are anomalous at the divide, and gradually changing within the ice-divide region to the usual profiles seen elsewhere. Comparison between a plane-flow ice divide (a two-dimensional ridge) and an axially symmetrical ice divide (a circular dome) shows that the ice-divide region is more extended in axially symmetrical flow than in plane flow (Reference HvidbergHvidberg, 1996). In steady state, some consequences of anomalous flow in the ice-divide region are that isochrones will rise at the divide, forming a “bump” (Reference RaymondRaymond, 1983; Reference Dahl-JensenDahl-Jensen, 1989a), and that bottom temperatures will increase at the divide, forming a “hot spot” (Reference Paterson and WaddingtonPaterson and Waddington, 1986). Non-stationary conditions may affect isochrones (e.g. migration of the ice divide; Reference Nereson, Raymond, Waddington and JacobelNereson and others, 1998).
Predictions of effects of longitudinal stretching close to the ice divide depend on the assumed flow law. In ice-flow modelling based on Glen’s flow law (Equation (1)) with n = 1 (Newtonian flow), no ice-divide region with anomalous flow is formed (Reference RaymondRaymond, 1983). Glen’s flow law assumes isotropic ice, but, in general, ice found in ice sheets cannot be considered an isotropic material. The ice is isotropic at the surface, but at depth fabric changes due to temperature and deformation history (e.g. a single-maximum fabric increasing in strength with depth as observed in the Greenland Ice-core Project (GRIP) core from Summit, central Greenland, by Reference Thorsteinsson, Kipfstuhl and MillerThorsteinsson and others (1997)). Modelling based on anisotropic flow laws shows that anisotropy significantly affects longitudinal stretching close to the ice divide (Reference Mangeney, Califano and CastelnauMangeney and others, 1996, Reference Mangeney, Califano and Hutter1997; Reference Staroszczyk and MorlandStaroszczyk and Morland, 2000). These studies were based on orthotropic and transversely isotropic flow laws. Mangeney and others used a Newtonian flow law and assumed a single-maximum fabric similar to that observed in the GRIP ice core (Reference Thorsteinsson, Kipfstuhl and MillerThorsteinsson and others, 1997). They found that the region where ice flow is driven primarily by longitudinal stretching is less extended than in the isotropic case. Reference Staroszczyk and MorlandStaroszczyk and Morland (2000) used a non-linear, viscous flow law, and assumed an evolving orthotropic fabric depending only on current local strain rates and deformation, but independent of strain history. They showed that in a region near the ice divide, normalized vertical profiles of horizontal and vertical velocities differ from those for isotropic ice, while away from the near-divide region, anisotropy does not influence ice flow.
Effects of longitudinal stretching on the flow near the ice divide may be observed directly by surface strain rates or borehole deformation, or indirectly by elevations of internal radar reflection layers in the ice, which are interpreted as isochrones (Reference Nereson, Raymond, Waddington and JacobelNereson and others, 1998). Until recently, the presence of an ice-divide region with anomalous ice flow has not been shown in existing ice sheets (Reference Vaughan, Corr, Doake and WaddingtonVaughan and others, 1999). One difficulty is that ice movement is slow close to an ice divide or dome, and it is often necessary to measure strain rates over several years in order to obtain sufficient precision. In Greenland, internal layers have been observed by radar reflections, but a rise of these layers at the divide has not yet been found, although it was predicted by modelling based on Glen’s flow law (Reference Schott, Waddington and RaymondSchott and others, 1992; Reference Hvidberg, Dahl-Jensen and WaddingtonHvidberg and others, 1997a). In Antarctica, a rise of internal layers at Siple Dome could also be explained by an accumulation-rate minimum at the divide associated with wind-scouring effects (Reference Nereson, Raymond, Waddington and JacobelNereson and others, 1998). Recently, however, a rise of internal radar reflection layers at the divide of Fletcher Promontory was attributed to the existence of a region close to the ice divide with anomalous flow (Reference Vaughan, Corr, Doake and WaddingtonVaughan and others, 1999).
In this paper, high-resolution strain-net data from a local dome at Hans Tausen Iskappe, North Greenland, are analyzed for effects of longitudinal stretching close to the dome. The strain-net data are analyzed in terms of the continuity equation in order to determine present mass balance as well as the shape factor f, which is defined as the ratio of vertically averaged horizontal velocity to horizontal surface velocity. Variations of the shape factor close to the dome could be a result of longitudinal stretching. The data are compared with results from a finite-element ice-flow model.
Data
Hans Tausen Iskappe (82.5° N, 38° W) is a local ice cap in Peary Land, North Greenland (Fig. 1). The ice cap has a length of about 75 km from north to south, and a maximum width of about 50 km. It is divided into a northern and a southern part by a 15 km wide saddle. The southern part has several local domes with elevations of 1200–1300 m. In 1995, a 345 m deep ice core was drilled from surface to bedrock at the southeastern dome of the ice cap (82.5° N, 37.5° W) at an elevation of 1271 m (Reference Hammer and ThomsenHammer and Thomsen, 1998).
Overview map of Hans Tausen Iskappe from Reference Thomsen, Reeh, Olesen and JonssonThomsen and others (1996) with the drill location at the southeastern dome (cross). Elevation contours are in m a.s.l., white areas are ice-covered, shaded areas are ice-free land and black areas are water.

The overall surface topography and thickness of the ice cap have been surveyed with airborne radar, and, within a limited area of around 3 km from the drill site, surface surveys with global positioning system (GPS) and radar have mapped the surface topography and the ice thickness (Reference Gundestrup, Keller and JonssonGundestrup and others, 2001; Reference JonssonJonsson, 2001; Reference Keller, Hvidberg, Gundestrup and JonssonKeller and others, 2001). An elevation model was produced from the datasets, with an accuracy of 0.05 m within the limited area covered by the surface GPS survey and 5–10 m elsewhere (Fig. 2). Within the limited area covered by the surface radar survey, bedrock topography is relatively horizontal with variations of < 10% of the ice thickness, and ice thicknesses are 280–360 m, with an accuracy of 5 m. In this area, ice thicknesses were measured in a fine grid of profiles separated by < 300 m (Reference JonssonJonsson, 2001).
Surface topography around the southeastern dome of Hans Tausen Iskappe. Elevation contours are in m a.s.l. The reference stake (marked by an asterisk) is located close to the drill site at the dome. The strain net consists of 24 stakes (marked by open circles) placed in three concentric circles around the reference stake in the centre, in approximate directions from the reference stake of 0°, 45°, 90°, 135°,… 315° from north. The radii of the strain-net circles are approximately 0.3, 1.5 and 3 km, corresponding to around 1, 5 and 10 ice thicknesses, respectively. Observed surface velocities are shown as arrows.
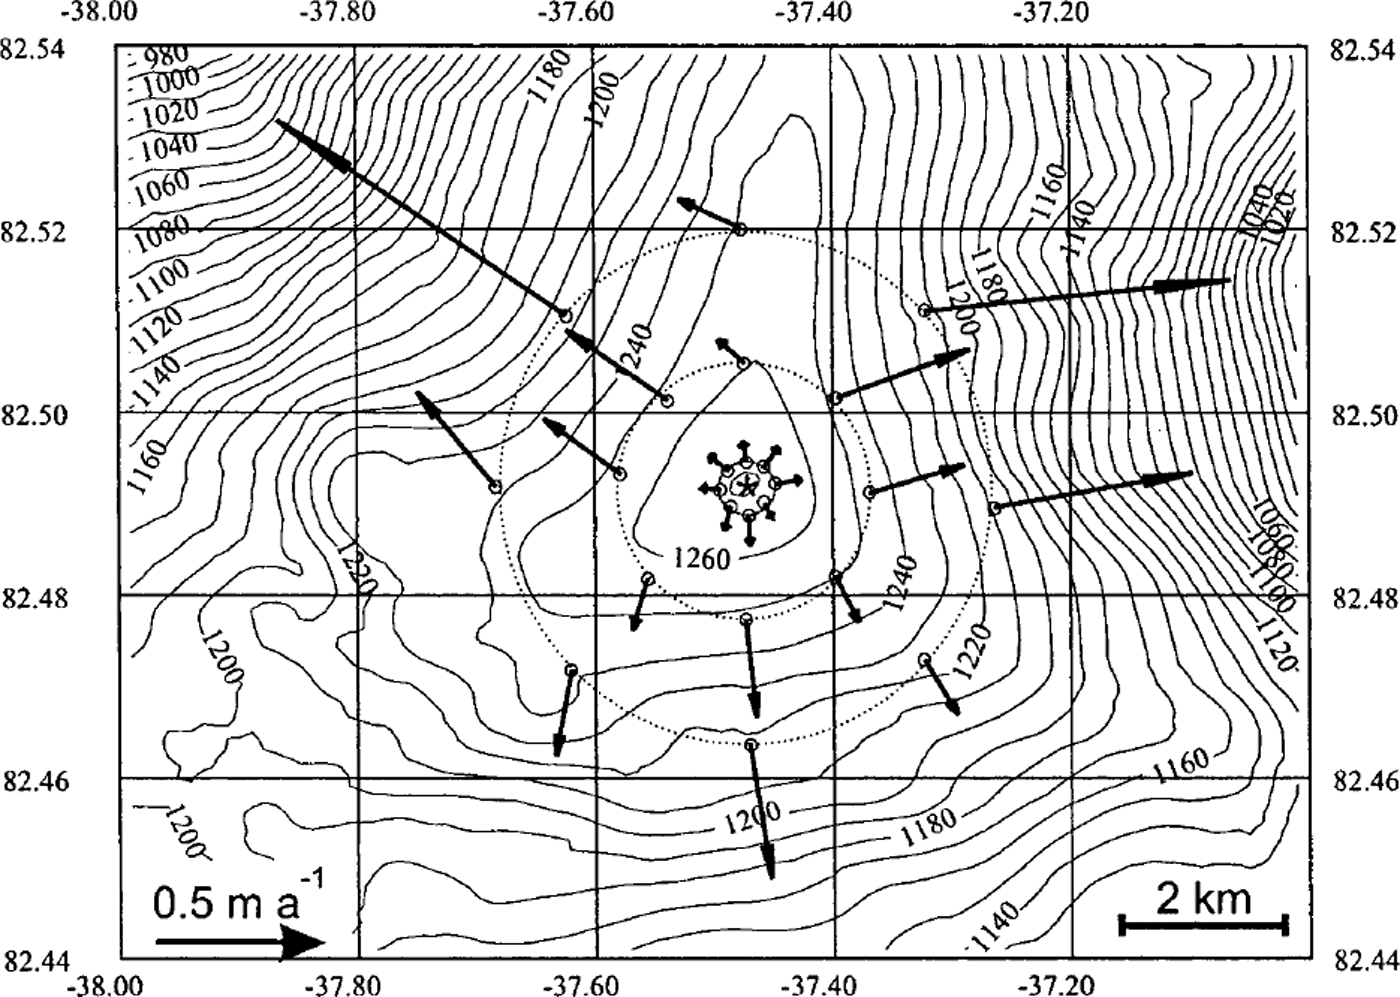
A surface strain net was established and observed with GPS over 1 year in order to determine surface movement around the southeastern dome relative to a reference stake in the centre (Reference Keller, Hvidberg, Gundestrup and JonssonKeller and others, 2001). The reference stake was placed at the top of the dome, as determined with the GPS topography data. The movement of the reference stake is within the accuracy of 0.05 m a−1, i.e. the topographic dome coincides with the point at the surface with zero horizontal velocity. Relative surface velocities measured at the stakes (Fig. 2) have an estimated accuracy of 0.03 m a−1. Relative accuracy of velocities in the inner ring is 30–50%, where velocities are small. This could be improved by observing the strain net over several years, or by averaging over a strain-net circle as done in most results reported below. Relative accuracy of velocities in the two outer rings is 3–25%, around 10% on average.
Accumulation rate at the dome was determined based on identified volcanic events in the electrical conductivity measurement (ECM) record of the ice core (Reference Clausen, Stampe, Hammer, Hvidberg, Dahl-Jensen and SteffensenClausen and others, 2001). We use an accumulation rate of 0.114 m ice equivalent a−1 (hereafter m a−1) based on an 83 year average. The accumulation rate based on a 212 year average is 0.108 m a−1. We use the 83 year average because this period is long enough to exclude year-to-year variations but short compared to the response time of the ice cap, i.e. the time the ice cap takes to adjust to a change in its mass balance. Following Reference PatersonPaterson (1994, p. 320), we find an estimated response time for Hans Tausen Iskappe of 500–1000 years (calculated as H/a 0, where H is ice thickness at the dome and a 0 is ablation at the terminus, which we estimate to be 3–6 times the accumulation rate at the dome (Reference Hammer and ThomsenHammer and Thomsen, 1998)). The accumulation rate determined similarly at two previous drill sites was about 0.035 m a−1 higher than at the dome (Reference Clausen, Stampe, Hammer, Hvidberg, Dahl-Jensen and SteffensenClausen and others, 2001). The two drill sites were located 13 km southwest and 5 km south of the dome, respectively, at 125–150 m lower elevations. This indicates an elevation dependence of accumulation rate a, which we include in our calculations as a = [2.63 × 10⁻⁴ (1271 − z) + 0.114] m a−1, where z is surface elevation measured in m a.s.l. Mass-balance studies on the northern part of Hans Tausen Iskappe indicate an additional north–south gradient (Reference Hammer and ThomsenHammer and Thomsen, 1998) which we do not include here since the data are too sparse. The accuracy of the accumulation rate is estimated to be 0.02 m a−1.
After drilling was completed, temperature was measured in the liquid-filled borehole. Temperatures increase from around −21°C at the surface to −16.3°C at the bottom, i.e. the ice is frozen at the bed (personal communication from S.J. Johnsen, 1998). The temperature distribution is close to a steady-state profile.
Description of the Strain-Net Data
Elevation contours around the dome form a triangular shape with a narrow ridge with steep sides to the north, and two broad ridges to the southeast and southwest (Fig. 2). The direction of horizontal surface velocities is perpendicular to surface contour lines, and surface velocities increase with distance to the divide. Ice flow is divergent along the ridges, particularly along the northern ridge. It is convergent in the pronounced troughs between the northern ridge and the southern ridges, while it is slightly divergent or almost plane between the two southern ridges. Ice movement is fast when the flow is convergent, slow when it is divergent. Radial components of surface velocity at the stakes and radial surface strain rates determined between stakes are plotted vs distance to the dome (Fig. 3). The widely different radial surface strain rates found particularly between stakes in the two outer strain-net rings are due to the highly non-circular (triangular) topography of the dome. Between stakes in the two outer rings, the three highest values are found between stakes with convergent flow (located approximately 45°, 90° and 315° from the north relative to the centre stake), while the four lowest values are found between stakes close to the ridges where flow is divergent (located approximately 0°, 135°, 225° and 270° from the north relative to the centre stake), as expected. The general decrease of radial surface strain rate with distance from the dome indicates the existence of a region around the dome where longitudinal surface strain rate is higher than elsewhere, with a local maximum at the dome. On average, radial surface strain rates increase from (1.4 ± 0.2) × 10−4 a−1 between the two outer strain-net circles (5–10 ice thicknesses from the dome) to (2.4 ± 1.0) × 10−4 a−1 between the centre and the inner strain-net circle (0–1 ice thickness from the dome). The sum of horizontal principal surface strain rates at the dome, derived from data in the inner ring, is
 . Uncertainties are given as twice the standard deviation.
(a) Radial component of surface velocity measured at strain-net stakes (filled triangles) and average radial surface velocity over strain-net rings (solid line). (b) Radial surface strain rate calculated between stakes in radial direction from the centre stake, plotted as functions of average distance from the centre to the stakes (open squares/dashed lines). The numbers indicate the direction from the centre to the stakes measured in degrees from north. Average radial strain rate between the strain-net rings is marked with the solid line.

Analysis of the Strain-Net Data
Surface movement data are analyzed by the vertically integrated continuity equation,

where H is ice thickness, t is time, a is accumulation rate, u and v are velocity along the horizontal x and y coordinate axes, respectively, and subscript m indicates vertical average. We assume that the vertically averaged velocity vector (u m, v m) may be expressed as (u m, v m) = f ·(u s, v s), where (u s, v s) is the horizontal surface velocity vector and f is the shape factor of the horizontal velocity profile, which is further assumed to change slowly with x and y. With this inserted, Equation (2) relates the two unknowns, f and ∂H/∂t, which we seek to estimate with our analysis.
At the dome, horizontal velocity vanishes, and Equation (2) reduces to

Away from the dome, we use two different approaches: the continuity equation integrated over each strain-net circle (the circular model), and the continuity equation solved along several flowlines, one for each strain-net stake, leading from the centre to the corresponding stake (the topographic model).
Solving the continuity equation over strain-net circles (circular model)
The continuity equation integrated over the area A covered by a strain-net circle expresses the mean rate of ice-volume change within the circle as the difference between total accumulation within the circle and total radial ice flux at the circle, i.e.

where 〈〉c indicates average over the circle area, P is the perimeter of the circle and
 is the radial component of the vertically averaged horizontal velocity. An average shape factor is now defined at the circle by
 , where
 is the radial component of the horizontal surface velocity. With
 inserted in Equation (4), we obtain

In order to estimate 〈∂H/∂t〉c, we assume that
 is given by a modelled shape factor. We use a steady-state, axially symmetrical finite-element ice-flow model based on Glen’s flow law (Reference HvidbergHvidberg, 1996), and calculate the variation of the shape factor with distance from the divide (Fig. 4). The model assumes horizontal bedrock, uniformly distributed flow properties, accumulation rate following the relation established in the previous section, and ice temperatures as measured in the borehole. The model provides an ideal axially symmetrical mean value of f. Effects from variations of convergence/divergence, bedrock topography or a pattern of ice-thickness change around the dome are neglected, as well as effects from a non-uniform distribution of flow properties (e.g. a soft bottom layer, which could change the shape factor significantly). The uncertainty of the modelled f is estimated to be 0.15 in order to take these factors into account. Of this estimate, around 0.1 is assumed to be due to effects from a non-steady-state surface topography (based on supplementary model runs), and around 0.05 due to effects from an unknown distribution of flow properties (based on previous model runs: Reference HvidbergHvidberg, 1993; Reference Hvidberg, Dahl-Jensen and WaddingtonHvidberg and others, 1997a). Bedrock topography with variations < 10% of the ice thickness as here is expected to contribute < 0.01 to the uncertainty (Reference Hvidberg, Keller, Gundestrup, Tscherning and ForsbergHvidberg and others, 1997b), and effects from convergence/divergence of the flow are assumed to be negligible when averaged over the circle. 〈∂H/∂t〉c is now found to be (+0.02 ± 0.04), (+0.04 ± 0.02) and (+0.05 ± 0.02) m a−1, for the strain-net rings with radii 1, 5 and 10 ice thicknesses, respectively. The regional mean rate of ice-thickness change, determined as the average of the results from the three rings, is 〈∂H/∂t〉 = (+0.04 ± 0.02) m a−1 (Reference Keller, Hvidberg, Gundestrup and JonssonKeller and others, 2001). Uncertainties are given as twice the standard deviation.
Variation of horizontal velocity shape factor with distance to the divide, from the circular model (squares/short-dashed line), from the topographic model (circles/long-dashed line), both with error bars (one standard deviation) and by assuming 〈∂H/∂t〉 = +0.04 m a−1 uniformly, and from an ice-flow model (see description in the text; solid line).

In order to estimate
 from the data, bounds are set up on the regionally averaged rate of ice-thickness change, 〈∂H/∂t〉. The axially symmetrical ice-flow model above predicts a shape factor f, which is 0.58 at the divide and approaches 0.8 away from the divide (Fig. 4). Theoretical analysis of isothermal ice flow at the dome of an ice sheet based on Glen’s flow law with n = 3 gives a shape factor of the horizontal velocity at the divide close to 0.5 (Reference ReehReeh, 1988). For non-isothermal conditions, as observed at Hans Tausen Iskappe, temperature increases with depth, i.e. ice becomes softer with increasing depth, implying a higher shape factor than for isothermal ice. It is therefore reasonable to assume that
 , which is in further agreement with numerical models of ice flow close to the divide (Reference RaymondRaymond, 1983; Reference Dahl-JensenDahl-Jensen, 1989a, b; Reference HvidbergHvidberg, 1996). We assume that
 , since the velocity attains its maximum at the surface and is zero at the bed. The upper bound cannot be more precise, since the distribution of flow properties with depth is unknown. In order to set up bounds on 〈∂H/∂t〉, we set
 to 0.5 and 1.0 uniformly in the strain net, as a lower and upper bound, respectively, and obtain +0.01 m a−1 ≤ 〈∂H/∂t〉 ≤ +0.06 m a−1 from Equation (5). These bounds are consistent with the general agreement that Hans Tausen Iskappe is presently building up (see discussion below). We now assume that 〈∂H/∂t〉c
= 〈∂H/∂t〉 for all three strain-net rings, and calculate
 using Equation (5) for values of 〈∂H/∂t〉 between the bounds (Fig. 5), and particularly for 〈∂H/∂t〉 = +0.04 m a−1 (Fig. 4). The general picture is that for a constant rate of ice-thickness change throughout the strain net, f increases with distance to the divide, with a slightly decreasing gradient.
Variation of horizontal velocity shape factor with distance to the divide, for the circular model (squares/dashed lines), and the topographic model (circles/full lines), both for ∂H/∂t between +0.01 and +0.06 m a−1. Error bars are excluded for clarity (see Fig. 4).

Solving the continuity equation along flowlines (topographic model)
In order to utilize the detailed surface topography data, the continuity equation is solved along flowlines leading from the dome to each strain-net stake. The method follows Reference Hvidberg, Keller, Gundestrup, Tscherning and ForsbergHvidberg and others (1997b), and is briefly described here. Along each flowline, ice flow is described in a curvilinear coordinate system, where the x axis is horizontal and follows the flowline. The direction of flow is assumed to be constant with depth, and shear stress transverse to the flowline is neglected. For each strain-net stake, a corresponding flowline is determined from the surface map by assuming that the flowline is perpendicular to surface contour lines. The model is thus based on 24 flowlines, each starting at the centre and crossing one of the strain-net stakes. Flowlines may be curved, but effects on ice flow are not taken into account by the model, as shear stress transverse to the flowline is neglected.
The equation of continuity is written

(Reference ReehReeh, 1988, Reference Reeh1989), where q is vertically integrated ice-volume flux per unit width, and R is radius of curvature of surface elevation contour lines at the intersection with the flowline (positive for divergent flow and negative for convergent flow). The solution of Equation (6) is

where C is a constant determined by a boundary condition, which specifies q(x) for one value of x. At the ice divide, we set x = 0, and q = 0 according to the assumptions. Close to the divide, we assume that R(x) = m/x, where m is a positive constant determined from the data, and with this assumption C = 0. At the strain-net stake, horizontal flux is written q = u m H = fu s H, where horizontal velocities u m and u s are in the direction of the flowline. A mean rate of ice-thickness change along the flowline is defined by

where p refers to the strain-net stake in question, and u s, f and H are the values at the stake. We estimate the uncertainty of R to be 50%, and of x to be 10%.
In order to estimate (∂H/∂t) p , we assume that f is given by the steady-state, axially symmetrical ice-flow model described above. A regionally averaged rate of ice-thickness change is found to be 〈∂H/∂t〉 = (+0.04 ± 0.02) m a−1, i.e. the same as in the circular model (Reference Keller, Hvidberg, Gundestrup and JonssonKeller and others, 2001). As above, the uncertainty is given as twice the standard deviation.
In order to estimate the average shape factor for stakes in each strain-net circle, bounds are set up on (∂H/∂t) p. (∂H/∂t) p is calculated for all stakes by assuming that f is 0.5 and 1.0 as a lower and upper bound, respectively and we obtain the same bounds on the regionally averaged rate of ice-thickness change as above, i.e. +0.01 m a−1 ≤ 〈∂H/∂t〉 ≤ +0.06 m a−1. We assume now that (∂H/∂t) p = 〈∂H/∂t〉 for all stakes throughout the strain net, and calculate average f vs average x for stakes in each strain-net circle for 〈∂H/∂t〉 between the bounds (Fig. 5), and particularly for 〈∂H/∂t〉 = +0.04 m a−1 (Fig. 4).
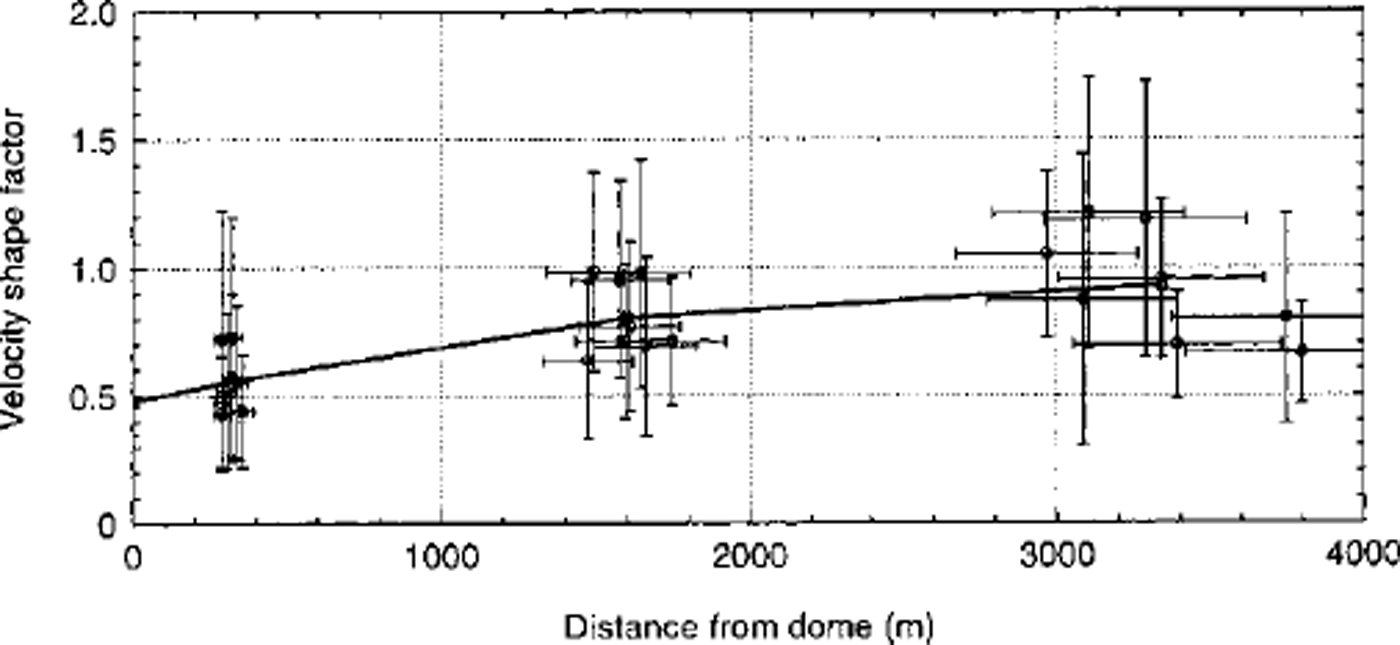
Figure 6 shows f vs x for (∂H/∂t) p = +0.04 m a−1 at all strain-net stakes. The variability of x within a strain-net ring increases with distance from the dome because of the irregular structure of the dome. Some flowlines are almost straight lines, others are curved, and in the outer ring x varies by 30%. Within each ring, f varies by 50%. The three stakes in the outer ring, which have the longest flowline distances x, also have the smallest f. These stakes are located close to a ridge with highly divergent flow along most of the flowline. Comparison between results from ice-flow models shows that f is smaller at any distance for axially symmetrical flow than for plane flow (derived from Reference HvidbergHvidberg, 1996), i.e. we may expect f to decrease with the divergence of the flow, which is in agreement with the results in Figure 6. The uncertainty is dominated by the uncertainty of R and a, except in the inner ring, where the uncertainty of u s dominates.
Horizontal velocity shape factor calculated for all strain-net stakes with the topographic model for ∂H/∂t = +0.04 m a−1 (circles) with its uncertainties (one standard deviation), and the average over strain-net rings (solid line).
Discussion
The general picture in both the topographic model and the circular model is that f increases with distance to divide with a decreasing gradient (Fig. 5). The results for the inner and middle strain-net rings are 10% larger in the topographic model than in the circular model, resulting in a sharper drop of f at the divide. However, the results of the two models are within the accuracy of each other (e.g. Fig. 4). The distribution of stakes is critical for the accuracy of the area-averaged strain-rate and flux calculations, and it may explain the difference between the two models. The circular model averages over the stakes in each strain-net circle, and it is of critical importance that the stake geometry adequately represents the topography of the dome, i.e. that ridges and troughs are represented proportionally. The topographic model provides more information along selected flowlines, and takes into account the geometry of flow along these lines. Even so, the stake geometry does not represent flowlines along the ridges, particularly not in the inner ring, where R ≥ x at all stakes. Part of the difference between the two models may also be attributable to the assumptions in the topographic model. Some flowlines in the topographic model are curved, and shear stresses transverse to the flowline may not be negligible along these flowlines, as is assumed in the model. However, the close agreement between rates of ice-thickness change for a given shape factor calculated by the two models indicates that, on average, effects of the assumptions in the topographic model are negligible.
For the middle and outer strain-net ring, small rates of ice-thickness change correspond to a velocity shape factor of > 1.0 (Fig. 5). We expect velocity to be at a maximum at the surface, i.e. f ≤ 1.0. Within our model, values of > 1.0 indicate that the assumed rate of ice-thickness change is un-realistically low, i.e. 〈∂H/∂t〉 ≥ +0.02 m a−1 in the middle strain-net circle, and 〈∂H/∂t〉 ≥ +0.03 m a−1 in the outer strain-net circle. We further expect the shape factor to be > 0.5 based on results from ice-flow models (see previous section). Values < 0.5 indicate that the assumed rate of ice-thickness change is unrealistically high, i.e. 〈∂H/∂t〉 ≤ +0.04 m a−1 at the dome and in the inner strain-net circle (with the topographic model, 〈∂H/∂t〉 ≤ +0.05 m a−1 at the inner strain-net circle).
Figure 4 compares results from the circular and the topographic models, both calculated for 〈∂H/∂t〉 = +0.04 m a−1, with results from a steady-state axially symmetrical ice-flow model. The shape factor calculated with the axially symmetrical ice-flow model is larger at the dome and smaller at the outer strain-net circle, with a less dramatic drop at the divide than obtained from the strain-net data. Figure 4 shows that if 〈∂H/∂t〉 is constant within the strain net as assumed in the circular and topographic models, the observed decrease of f around the dome is more pronounced than predicted by the ice-flow model. On the other hand, if the variation of f is as predicted by the ice-flow model, then 〈∂H/∂t〉 would increase from around +0.02 m a−1 at the dome to around +0.05 m a−1 at the limit of the strain net (cf. Fig. 5).
Hans Tausen Iskappe is far from being in a steady state. According to our analysis, the ice cap is presently thickening in the central part at a rate of about one-third of the annual accumulation. Studies of annual layers identified in the ice core by EGM show that the annual layer thickness is constant in the upper half of the ice (Reference Clausen, Stampe, Hammer, Hvidberg, Dahl-Jensen and SteffensenClausen and others, 2001), i.e. the ice cap must be thickening at present in agreement with our analysis. However, the annual layers must be thinning with depth, as the strain-net data show that vertical strain rate at the dome
 is negative. A possible explanation is that the accumulation rate decreases with time as surface altitude of the ice cap increases. Studies of ice crystals and stratigraphy in the ice core indicate that the ice cap was formed only a few thousand years ago (Reference MadsenMadsen, 1997; Reference Madsen and ThorsteinssonMadsen and Thorsteinsson, 2001).
Comparison between modelled variations of f and values derived from strain-net data may be used to constrain the model parameters, and ultimately the flow law, if ∂H/∂t is known with sufficient accuracy. However, modelling of Hans Tausen Iskappe is difficult for several reasons: the surface topography around the dome is complicated and three-dimensional with highly divergent flow along three ridges; we do not know the details of the variation of accumulation rate around the dome, nor the variation of flow properties with depth, particularly in the basal layers; the ice cap is not in steady state; and the pattern of the rate of ice-thickness change around the dome is not known. Part of the variation of f could be caused by the topography being far from steady state. Therefore, modelling of the ice flow at Hans Tausen Iskappe should be time-dependent as well as three-dimensional.
At Summit, central Greenland, a similar analysis of the mass balance showed that the central part of the Greenland ice sheet is close to steady state, with a rate of ice-thickness change at ∂H/∂t = (−0.03 ± 0.04) m a−1 (Reference Hvidberg, Keller, Gundestrup, Tscherning and ForsbergHvidberg and others, 1997b). Unfortunately, strain-net data are too sparse close to the dome at Summit, and the uncertainties too large, to allow a variation of f close to the dome to be derived from the strain-net data. Remarkable agreement can be seen at the drill site, however. The drill site was found to be 3 km northwest of the topographic dome with a surface velocity of 0.25 ± 0.06 m a−1 in the northwesterly direction (Reference Hvidberg, Keller, Gundestrup, Tscherning and ForsbergHvidberg and others, 1997b). With the topographic model used as above and assuming that ∂H/∂t = (−0.03 ± 0.04) m a−1, f = 0.72 ± 0.19 at the drill site. A simple time-scale based on ice-core data (Reference Dansgaard and JohnsenDansgaard and johnsen, 1969), which dates the ice core down to the Wisconsin–Holocene transition (11500 years BP) at 1624 m depth (the ice thickness is 3029 m) with a precision within 2 m (Reference Dahl-Jensen, Johnsen, Hammer, Clausen, Jouzel and PeltierDahl-Jensen and others, 1993), corresponds to an average value of f = 0.79. A thermomechanically coupled finite-element model based on Glen’s flow law (Reference Hvidberg, Dahl-Jensen and WaddingtonHvidberg and others, 1997a, b) gives a value of f = 0.75 at the drill site, which is within an ice-divide region with generally lower values. Away from the ice-divide region, the model predicts values of f close to 0.9. The agreement between these three independent estimates of f suggests that the ice flow at Summit can be described by Glen’s flow law, as used by the finite-element model, and that an ice-divide region with anomalous flow is formed.
Conclusion
The results of the analysis may be summarized as:
-
(1) The average radial surface strain rates increase from (1.4 ± 0.2) × 10−4 a−1 at 5–10 ice thicknesses from the dome to (2.4 ± 1.0) × 10−4 a−1 within 1 ice thickness from the dome. This shows the existence of an area around the ice divide with higher longitudinal surface strain rates than elsewhere, as predicted by ice-flow modelling.
-
(2) The regionally averaged rate of ice-thickness change, 〈∂H/∂t〉, is between +0.01 and +0.06 m a−1. If we assume that the velocity shape factor f varies with distance to the divide as predicted by an ice-flow model, we obtain a rate of ice-thickness change averaged over the strain net 〈∂H/∂t〉 = (+0.04 ± 0.02) m a−1.
-
(3) Assuming that 〈∂H/∂t〉 is uniform within the strain net, and that +0.01 m a−1 ≤ 〈∂H/∂t〉 ≤ +0.06 m a−1, the variation of f with distance to the divide is found. Then the shape factor at the dome is 0.5–0.7, and the shape factor 10 ice thicknesses away from the dome is 0.7–1.0. For 〈∂H/∂t〉 = +0.04 m a−1, f = 0.5 at the dome, and f = 0.9 at 10 ice thicknesses away from the dome.
Our analysis is highly consistent. The strain-net data are analyzed with two different approaches, which give similar results within the errors. The analysis indicates that the ice flow forms an ice-divide region with anomalous flow at Hans Tausen Iskappe. Comparison between variations of the shape factor predicted by ice-flow modelling and derived from surface strain nets may in principle be used to determine the flow law close to the divide. However, there is no basis for a more detailed comparison with ice-flow modelling here, particularly because of the significant imbalance of Hans Tausen Iskappe, and because the spatial pattern of ice-thickness change is unknown. In general, a complete analysis requires precise strain-net data around an ice divide or dome of an ice cap which is close to its steady state, or where the rate of ice-thickness change is known.
Acknowledgements
The Hans Tausen programme was sponsored by the Nordic Council under contract No. 93005. We thank the reviewers P. Jansson and C. Mayer for helpful comments which improved the paper significantly, and the Danish Natural Science Research Council and the Nordic Council of Ministers for financial support.



