INTRODUCTION
All regions in the world are affected by global climatic perturbations linked to the interaction between the ocean, the biosphere, and human activities. Climatic and environmental changes have a significant impact on biodiversity and the availability of resources, with their impact on the environment and societies being a major challenge for the coming decades (Barange and Perry Reference Barange and Perry2009; Reid et al. Reference Reid, Fischer, Lewis-Brown, Meredith, Sparrow, Andersson, Antia, Bates, Bathmann, Beaugrand and Brix2009). Since the beginning of the Holocene, archaeological human populations have settled in coastal environments and their zooarchaeological accumulations have recorded the climatic variations of the environment (Grouard Reference Grouard2010).
Atlantic South American coastal ecosystems are diverse, and their environments are changing over time. Their diversity is the consequence of variation in local geomorphology and global climatic changes. Examples from past records show that natural climate changes have affected the oceanic hydro-systems and natural ecosystems, and in particular their biodiversity and their biogeographical distribution (Murawski Reference Murawski1993; Nye et al. Reference Nye, Link, Hare and Overholtz2009). Tracking variations in past oceanographic conditions in southeastern Brazil coast is essential to understanding long term environmental and climatic variations in the region, once scarce studies are available. Past changes can be tracked through variations in the biodiversity of zooarchaeological remains and the measurement of their biogeochemical composition such as stable isotopic ratios in carbon and oxygen (δ13C and δ18O) in an established chronological time frame (Kerr et al. Reference Kerr, Secor and Kraus2007). The coast of the state of Rio de Janeiro contains a large quantity of archaeological shellmounds (called sambaquis). These archaeological sites provide evidence of coastal human settlement and activities (Figuti Reference Figuti1993; Gaspar Reference Gaspar1999). They are dated approximately between 8000 and 1000 cal BP (Lima Reference Lima1999–2000; Gaspar et al. Reference Gaspar, De Blasis, Fish and Fish2008; Tenório et al. Reference Tenório, Pinto and Afonso2008; Lopes et al. Reference Lopes, Bertucci, Rapagna, Tubino, Monteiro-Neto, Tomas, Tenório, Lima, Souza, Carrillo-Brice, Haimovici, Macario, Carvalho and Aguilera2016; Carvalho et al. Reference Carvalho, Macário, Lima, Chanca, Oliveira, Alves, Bertucci and Aguilera2018) covering a large portion of the Holocene. The construction of these shell mounds is related to funerary ritual that involved the deposition of a large amount of animal remains (Fish Reference Fish, Deblasis, Gaspar and Fish2000; Gaspar et al. Reference Gaspar, Klokler, Scheel-Ybert and Bianchini2013; Klokler Reference Klokler2016). The faunal remains from shellmounds consist of mollusk shells, shark teeth and vertebrae, teleost fish bones and otoliths (“ear stones”), and mammal bones and teeth. Their stable isotope values can be used to get an insight into past oceanographic conditions (Patterson Reference Patterson1998).
Otoliths are metabolically inert structures composed of calcium carbonate (CaCO3), usually in the aragonite form (Degens et al. Reference Degens, Deuser and Haedrich1969; Campana and Neilson Reference Campana and Neilson1985). They grow continuously throughout the life of fish and present periodic growth marks (Campana and Neilson Reference Campana and Neilson1985). Oxygen isotopes are deposited in equilibrium with ambient water isotope value (δ18Ow) and temperature (Patterson et al. Reference Patterson, Smith and Lohmann1993; Thorrold et al. Reference Thorrold, Campana, Jones and Swart1997), while carbon isotopes deposition depends on both fish metabolism and isotopic value of dissolved inorganic carbon (DIC) (Dufour et al. Reference Dufour, Gerdeaux and Wurster2007). The δ18O of otolith values (δ18Ooto) also depend on the isotopic composition of the water mass (δ18Ow) where the fish resided during their growth. Records of chemical conditions of water masses through δ18O and δ13C values of ancient otoliths can thus be used to reconstruct past freshwater (Patterson Reference Patterson1998; Dufour et al. Reference Dufour, Neer, Vermeersch and Patterson2018) and marine environments (Price et al. Reference Price, Wilkinson, Hart, Page and Grimes2009; Bertucci et al. Reference Bertucci, Aguilera, Vasconcelos, Nascimento, Marques, Macario, Albuquerque, Lima and Belém2018). Otoliths were previously used to reconstruct variation in mean temperature during the Late Holocene for two locations of the Rio de Janeiro coast: the Cabo Frio oceanographic system and Saquarema Lagoon (Bertucci et al. Reference Bertucci, Aguilera, Vasconcelos, Nascimento, Marques, Macario, Albuquerque, Lima and Belém2018).
Developments in microscopic sampling techniques associated with mass spectrometry enabled the measurement of intra-otolith isotope variations (Begg and Weidman Reference Begg and Weidman2001; Wurster et al. Reference Wurster, Patterson, Stewart, Stewart and Bowlby2005). Applying sequential sampling and isotopic analysis to well-preserved otoliths from southeastern Brazilian shellmounds provides the opportunity to get an insight into past water mass conditions at a seasonal scale.
Despite a strong option for using shell or charcoal samples for radiocarbon dating in archaeology, fish otoliths have been successfully dated in numerous studies (Scartascini and Volpedo Reference Scartascini, Saez and Volpedo2016; Carvalho et al. Reference Carvalho, Macário, Lima, Chanca, Oliveira, Alves, Bertucci and Aguilera2018). Otoliths have the potential to confirm the absolute age of individual fish, in addition to their potential to serve as proxies for studies of both seasons of site occupation and palaeoclimatic conditions.
In the present study, we analyzed whitemouth croaker (Micropogonias furnieri) otoliths recovered from two Holocene shellmounds of southeastern Brazil, Rio de Janeiro state, namely Beirada and Galeão, located near the Saquarema Lagoon and the Guanabara Bay, respectively. Zooarchaeological records associated with the Beirada and Galeão shellmounds (Kneip Reference Kneip, Crancio, Magalhães, Curvelo, Mello, Machado and Mello2001; Lopes et al. Reference Lopes, Bertucci, Rapagna, Tubino, Monteiro-Neto, Tomas, Tenório, Lima, Souza, Carrillo-Brice, Haimovici, Macario, Carvalho and Aguilera2016, Reference Lopes, Grouard, Gaspar, Sabadine-Santos, Bailon and Aguilera2022) indicate that fishing was a common activity in these sites. Estuarine resources commonly found in these shellmounds include Archosargus sp., Bagre spp., Centropomus ssp., Chaetodipterus faber, Cynoscion spp., Caranx spp., Epinephelus sp., Micropogonias furnieri, Pogonias courbina, and several sharks. Although there is no record of the offshore teleost fishery at these sites, this activity around Galeão shellmound has not been ruled out (Lopes et al. Reference Lopes, Grouard, Gaspar, Sabadine-Santos, Bailon and Aguilera2022). Whitemouth croaker has been the most abundant resource recorded in these two settlements in prehistoric times (5600–900 cal BP; Kneip et al. Reference Kneip, Crancio, Magalhães, Curvelo, Mello, Machado and Mello2001; Lopes et al. Reference Lopes, Bertucci, Rapagna, Tubino, Monteiro-Neto, Tomas, Tenório, Lima, Souza, Carrillo-Brice, Haimovici, Macario, Carvalho and Aguilera2016; Gaspar et al. Reference Gaspar, Klokler and Deblasis2018) and are still the most abundant demersal fishing resources in Brazil (Carneiro et al. Reference Carneiro, de Castro, Tutui and Bastos2005; Rodrigues et al. Reference Rodrigues, Lavrado, Falcão and Silva2007). This study has four major goals: (1) to provide for the first time a chronology for the Galeão shellmound through 14C dating, (2) to check the aragonite preservation of otoliths from the Galeão shellmound by SEM examination of the microstructure in transverse polished sections, (3) to recreate the lifecycle of the fish on the seasonal scale through sequential sampling and isotopic analysis of the otoliths annuli, and (4) to reconstruct Holocene palaeotemperature and characteristics of water masses of the Guanabara Bay and Saquarema Lagoon through intra-otolith profiles of δ18O and δ13C values.
MATERIAL AND METHODOLOGY
Study Sites and Archaeological Sites
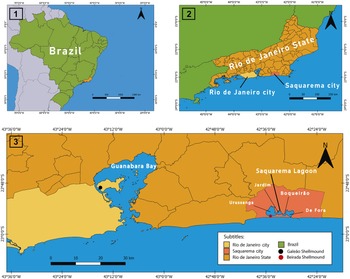
The Guanabara Bay and the Saquarema Lagoon complex are two coastal shallow water environments in southeastern Brazil (Figure 1).
Study area along the southeastern Brazilian coast showing the shellmound locations: (1) Brazil map; (2) Rio de Janeiro State covering Rio de Janeiro city and Saquarema city; (3) Galeão shellmound located at Guanabara Bay and Beirada Shellmound located at Saquarema Lagoon (composed for four connected smaller lagoons).

The oceanographic setting of the coastal shelf of southeastern Brazil is controlled by three main water masses: Subtropical Shelf Water (SSW), which is found on the inner shelf (>20°C; 35–36 salinity and 30 m depth); the warm and saline surface of the Tropical Water (TW) on the outer shelf (24–28°C; 37 salinity and 0–200 m depth) and the Central South Atlantic Water (SACW) in the middle platform (18°C; 35–36.4 salinity and 110 m depth) (Cordeiro et al. Reference Cordeiro, Belem, Bouloubassi, Rangel, Sifeddine and Capilla2014). The Guanabara Bay and Saquarema Lagoon are both under the influence of the seasonal upwelling system that develops off the shores of the city of Cabo Frio. This system is associated with the emergent deep and colder SACW, a consequence of NE winds and the coastal geomorphology of the region (Souto et al. Reference Souto, Lessa, Albuquerque, Sifeddine, Turcq and Barbosa2011; Belem et al. Reference Belem, Castelao and Albuquerque2013).
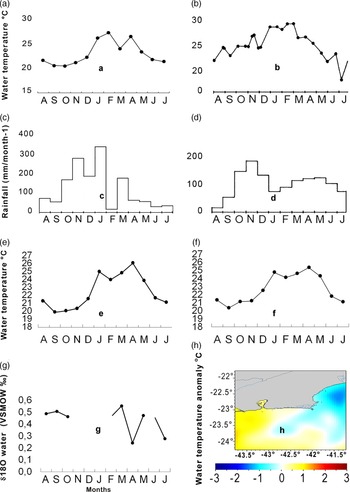
The Guanabara Bay is a semi-enclosed coastal ecosystem (Amador Reference Amador1980) connected to the Atlantic Ocean through a strait channel (Catanzaro et al. Reference Catanzaro, Baptista-Neto, Guimaraes and Silva2004). It has a surface area of 328 km2 (Kjerfvee et al. Reference Kjerfvee, Ribeiro, Dias, Filippo and Quaresma1997), which is mostly (84%) characterized by shallow water (ca. 10 m deep) (Figueiredo et al. Reference Figueiredo, Toledo, Cordeiro, Godoy, Silva, Vasconcelos and Dos Santos2014) (Figure 1). The oceanographic conditions, temperature and salinity vary seasonally, with seasonal variation in air temperature and pluviometry exhibiting large amplitudes (Table 1, Figure 2) (Eichler et al. Reference Eichler, Eichler, Miranda, Pereira, Kfouri, Pimenta, Bérgamo and Vilela2003; Soares-Gomes et al. Reference Soares-Gomes, da Gama, Baptista-Neto, Freire, Cordeiro, Machado, Bernardes, Coutinho, Thompson and Pereira2016; Kjerfvee et al. Reference Kjerfvee, Ribeiro, Dias, Filippo and Quaresma1997; World Ocean Atlas Dataset 2018; Giovanni: NASA 2019).
Environmental oscillations in salinity; water surface temperature; water surface vertical temperature (0–150 m depth) and annual rainfall of the Guanabara Bay and Saquarema Lagoon surroundings.

(a) Average annual water surface temperature inside Guanabara Bay; (b) average annual water surface temperature inside Saquarema Lagoon; (c) Average annual rainfall inside Guanabara Bay; (d) average annual rainfall inside Saquarema Lagoon (modified from Carmouze et al. Reference Carmouze, Knoppers and Vasconcelos1991); (e) average annual water temperature on the Guanabara Bay front; (f) average annual water temperature on the Saquarema Lagoon front; (g) available δ18OW data around Saquarema Lagoon front (‰) (data from Venancio et al. Reference Venancio, Belem, dos Santos, Zucchi, Azevedo, Capilla and Albuquerque2014); (h) sea surface temperature anomaly – NOAA Global Coral BTeaching Monitoring: 5 km. V.3.1. Monthly. 1995–present; 1999-02-16T00:00:00Z. (Data courtesy of NOAA/NESDIS/STAR Coral Reef Watch program.)

The Galeão shellmound was built on the western side of the Guanabara Bay approximately 900 m away from the shoreline on a hill of the coastal massifs (CNSA 2018). Site excavation was conducted by M. Gaspar in 2015, at the Tom Jobim International Airport in Ilha do Governador (22°82'02"S, 43°24'05"W). This site was described by Gaspar (Reference Gaspar2015) but had not yet been dated.
The Saquarema Lagoon system is complex, composed of four interconnected lagoons (Urussanga; Jardim; Boqueirão and De Fora), with an average depth of 1.30 m and a maximum depth of 2.80 m (Costa-Moreira Reference Costa-Moreira1989) (Figure 1). It is located approximatively 60 km from the Cabo Frio region. The regional environmental conditions are summarized in Table 1 and Figure 1, following data published by Costa-Moreira (Reference Costa-Moreira1989), Carmouze et al. (Reference Carmouze, Knoppers and Vasconcelos1991), and the World Ocean Atlas Dataset Giovanni database (Giovanni: NASA 2019). There is a wedge of cold water which has developed in Saquarema, under the influence of seasonal upwelling (Carbonel Reference Carbonel1998).
The Beirada shellmound (22°92'58"S, 42°54'40"W) was formed over a sandy dune in the coastal plain contiguous to the Saquarema Lagoon (Kneip et al. Reference Kneip, Pallestrini, Crancio and Machado1991) (Figure 1). It is located on the sandbank and partially isolated from the coast by an extension of the sandy bar. The width of the sandbank is variable but the shellmound has a total area of 1890 m2 and its height is 5 m (Kneip et al. Reference Kneip, Crancio and Francisco1988).
Unlike the Galeão shellmound, a lot of radiocarbon data are available for the Beirada shellmound. The study of Kneip et al. (Reference Kneip, Pallestrini, Crancio and Machado1991) indicates an uncalibrated age of 4520 ± 190 BP, and Lopes et al. (Reference Lopes, Bertucci, Rapagna, Tubino, Monteiro-Neto, Tomas, Tenório, Lima, Souza, Carrillo-Brice, Haimovici, Macario, Carvalho and Aguilera2016) support ages varying between 5595–3035 cal BP, close to the data found by Barbosa-Guimarães (Reference Barbosa-Guimarães2011), which is between 5255 and 3305 BP.
Micropogonias furnieri Archaeological Otoliths
The shellmounds are not formed by a continuous horizontal deposition, as this is a dynamic process, in which stratigraphic inversions are common (Fish et al. Reference Fish, Deblasis, Gaspar and Fish2000; Villagran et al. Reference Villagran, Klokler, Nishida, Gaspar and Deblasis2010; Gaspar et al. Reference Gaspar, Klokler, Scheel-Ybert and Bianchini2013).
A total of eight whitemouth croaker otoliths from the Guanabara Bay were used in this study. The two otoliths that were dated in this article (GS-745 and GS-746), as well as the other otoliths (GS-743, GS-744, GS-1073, GS-1077, GS-762, GS-1151), come from the base of the Galeão shellmound, once the top of this site was destroyed by anthropic changes. As there were not many Micropogonias furnieri otoliths due to the high anthropic impact in this site, the sampled otoliths were the largest found in the shell mounds. However, we prioritize the right otoliths (the most numerous). The otoliths selected have different sizes from each other. The GS-743, GS-745, GS-746, GS-762, GS-1073, GS-1077, and GS-1151 otoliths are the right ones, while GS-744 is the left one.
Two otoliths of whitemouth croaker (BS-809 and BS-810) were related to Saquarema Lagoon, from the top of the Beirada shellmound, and both otoliths are the left ones.
Whitemouth Croaker Ecology
Whitemouth croaker otoliths have been previously used as environmental proxies (Volpedo and Cirelli Reference Volpedo and Cirelli2006; Aguilera et al. Reference Aguilera, Belem, Angelica, Macário, Crapez, Nepomuceno, Paes, Tenorio, Dias, Souza, Rapagna, Carvalho and Silva2016; Bertucci et al. Reference Bertucci, Aguilera, Vasconcelos, Nascimento, Marques, Macario, Albuquerque, Lima and Belém2018). The biology and ecology of this species is well described in general and specifically for southeastern Brazil (Albuquerque et al. Reference Albuquerque, Miekeley, Muelbert, Walther and Jaureguizar2012; Franco et al. Reference Franco, Albuquerque, Santos, Saint’Pierrec and Araujo2018).
The whitemouth croaker is a long-lived species that can live for over 45 years (Santos et al. Reference Santos, Costa and Araújo2017) and reach a maximum size of 71 cm (Nakamura et al. Reference Nakamura, Inada, Takeda and Hatanaka1986; Haimovici and Ignacio Reference Haimovici, Ignacio, Rossi, Cergole and Ávila-da-Silva2005). It lives in a maximum water depth of 60 m (Cervigón Reference Cervigón1993), preferring temperatures between 16.5 and 28°C (Kaschner et al. Reference Kaschner, Kesner-Reyes, Garilao, Rees and Froese2016) and salinity ranging between 0 and 36 Practical Salinity Unit (PSU) (Franco et al. Reference Franco, Albuquerque, Santos, Saint’Pierrec and Araujo2018). Spawning usually occurs on the internal platform and the larvae grow in shallow estuarine environments (Vazzoler Reference Vazzoler1991; Costa and Araújo Reference Costa and Araújo2003; Albuquerque et al. Reference Albuquerque, Miekeley, Muelbert, Walther and Jaureguizar2012). Three different behaviors are recorded in the coastal areas of Rio de Janeiro as: marine migrant (with a unique movement from the estuarine area towards the adjacent platform in the adult phase); estuarine visitor (with movements from the estuarine area towards the adjacent platform when adult, multiple times throughout their lifespan); and nearshore resident, the most common behavior (with permanence in the adjacent coastal areas influenced by estuarine systems) (Franco et al. Reference Franco, Albuquerque, Santos, Saint’Pierrec and Araujo2018).
Radiocarbon Dating
The two otoliths (GS-745 and GS-746) from the base of the Galeão shellmound were first pretreated with HCl and converted to CO2 by hydrolysis with H3PO4.The reaction at room temperature overnight, caused the dissolution of CaCO3 and the release of carbon dioxide (CO2). After reaction, CO2 was purified in a vacuum system and placed in a graphitization tube, where graphite was formed by baking at 550°C for 7 hr (Macario et al. Reference Macario, Alves, Chanca, Oliveira, Carvalho, Souza, Aguilera, Tenorio, Rapagnã, Douka and Silva2016).
Graphite was analysed with a 250 kV SSAMS from the National Electrostatic Corporation, and the isotopic carbon ratios of 12C, 13C, and 14C were determined. Results were normalized using standards taken from the National Bureau of Standards (oxalic acid SRM 4990 c). The radiocarbon age was calibrated using the Oxcal 4.2 software (Bronk Ramsey and Lee Reference Bronk Ramsey and Lee2013), using the Marine20 curve (Heaton et al. Reference Heaton, Köhler, Butzin, Bard, Reimer, Austin, Bronk-Ramsey, Grootes, Hughen, Kromer, Reimer, Adkins, Burke, Cook, Olsen and Skinner2020) and the reservoir effect correction value ΔR= –270 ± 130 calculated for the coast of southeastern Brazil for the period before 4 ka (Macario et al. in prep).
Annuli Observation
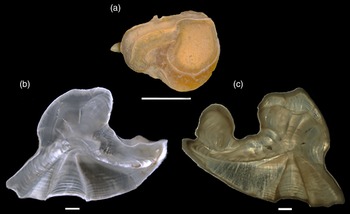
All otoliths—except for the two otoliths from the Galeão shellmound that were used for radiocarbon dating—were cleaned with 70% ethanol and embedded in epoxy resin (Fluka–BioChemica) following the procedure of Secor (1991). Resulting resin blocks were dried at room temperature and cut in cross sections of 0.8-mm thickness, using a low rotation saw (IsoMet). Sections were manually polished using various grit sizes and then were fixed onto glass slides. They were photographed using a stereomicroscope Leica DM RXP in both reflected and transmitted light to observe growth features made of opaque and translucent zones (Figure 3). The opaque zones appear dark in transmitted light and bright in reflected light. The opposite is observed for translucent zones. Opaque and translucent zones are characterized by different relative proportions of calcium carbonate and organic matrix. One opaque and one translucent zone represent one year of growth (Panfili et al. Reference Panfili, Pontual, Troadec and Wright2002). The formation of translucent zones in whitemouth croaker otolith, when observed in transmitted light, occurs in autumn/winter (May–July) in the Ubatuba Bay, in southeastern Brazil (Santos et al. Reference Santos, Costa and Araújo2017). In this study, three readers interpreted the annuli reading. Fish size and age estimations methods are available in the Supplemental Material.
Whole otolith prior to cutting, scale bar 10 mm: (a) image of sample GS-745 in reflected light (b) and transmitted light (c), scale bar of 0.78 mm.

Otolith Preservation
Seven specimens from the Guanabara Bay (GS-743, GS-744, GS-745, GS-746, GS-762, GS-1073, and GS-1151) were examined to evaluate the integrity of the archaeological otolith microstructure. The surface of the sections were etched with acetic acid for 45 seconds in order to reveal growth features (Dufour et al. Reference Dufour, Cappetta, Denis, Dauphin and Mariotti2000). For these observations, Scanning Electron Microscope (SEM) analyses in the secondary electron mode were performed using a MEB–FEG Zeiss Ultra55 equipped with Leica EM SCD500 at the service of MEB of the Institut de Minéralogie, de Physique des Matériaux et de Cosmochimie (IMPMC), MNHN, Paris. Images were taken at 15.00 kV, with a field of view going from 8.46 mm to 500 μm. Otolith microstructure is characterized by bipartite daily increments made of light (L-Zone) and narrow dark (D-zone) zones (Campana Reference Campana1984; Campana and Neilson Reference Campana and Neilson1985) as well as needle-shaped crystals (Cook et al. Reference Cook, Mocuta, Dufour, Languille and Bertrand2018). Transects crossing the entire otoliths were examined for each specimen but we especially focused on the external border as it is more prone to diagenetic alteration (Cook et al. Reference Cook, Languille, Dufour, Mocuta, Tombret, Fortuna and Bertrand2015).
Stable Isotopic Analysis of Otoliths
The otoliths that had the most visible growth zones when observed in stereomicroscopy were selected for isotopic analysis: four otoliths from the Guanabara Bay (GS-745, GS-762, GS-1073, GS-1151) and two otoliths from the Saquarema Lagoon (BS-809 and BS-810). Sequential micro-sampling was performed from the core to the edge using a Micromill device (New Wave Research) at the Muséum national d’Histoire naturelle (MNHN) in Paris. Between 30 and 60 sub-samples were generated per otolith according to the size of each specimen. The most visible growth zones were digitized to acquire main sampling paths as a series of three-dimensional coordinates that were interpolated (Gerdeaux and Dufour Reference Gerdeaux and Dufour2012). Intermediate paths were then calculated, spaced at a distance varying between 47 and 254 μm. Each path was drilled at a depth of 50–90 μm and the resulting powder (corresponding to a sub-sample) was collected manually using a scalpel tip.
Isotopic values of all sub-samples of aragonite were measured with a Delta V Advantage mass spectrometer coupled to a Kiel IV device (Thermo®) at the Service de Spectrometrie de Masse Isotopique (SSMIM) of the MNHN. All results were calibrated using NBS-19 international standards and reported as delta, in parts per thousand (‰) following the Vienna Pee Dee Belemnite standards (VPDB). Each run was comprised of the analysis of 38 aragonite sub-samples and eight measurements of the SSMIM internal laboratory standard (Marble LM). The isotopic values of the internal laboratory standard (δ13C = +2.13‰ and δ18O = –1.83‰) are corrected to the international standard NBS-19 (δ13C = +1.95‰ and δ18O = –2.20‰). Repeated measurement was used to correct those of sub-samples and to determine the precision of the mass spectrometer that was ± 0.02 ‰ for δ13C and δ18O during measurement of the Guanabara Bay samples, and 0.05‰ and ± 0.03‰ during measurement of the Saquarema Lagoon samples for δ13C and δ18O, respectively. For the interpretation of intra-otolith isotopic profiles, a cycle and a peak were defined as the variation between two successive lowest δ18Ooto values observed within each profile, with a larger amplitude characterizing a peak.
Palaeotemperature Estimation
Relating δ18Ooto values to the succession of growth marks allows us to reconstruct seasonal variations in temperature from intra-otolith isotopic profiles (Høie and Folkvord Reference Høie and Folkvord2006). However, reconstructing palaeotemperatures from δ18Ooto values is not straightforward since δ18Ooto values also depend on the isotopic composition of the water mass (δ18Ow) where the fish resided while growing. Whitemouth croakers have three different types of behavior: marine migrant, estuarine visitor, and nearshore resident (Franco et al. Reference Franco, Albuquerque, Santos, Saint’Pierrec and Araujo2018). There are variations in δ18Ow values among these habitats. Therefore, it is necessary to determine which habitats the fish frequented over their lifetime before estimating palaeotemperature through δ18Ooto values.
Nevertheless, due to the demersal behavior of this species linked to the strong vertical thermohaline stratification in the bay and the Saquarema Lagoon (Costa-Moreira and Carmouze Reference Costa-Moreira and Carmouze1991; Cotovicz et al. Reference Cotovicz, Knoppers, Brandini, Costa Santos and Abril2015), it is possible to establish meaningful derived palaeotemperature estimations using an equation specifically for the mixed water of this region.
In order to estimate temperature based on otolith samples, we used a palaeothermometry equation built for a marine Sciaenidae, the Atlantic croaker (Micropogonias undulatus) (Thorrold et al. Reference Thorrold, Campana, Jones and Swart1997), that was adapted for wild withemouth croaker (Bertucci et al. Reference Bertucci, Aguilera, Vasconcelos, Nascimento, Marques, Macario, Albuquerque, Lima and Belém2018):
δ18Ooto – δ18Ow = 3.32 – 0.21*(T°C)
δ18Ow is the δ18O value of ambient water in VPDB scale. Water values measured in isotopic standard for water “Vienna Standard Mean Ocean Water” (VSMOW) thus need to be corrected by subtracting 0.27‰ (Hut Reference Hut1987) before being used in the equation.
The isotopic composition of the main water masses along the Rio de Janeiro continental shelf has been characterized along Cabo Frio and the Guanabara Bay front by Venancio et al. (Reference Venancio, Belem, dos Santos, Zucchi, Azevedo, Capilla and Albuquerque2014). Consistent differences in δ18O among water masses enable them to be distinguished. Considering there is no isotopic characterization of δ18Ow for the specific regions, we used δ18Ow data measured on the southeastern Brazilian shelf region and adopted for each water mass in VPDB (Table 2).
Thermohaline coefficients and isotopic end-members for water masses types (Taken and modified from Venancio et al. Reference Venancio, Belem, dos Santos, Zucchi, Azevedo, Capilla and Albuquerque2014).

a Values for winter condition (May–October)
b values for summer condition (November–April).
After calculating water temperature based on Thorrold et al. (Reference Thorrold, Campana, Jones and Swart1997) using δ18Ow values for three distinct water masses, the relative temperature could be calculated from the percentages quoted for each predominant water mass in this region through the oceanographic mixing model for this upwelling zone (Venancio et al. Reference Venancio, Belem, dos Santos, Zucchi, Azevedo, Capilla and Albuquerque2014).
Only oceanographic data collected in up to 60 m depths were considered, since this represents the maximum depth reached by whitemouth croakers (Cervigón Reference Cervigón1993). All derived δ18Ooto-palaeotemperature values obtained from the otolith core region were excluded since this could be a result of oscillations modelled by ontogeny in fish (Sadovy and Severin Reference Sadovy and Severin1994).
Data Treatment
The analyses were performed using the statistical tool R (R Development Core Team 2008). Here we follow criteria using a normality test, a one-way ANOVA and a Tukey post-hoc test to perform a series of comparative analyses: (1) pooled δ18O data (total isotopic values) from Guanabara Bay against δ18O pooled data from Saquarema Lagoon; (2) data of δ13C samples from Guanabara Bay against the of δ13C from Saquarema Lagoon; and (3) the data values of δ18O and δ13C of each sample individually in both locations.
RESULTS
Otolith Preservation
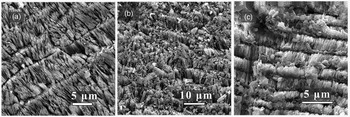
None of the analysed otolith sub-samples presented diagenetic alteration by SEM and no evidence of recrystallization was detected. Clear bipartite features representing daily increments perpendicular to the direction of the otolith growth axis are observed, as well as characteristic needle-shaped fibres of aragonite radially oriented are observed at the center, central and border zones (Figure 4, a, b, c).
Whitemouth croaker otoliths from the Guanabara Bay; transverse sections: (a) image at the core of specimen GS-743 showing daily increments composed of incremental and discontinuity zones and needle-shaped crystals radially oriented; crystals are interrupting through the discontinuous zone. (b) image of the central zone of sample GS-1073, showing needle-shaped crystals radially arranged. (c) zoomed in image of the edge of sample GS-1151, showing needle-shaped crystals and daily increments.

Radiocarbon Dating of the Galeão Shellmound
The results of radiocarbon analysis from otolith samples of the Guanabara Bay are available in Table 3 and Figure 5. A previous review reported 17 radiocarbon determinations on nine shell mounds from the region and showed that the occupation of the northeast of the bay occurred around 5604–5335 years cal BP (Gaspar et al. Reference Gaspar, Bianchini, Berredo and Lopes2019). Our results contribute to the chronology of the Guanabara bay shell mounds complex, once it represents an older occupation than report until this time indicating a maximum range varying between 5820–4980 cal BP, with respect to the residual base portion of the shellmound.
Conventional radiocarbon ages (BP years) (Stuiver and Polach Reference Stuiver and Polach1977) and calibrated ages (BP) based on Holocene otoliths of Micropogonias furnieri recovered from Galeão shellmound.

Calibrated ages based on whitemouth croaker otolith samples from top of the Galeão shellmound, using OxCal v 4.2.3 (Bronk Ramsey and Lee Reference Bronk Ramsey and Lee2013). Samples GS-745 (base portion: 60 cm); GS-746 (base portion: 20–50 cm). This figure shows ages obtained by radiochronology (vertical lines). The error bar is represented by horizontal lines.

Stable Isotopic Results
Pooled isotopic data of analysed otoliths showed a large range of variation in the δ18Ooto from Guanabara Bay and for δ13Coto from Saquarema Lagoon specimens (Table 4).
Oxygen isotopes data (δ18O and δ13C) obtained from growth zones of whitemouth croaker otoliths. The cyclic amplitude in δ18O is expressed as the mean (SD) of the range between the highest (Max) and the lowest (Min) values of each δ18O cycle. SD: standard deviation. Min: Minimum values observed; Max: maximum values observed.

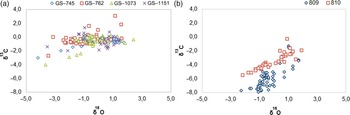
The isotopic data from the Guanabara Bay ranged from –4.03 to +3.13 ‰ and from –4.18 to +2.42‰ for δ18Ooto and δ13Coto, respectively (Figure 6; Appendix I). Analysis reveals no statistical differences in δ18Ooto among samples from four Guanabara Bay specimens (F = 1.4463; df = 3; P = 0.2), and significant differences between δ13Coto values from these four specimens (F = 7.8337; df =3; P < 0.01). Tukey post-hoc tests between δ13Coto showed that the specimen GS-762 differs from the others: GS-762 vs. GS-1073 (P < 0.05), GS-762 vs. GS-1151 (P < 0.01), and GS-762 vs. GS-745 (P < 0.01). Variability in δ18Ooto for the Guanabara Bay specimens suggests that all fish inhabited the same environment, which means that they possibly remained at the Guanabara Bay surroundings, probably mostly inside of the Guanabara Bay. The analysis of fish size, age estimation, and fish movements throughout their life cycle are available in the Supplemental Material.
Cross tabulated data of δ13C and δ18O (‰ –VPDB): (a) otolith samples from the Guanabara Bay; (b) otolith samples from the Saquarema Lagoon.

The isotopic data for the Saquarema Lagoon specimens (n = 2) ranged from –2.3 to +1.9 ‰ for δ18Ooto and from –7.9 to –1.3 ‰ for δ13Coto (Figure 6; Appendix I). Analysis of δ18Ooto between Saquarema Lagoon specimens reveals statistical differences (F = 3.8597; df = 1; P = 0.05), and also shows no correlation between δ13Coto values of the specimens (F = 75.466; df =1; P < 0.01). The average amplitudes of δ18Ooto observed is 2.14 (SD = 0.76), higher than in the Guanabara Bay samples (Table 4). However, the range between samples in this site is smaller when compared to the Guanabara Bay specimens +4.0 to +3.50‰ and +4.60 to +4.80 ‰ for δ18Ooto and δ13Coto, respectively (Table 4). The absence of large ontogenetic variation for BS-809 and BS-810 (Figure 7) also suggests that the fish occupied the lagoon region throughout their entire lives.
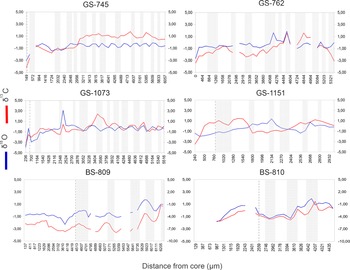
Values of δ13C (‰–VPDB) and δ18O (‰–VPDB) recorded from otoliths of whitemouth croaker of Guanabara Bay (GS) and Saquarema Lagoon (BS). δ18O is shown in blue and δ13C in red. Each graph represents an individual isotopic profile obtained by micro drilling from the core to the edge (left to right) of samples in reflected light. Dark rectangles show samples from autumn/winter (translucent zones). The blank spaces show trends designed for the subsamples that were lost due to insufficient carbonate collected. The dotted lines show the end of the core samples. The sample GS-762 was not sampled in the core once it was difficult the visualization of the growth bands. (Please see online version for color figures.)

Analysis of pooled δ18O data from the Beirada as compared to the Guanabara Bay specimens reveals significant differences in palaeoceanographic condition signals (F = 844; df = 1; P < 0.01) between these environments, while analysis of pooled δ13Coto data shows similarities (F = 3.578; df = 1; P = 0.06), possibly associated with productivity environments and fish metabolic patterns.
Intra-Otolith Isotopic Profiles of the Guanabara Bay
All individuals from the Guanabara Bay showed similar intra–otolith isotopic profiles over their lives with an ontogenetic change that separates two phases (Figure 7). The first part of the profiles representing the early life phase recorded the lowest δ18Ooto and δ13Coto values. The second phase was characterized by more or less regular variations made up of cycles and peaks until the death (capture) of the fish. For the specimens studied, the second part of the profiles shows quasi-sinusoidal variations, with 11 complete and one incomplete cycle for GS-745, and nine complete and one incomplete cycle for GS-1073. In addition, GS-1073 presents one large (high) peak in δ18Ooto (Figure 7). The δ13Coto values also varied but with less regularity for both specimens (Figure 7). The δ18Ooto cycles of GS-762 and GS-1151 were irregular:
GS-1151 showed three δ18Ooto small peaks and GS-762 had four irregular peaks. Moreover, variations in δ13Coto values were irregular and not synchronous to the δ18Ooto values. The highest δ18Ooto peak range was observed in the first (3.71‰) and third cycles (3.46‰) of GS-1073 reflecting core and spring/summer, respectively and also observed in the first cycle of GS-745 (2.78‰) in spring/summer. Additionally, the highest δ13Coto ranges in peak values were found in the first peak of GS-1151 (4.60‰), reflecting partially in the core and spring/summer and also the first cycle of GS-745, in spring/summer.
The intra-otolith profiles of the Guanabara Bay specimens had minimum values ranging between –4.03 to –1.38‰; and maximum values between +1.30 and +3.13‰. The mean δ18Ooto amplitude was 1.27 (SD = 0.27) (Table 4), GS-1151, the youngest specimen, showed the biggest δ18Ooto amplitude (+1.54).
Intra-Otolith Isotopic Profiles of the Saquarema Lagoon
Statistical variability in δ13Coto and δ18Ooto suggests that the two fish recovered at the Saquarema Lagoon experienced different isotopic signals along the Saquarema Lagoon. Contrary to the Guanabara Bay otoliths, BS-809 did not exhibit an ontogenetic shift that separated early and later life phases. The presence of a shift cannot be documented for BS-810, for which the isotope values are missing at the core of the otolith. Large but irregular patterns in δ18Ooto variations are observed for both specimens. At least four complete (one portion of the profile presented missing values) and one incomplete cycle were observed for BS-809 while BS-810 presented at least four complete and one incomplete cycle (Table 4). Nine δ13Coto cycles were observed for BS-809 and six cycles for BS-810 (Figure 7). Ranges in δ13Coto of +2.3 and 3.0‰ were observed on the firsts cycle of BS-809 and BS-810, respectively, which coincide with spring/summer.
The biggest δ18O values are found in an opaque zone for BS-809 and in a translucent zone for BS-810. The highest δ18Ooto peak ranges were observed in the first cycles of BS-809 (partially in the core and autumn/winter) and BS-810 (core). The absence of large ontogenetic variations for BS-809 and BS-810 (Figure 7) also suggests that the fish occupied a lagoon region throughout their lives and had never been in a fully marine environment.
The intra-otolith characteristics of the Saquarema Lagoon specimens show cyclical variations in δ18Ooto values with minimum values ranging between –2.30 and –2.20‰, and maximum values ranging between +1.70 and +1.30‰. The mean values correspond to –0.45 and –0.05 for BS-809 and BS-810. (Table 4). Moreover, the intra-individual variation between the Saquarema Lagoon specimens (+4.0 to +4.10‰) and amplitudes observed (+1.60 and 2.68‰) is higher than in the Guanabara Bay specimens (Table 4).
Estimation of Seasonal Water Palaeotemperature Based on Fish Otoliths from Guanabara Bay and Saquarema Lagoon
The study Venancio et al. (Reference Venancio, Belem, dos Santos, Zucchi, Azevedo, Capilla and Albuquerque2014) derived δ18O palaeotemperature estimations from the three water masses of the Rio de Janeiro coast: Subtropical Shelf Water (SSW) on the inner shelf, Tropical Water (TW) on the outer shelf, and the Central South Atlantic Water (SACW) in the middle platform.
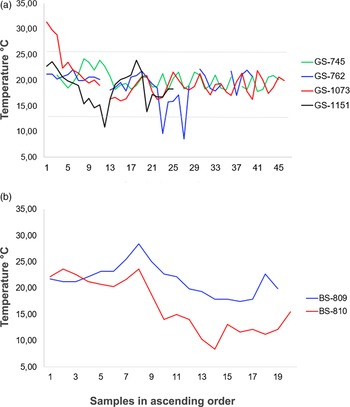
Using these data, 153 palaeotemperatures were calculated from the isotopic values based in the analysed otoliths from Guanabara Bay. Core values were excluded and considering the values for the SACW water mass (VSMOW = 0.40/VPDB = 0.13‰), the values of the temperatures estimated from the archaeological otoliths ranged from 7 to 30°C. Using the SSW (VSMOW = 0.0/VPDB = –0.27), oscillation was between 5 and 28°C, whereas using the TW (VSMOW = 1.35/VPDB = 1.08), temperatures ranged from 12 to 34°C. The relative temperature calculated from the percentage quoted for each water mass ranged from 8 to 31°C (mean = 19.57°C). The δ18Ooto palaeotemperature records show an overlap between samples (Figure 8a).
Derived δ18O palaeotemperature: (a) Holocene Guanabara Bay; (b) Holocene Saquarema Lagoon. The x-axis represents the number of samples in ascending order.

Data from autumn/winter range between 8 to 28°C and for spring/summer from 15 to 31°C. The difference between the minimum temperatures for each season suggests a visible seasonal pattern of seasonality of 7oC. The estimated temperature for the capture of fish taken from the average of the last two values of the outer surface, show mean water temperatures of 19.13 (SD = 1.51), during both seasons.
A total of 41 derived δ18Ooto-palaeotemperature values were reconstructed from the Saquarema Lagoon otoliths in Saquarema. For SACW water mass the values estimated ranged between 7 and 27°C. For SSW they ranged between 5 and 25°C, whereas for TW the variation was between 11 and 31°C. Relative palaeotemperatures range between 8 and 28°C (mean: 18.78°C) (Figure 8b). These data suggests seasonal changes, with lower isotopic values occurring in warmer waters and higher values in colder waters.
The amplitudes between winter and summer observed in the samples are, in relative terms, the best indications of seasonal correlations between the two profiles (Figure 7). Values in autumn/winter ranged between 8 and 23°C and spring/summer between 9 and 28°C. The difference between each season’s maximum temperatures suggests a seasonal pattern of seasonality of 5°C. Temperature estimation for fish catches was 12°C (SD = 0) (in autumn/winter and spring/summer) for BS-809 and 13.84°C (SD = 2.36) (spring/summer) for BS-810.
DISCUSSION
Otolith Aragonite Preservation from the Galeão Shellmound
Our analysis of external and internal morphology of the Guanabara Bay specimens provides no evidence of diagenesis that could have significantly altered the otolith’s stable and radiogenic isotope values. Different morphological, mineralogical and chemical criteria can be used to check the integrity of fossil and archaeological otoliths (Dufour et al. Reference Dufour, Cappetta, Denis, Dauphin and Mariotti2000; Cook et al. Reference Cook, Languille, Dufour, Mocuta, Tombret, Fortuna and Bertrand2015). When applied to Sciaenidae, they show that otoliths from different archaeological contexts and ages can preserve their integrity (Béarez et al. Reference Béarez, Carlier, Lorand and Parodi2005; Cook et al. Reference Cook, Languille, Dufour, Mocuta, Tombret, Fortuna and Bertrand2015, Reference Cook, Dufour, Languille, Mocuta, Reguer and Bertrand2016, Reference Cook, Mocuta, Dufour, Languille and Bertrand2018; Aguilera et al. Reference Aguilera, Belem, Angelica, Macário, Crapez, Nepomuceno, Paes, Tenorio, Dias, Souza, Rapagna, Carvalho and Silva2016; Carvalho et al. Reference Carvalho, Macário, Lima, Chanca, Oliveira, Alves, Bertucci and Aguilera2018). Our data further supports the use of Sciaenidae otoliths for accurate dating as well as palaeoenvironmental and palaeoecological reconstructions.
Shellmound Chronology
Among the 49 shellmounds that have been registered in the Guanabara Bay, so far nine of them have been dated. Data obtained on otoliths from the Galeão shellmound indicated a maximum radiocarbon age range between 5820–4980 cal BP. Previous records obtained from nine studied shellmounds indicated a range between 5584–1620 cal BP (Appendix II; Gaspar et al. Reference Gaspar, Bianchini, Berredo and Lopes2019). Our new dates partially match the previous records, therefore, our work documents the oldest shellmound settlement of the Guanabara Bay and the oldest phase of occupation of the bay during the Middle Holocene.
The Saquarema region shellmound complex comprises a total of 21 sites, registered at CNSA (2018). Comparison with published data indicates that Beirada shellmound is among the oldest. Guimarães (Reference Barbosa-Guimarães2011) published calibrated ages based in many studies and found minimum and maximum data around 4520–1790 BP for sparse sites of the region. A more recent study found otolith data ranging from 4525 to 3640 cal BP, including Manitiba, Saquarema and Ponte do Girau shellmounds and reveal a lower dispersion during the settlement time period in these shellmounds (Carvalho et al. Reference Carvalho, Macário, Lima, Chanca, Oliveira, Alves, Bertucci and Aguilera2018).
The mid-Holocene period is associated with important palaeoceanographic and palaeoclimatic events. There was a higher insolation, correlated with monsoon climates (Pivel et al. Reference Pivel, Toledo and Costa2010). A dryer climate in south eastern Brazil is recorded through change in the sedimentation rate (Figueiredo et al. Reference Figueiredo, Toledo, Cordeiro, Godoy, Silva, Vasconcelos and Dos Santos2014) and a reduction of gallery forests around 7500–5530 BP (Behling et al. Reference Behling1995, Reference Behling2002). The Galeão shellmound is now 5 m above sea level on a rocky island (CNSA 2018). Due to the maximum Holocene transgression (6–5 cal Kbp) the relative sea level was around 3 m above the current one (Amador Reference Amador1980). The paleobay occupied an area of approximately 800 km2, which is twice its current size (Amador Reference Amador1980). As a consequence, the shellmound was closer to the water line than today but surrounded by shallower water where fishing could have been practiced at a lower energy cost than in the open sea.
On the outskirts of the Beirada shellmound, the maximum sea level variation (+2.5 m) was reached between 4770 and 4490 cal yr BP (Castro et al. Reference Castro, Suguio, Seoane, Cunha and Dias2014), and the external barrier of the Saquarema Lagoon was subject to intense changes (Turcq Reference Turcq, Martin, Flexor, Suguio, Pierre and Tasayco-Ortega1999). The shellmound that is now around 500 m away from the lagoon was located closer to sea in the Holocene period, since it is located in the internal border of the Saquarema Lagoon.
In the Middle Holocene, the configuration of coastal upwelling and SACW middle shelf intrusions in the euphotic zone were already well defined, establishing the modern configuration of the area (Albuquerque et al. Reference Albuquerque, Meyers, Belem, Turcq, Siffedine, Mendoza and Capilla2016). Although Holocene primary productivity has been associated with BC in the mid-shelf portion (Belem et al. Reference Belem, Castelao and Albuquerque2013; Venancio et al. Reference Venancio, Belem, dos Santos, Zucchi, Azevedo, Capilla and Albuquerque2014; Albuquerque et al. Reference Albuquerque, Meyers, Belem, Turcq, Siffedine, Mendoza and Capilla2016), our data support slightly stronger influence of SACW in coastal zones in both seasons, pointing to a cooler and productive waters, which could have favoured fishing, the maintenance of numerous shellmounds in these environments and its builders.
Holocene Water Masses of the Guanabara Bay and Saquarema Lagoon
Despite its relationship to the metabolism of the fish, δ13Coto values of food are ultimately a function of values of DICwater, and therefore general trends and values can be defined as a characteristic of distinct environments (Patterson Reference Patterson1998). The salinity gradient of riverine and marine waters can be responsible for the overall distributions of δ13Cwater isotopic composition of DICwater and can affect the δ13C of the plankton in the estuary (Chanton and Lewis Reference Chanton and Lewis1999; Druffel et al. Reference Druffel, Bauer and Griffin2005). However, the δ13C-DIC signatures in Guanabara Bay did not show conservative distributions with the salinity gradient in the modern bay (Cotovicz et al. Reference Cotovicz, Knoppers, Deirmendjian and Abrila2019). This environment presents a wide range of δ13Cw (–12.2‰ to 4.6‰), lower values are found only around urban outlets or rivers and higher values are found in most parts of the bay (Cotovicz et al. Reference Cotovicz, Knoppers, Deirmendjian and Abrila2019). Kalas et al. (Reference Kalas, Carreira, Macko and Wagener2009) suggests enhanced phytoplankton activity and thus incorporation of δ13Cw with the elevation of HCO3 in this bay during winter, while the depleted carbon signature observed in summer could be derived from larger terrestrial inputs.
DIC patterns in the Guanabara Bay’s water vary spatially between winter and summer (Cotovicz et al. Reference Cotovicz, Knoppers, Deirmendjian and Abrila2019), this behavior can also mask the clear seasonal changes registered during fish movements under wide environmental variation. Moreover, the high productivity in Guanabara Bay and Saquarema Lagoon systems are supported by intensive sunlight and elevated temperatures throughout the year. Both belong to the same coastal sector and their respective hydrographic basins are partially linked. In addition, the dependent estuarine behavior of the whitemouth croaker appears to have maintained a close pattern of movement in the past in southeastern Brazilian coast. In conclusion, we can propose the hypothesis that the majority of the archaeological whitemouth croakers of this study were nearshore residents.
Most of the values of δ18Ooto specimens are represented the closest by the characteristics of the SACW, TW, and SSW. However, low isotope values observed can not to be characterized in any of the water masses described by Venancio et al. (Reference Venancio, Belem, dos Santos, Zucchi, Azevedo, Capilla and Albuquerque2014) around the Cabo Frio system. As a result, the range of variation of the isotopes defined for the water masses of the region does not fully explain the low values obtained here. Data provided by Venancio et al. (Reference Venancio, Belem, dos Santos, Zucchi, Azevedo, Capilla and Albuquerque2014) does not present negative values for δ18Ow and δ13Cw in marine waters in the continental platform between Cabo Frio and the Guanabara Bay front, which reinforces the persistent contribution of freshwater to these specimens. Indeed, the lifecycles of our archaeological fish are not evident for at least two specimens from the Guanabara Bay (see Supplemental Material), that may have stayed close to the mangrove/freshwater shelf during the entirety of their lives rather than migrated to a marine environment. This is a major limitation of the model for reconstructing palaeotemperatures.
Regarding non-cyclical isotopic variations, although the annual range of temperature is wide, they are not constant and do not completely depend on seasonal variations. Other factors can influence this ecosystem. Upwelling activities can be at least partially responsible for the observed patterns. A minimum seasonal temperature variation of 8°C was found by Jones and Allmon (Reference Jones and Allmon1995) for Pliocene mollusk shells in Florida over upwelling influence, similar to the minimum seasonal variation of palaeotemperature obtained from Guanabara Bay otoliths.
Our data show temperatures lower than 14°C, which might be associated with the high influence of SACW in the bay, or by the fish migration to the marine coast surroundings. Fish were captured around a mean water temperature of 19.13 (SD = 1.51), which shows that fishery was not carried out very close to the coast. However, our data points towards derived δ18Ooto palaeotemperature originating mostly from inside of the paleo Guanabara Bay, indicating this environment may have been colder in the Holocene. During the last transgressive period, the paleobay occupied an area of approximately 800 km2, which is twice its current size (Amador Reference Amador1980). Before the 19th century landings, the numerous islands in the area acted as barriers to the currents. This gave the waters a “swampy” nature in that strip of coast to the north of the bay and could have contributed to most of the water in the bay being cooler in the past.
Holocene reconstructed water DIC reflects the general coastal conditions of this region, are within our δ13Coto results and also within modern DIC oscillation of tropical coastal waters. Upwelling events are indicated by enrichments in the isotopic oxygen profiles coinciding with episodes of depletion in the isotopic carbon record.
Data obtained for Bertucci et al. (Reference Bertucci, Aguilera, Vasconcelos, Nascimento, Marques, Macario, Albuquerque, Lima and Belém2018) using archaeological otolith of whitemouth croaker from the Angra dos Reis shellmounds overlap with our results. This is probably explained by both habitats being located around protected inlets, relatively close to the coast and under the influence of the Santos basin’s oceanographic characteristics. According to Bertucci et al (Reference Bertucci, Aguilera, Vasconcelos, Nascimento, Marques, Macario, Albuquerque, Lima and Belém2018), the δ18Ooto and δ13Coto data obtained from the Saquarema region under direct influence of upwelling showed seasonal variability influenced by water temperature and salinity anomalies. Such variations were explained by cold fronts and the continental and superficial drainage of fresh water. Furthermore, the high values of δ18Ooto and low values of δ13Coto in the Saquarema Lagoon of the Holocene are a consequence of the mixing of water masses (Bertucci et al. Reference Bertucci, Aguilera, Vasconcelos, Nascimento, Marques, Macario, Albuquerque, Lima and Belém2018) and different palaeo-shores with a wider ranging marine environment (Amador Reference Amador1980).
Our most positive δ13Coto data indicates that it is possible that the Saquarema Lagoon was more saline in the Holocene in agreement with coastal geomorphologic configuration presented by Turcq (Reference Turcq, Martin, Flexor, Suguio, Pierre and Tasayco-Ortega1999) and with mixed waters (Bertucci et al. Reference Bertucci, Aguilera, Vasconcelos, Nascimento, Marques, Macario, Albuquerque, Lima and Belém2018), where fish were caught in relatively cold waters. Although Saquarema samples presented the minimum δ13Coto values, they also registered the highest values of this isotope, showing largest DIC water.
Historic data of the Saquarema Lagoon before the artificial intervention, shows uniform water masses with low salinity levels throughout the entire lagoon only when rivers flooded, for short periods of the year (Carmouze et al. Reference Carmouze, Knoppers and Vasconcelos1991). The presence of intermittent upwelling was mentioned by Martin et al. (Reference Martin, Suguio, Flexor and Dominguez1996) and gave rise to a semi-arid microclimate in Cabo Frio. Holocene derived δ18Ooto-palaeotemperature reconstruction from archaeological whitemouth croaker otoliths of the Brazilian coast (Bertucci et al. Reference Bertucci, Aguilera, Vasconcelos, Nascimento, Marques, Macario, Albuquerque, Lima and Belém2018; this paper) point to intense temperature anomalies in the shellmounds of the Saquarema complex, consistent with coastal upwelling areas and the wide range of temperatures found for this area.
CONCLUSION
Crystallographic analyses of aragonite in the otolith samples provides no evidence of otolith diagenesis that could have significantly altered stable and radiogenic isotope values of the Guanabara Bay specimens. Radiocarbon ages of otolith samples from the top of the Galeão shellmound corresponds to a range between 5820 and 4980 cal BP and represents the oldest chronological record of a prehistoric settlement for Guanabara Bay. The Guanabara Bay is a complex ecosystem and in spite of disagreements regarding growth marks and cyclicity of otoliths sampled, data shows large amplitudes for δ13Coto and δ18Ooto isotopes and unclear seasonality patterns, characteristic of an upwelled zone. Data from the Saquarema Lagoon shows the best correspondence between growth zones and seasonality and indicate a strongly mixed environment in accordance with previous literature.
The whitemouth croaker of this study were probably mostly nearshore residents; however, our data indicate movements between deeper or mostly marine water masses and reinforce Micropogonias furnieri as excellent candidates for geochemical and palaeoceanographic studies in coastal and estuarine environments. We believe a microchemical study will be able to provide support for the possibility of wide habitats of this species.
Derived δ18Ooto palaeotemperatures from the Guanabara Bay and Saquarema Lagoon pointed to higher δ18O values and consequently lower temperatures in the Middle Holocene. The isotopic characterization of the coastal waters of Rio de Janeiro is necessary for a better understanding of the possible changes in isotopic patterns. Additionally, in-depth studies should bring about a more accurate understanding of the intrinsic seasonality patterns of the whitemouth croaker otoliths from Brazilian coastal regions of Rio de Janeiro. This work can contribute to future studies aiming at the understanding of prehistoric fishing patterns of whitemouth croaker, the main fish resource of the Rio de Janeiro shellmounds. It is important to continue the research in the other shellmounds (Manitiba, Ponte do Girau and Saquarema), since these sites have different distances to the sea and the results will allow for the determination of a margin of error for correction of the uncertainty rates in shallow lagoons of the region of study.
ACKNOWLEDGMENTS
The authors thank CAPES for funding the doctoral scholarship to Lopes MS and the AASPE laboratory from the Muséum national d’Histoire naturelle Paris by funding for isotopic analysis, the SEM captures. They also thank Sylvain Pont from the Institut de Minéralogie, de Physique des Matériaux et de Cosmochimie (IMPMC) in Paris for SEM examination. Drs. Aguinaldo Nepomuceno and Mauricio Cerda helped with general work issues. We thank Henrique Vences Barros for help with the map construction. João Paulo Felizardo helped us with doubts on statistics. The authors would like to thank the Brazilian financial agencies CNPq (Conselho Nacional de Desenvolvimento Científico e Tecnológico, 307771/2017-2, 305269/2017-8, and INCT-FNA, 464898/2014-5) and FAPERJ (Fundação Carlos Chagas Filho de Amparo à Pesquisa do Estado do Rio de Janeiro, E-26/110.138/2014 and E26/203.019/2016, 305269/2017-8) for the financial support. We also thank Daniel Lima for helping us with revisions that have improved this work. The UFF, LAC–UFF, LP&MG, Artefato, ECOPESCA, MNUFRJ, and MNHN of Paris are also thanked for the access to laboratorial equipment and platforms. We appreciate the excellent comments from the reviewers and editor who contributed to the improvement of this article.
SUPPLEMENTARY MATERIAL
To view supplementary material for this article, please visit https://doi.org/10.1017/RDC.2022.57
APPENDIX I
Isotopic Results of δ13C and δ18O


APPENDIX II
Available radiocarbon data for Guanabara Bay shellmounds complex. *Calibrated results by Pinto (Reference Pinto2009) using the Calib Radiocarbon Calibration Program software (Stuiver and Reimer Reference Stuiver and Reimer1993), through the calibration curves Marine04 (Hughen et al. Reference Hughen, Baillie, Bard, Beck, Bertrand, Blackwell, Buck, Burr, Cutler, Damon, Edwards, Fairbanks, Friedrich, Guilderson, Kromer, McCormac, Manning, Bronk -Ramsey, Reimer, Reimer, Remmele, Southon, Stuiver, Talamo, Taylor, Plicht and Weyhenmeyer2004) for shells samples and SHCal04 (McCormac et al. Reference McCormac, Hogg, Blackwell, Buck, Higham and Reimer2004) for charcoal samples. **Calibrated by Beta Analytic Radiocarbon Dating Laboratory. ***Calibrated results by Gaspar et al. (Reference Gaspar, Bianchini, Berredo and Lopes2019) using the Calib Radiocarbon Calibration Program software (Stuiver and Reimer Reference Stuiver and Reimer1993), through the calibration curves Marine09 (Reimer et al. Reference Reimer, Baillie, Bard, Bayliss, Beck, Blackwell, Bronk Ramsey, Buck, Burr, Edwards, Friedrich, Grootes, Guilderson, Hajdas, Heaton, Hogg, Hughen, Kaiser, Kromer, McCormac, Manning, Reimer, Richards, Southon, Talamo, Turney, van der Plicht and Weyhenmeyer2009) for shells samples and SHCal 04 (McCormac et al. Reference McCormac, Hogg, Blackwell, Buck, Higham and Reimer2004) for charcoal samples. Conventional: gas proportional counting; AMS: accelerator mass spectrometry; BS: benzene synthesis.