The 1830s were a period of rapid financial expansion in the United States; the money supply grew, capital inflows increased, and asset prices rose significantly. Historians traditionally thought that the boom in both the banking system and the market for public lands at the western frontier of settlement occurred because of President Andrew Jackson's veto of the federal rechartering of the Second Bank in July 1832, but the work of Peter Temin, Hugh Rockoff, and George Macesich overturned this interpretation and established a new conventional wisdom.1
Temin, Jacksonian Economy; Rockoff, “Money, Prices, and Banks”; and Macesich, “Monetary Disturbances.”
In the three decades since the contributions of Temin, Rockoff, and Macesich, however, we have learned more about the unique capital structure and lending strategies of antebellum banks and about the symbiotic relationship between state governments and state-chartered banks.2
Lamoreaux, Insider Lending; and Sylla, Leger, and Wallis, “Banks.”
Rousseau, “Jacksonian Monetary Policy”; and Wallis, “Depression.”
Given these developments in the literature, it is time to take a fresh look at how President Jackson's war on the Second Bank affected domestic finance in the 1830s. After reviewing the traditional hypothesis about the Bank Veto and the now-conventional story about monetary expansion in the 1830s, I present an alternative account of the sources of growth in commercial bank credit in the 1830s. Then I apply this alternative approach to an analysis of the monetary effects of removing the Second Bank. I conclude that the removal of the Second Bank amplified the boom in state banking, state borrowing, and land development, thereby contributing to the financial distress of the early 1840s, particularly in the South and West—but that it did so through monetary mechanisms different from those posited by either the traditional historians or the New economic historians.
AN OLD DEBATE AND A NEW FRAMEWORK
After President Jackson's veto and his October 1833 executive order forbidding further deposits of Treasury receipts in the Second Bank, money supply growth accelerated. From 1834 to 1836 the money supply grew at an average annual rate of 30 percent, compared to 2.7 percent between 1831 and 1834. Historians traditionally attributed the acceleration in money growth to the removal of the federal bank, which had maintained “systematic pressure on the (state-chartered) banks to redeem their notes.” Now, instead, each state bank could “count the notes of other banks as reserves and expand its loans accordingly.”4
Hammond, Banks and Politics, pp. 452–53.
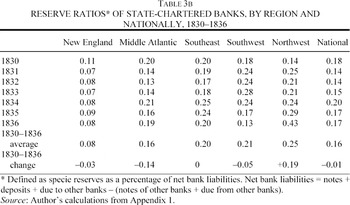
This traditional view, resting largely on anecdotal evidence, was put to the empirical test by New economic historians and found wanting. If the earlier historians were correct, the state banks' specie reserve ratios would necessarily have fallen after 1834, and frontier banks would have had the lowest reserve ratios. In fact they did not.
Using a standard Friedman-Schwartz framework of money supply accounting, Temin constructed estimates of the national stock of specie, the money supply, the reserve ratio, and the proportion of the money supply held as specie for 1820–1858 and found that “the reserve ratio of the American banking system as a whole did not fall below its 1831 level throughout the 1830s.”5
Temin, Jacksonian Economy, pp. 71–73. The reserve ratio of the banking system as a whole reflects the behavior of both the state-chartered banks and the federal bank; to test the traditional view it would be better to look only at the reserve ratio of the state-chartered banking system.
In her review of Jacksonian Economy, Anna Jacobson Schwartz noted that “It is important for Temin's thesis to date the inflation from 1831 …” (p. 478). She pointed out that in fact the reserve ratio did fall between 1834 and 1836 both in the aggregate and in all regions except New England. Similarly, Schweikart, American South, p. 74, observed that the specie reserve ratio fell sharply in 1834–1837 in the three Southwest states in which new lands were most available. Still, in terms of explaining the overall increase in the money supply, the fall in reserve ratios was insignificant compared to the increase in the monetary base.
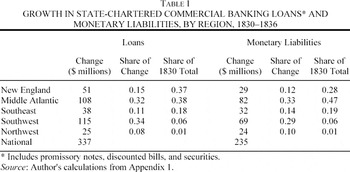
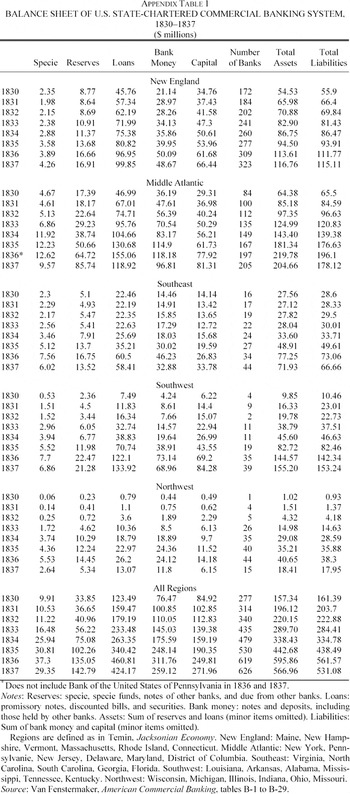
But it was. Appendix 1 shows the annual balance sheet of the U.S. state-chartered commercial banking system in 1830–1837, and Tables 1–3 are based on this Appendix. (The assets and liabilities of the Bank of the United States of Pennsylvania, formerly the Second Bank of the United States, are not included in Appendix 1 or the tables derived from it.7
The Second Bank began operations under its state charter in early 1836, so for most of the period of analysis in this article it was a federal bank. Including the Bank of the U.S. of Pennsylvania with the Middle Atlantic region distorts the pattern of regional growth, because it represents simply a transfer of existing assets and liabilities to the state-chartered system.
State banks in New York and South Carolina, located in slower-growth regions, also grew disproportionately.

Because the traditional hypothesis about disproportionate expansion in the West was concerned with the lending behavior of state banks, and because excessive lending was at the root of the financial crisis that followed the financial boom, this article focuses on the asset side of the banking system's balance sheet. In a Friedman-Schwartz framework, the determinants of bank credit growth are the same as the determinants of growth in bank money: the reserve ratio and bank reserves. This framework, however, was developed for quite a different world, one in which banks acquired most of their money through deposits. It needs to be modified for application to the 1830s United States in light of the “investment club” nature of commercial banks in this period.9
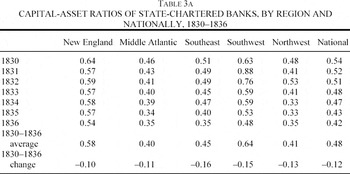
Lamoreaux argued that buying commercial bank stock in antebellum New England amounted to joining an “investment club” in which members' savings were directed to the enterprises of the particular group that controlled the bank as its directors. The capital-asset ratios of New England banks in 1835 ranged between 0.48 and 0.69. Insider Lending, p. 65 and chapter 3 generally.
This was insured commercial banks' highest capital-asset ratio since 1938. See Table 3a and FDIC Quarterly Banking Profile of FDIC-insured Commercial Banks, Second Quarter 2005, at http://www.fdic.gov.
The use of equity as a source of funds for bank loans is illustrated in a simple model of the state-chartered commercial banking system, a model based on accounting identities, in order to understand what happened on these banks' balance sheets over time and to make some useful inferences. The balance sheet of the commercial banking system as a whole consisted of four primary elements, two types of assets: reserves (R) and loans (L); and two types of liabilities: monetary liabilities (D) and shareholders' equity (K).
Bank reserves, broadly defined here, include specie, specie funds, notes of other banks, and deposits held with other banks (“due from” other banks). The banks held these reserves as a proportion (r) of monetary liabilities. Loans include promissory notes, discounted bills, and securities. Monetary liabilities include deposits, notes (including notes held by other banks), and “due to” other banks. K is the paid-in capital stock.
Because total assets must equal total liabilities, it follows that


The sources of growth in bank credit can be separately identified by considering the differential of equation 2 with respect to r, R, and K

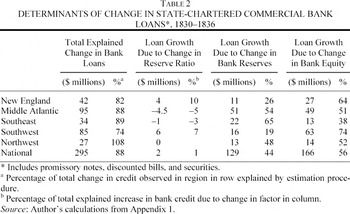
This expression identifies three sources of growth in bank credit: a reduction in the reserve ratio, which has a larger effect the larger the level of bank reserves and the smaller the value of the reserve ratio; an increase in bank reserves, which has a larger effect the smaller the value of the reserve ratio; and an increase in bank equity. The first two terms refer to loans created through fractional-reserve banking methods captured in a Friedman-Schwartz framework. The third captures equity-driven bank lending.
Applying the data on the state-chartered commercial banking system's balance sheet in Appendix 1 to equation 3, we find that this equation explains 88 percent of the observed $337 million change in aggregate state bank credit over 1830–1836, or $295 million (see Table 2). Of this amount, only $2 million, or under 1 percent, was due to the very small reduction in the state-chartered banking system's reserve ratio, and $129 million, or 44 percent, to the change in bank reserves (broadly defined). Fully $166 million, or 56 percent, was due to the change in bank equity. To be sure, not all of the equity was actually paid in; some portion of the loans “funded” by equity were loans to shareholders, who could pay for a fraction of their equity position in specie and repay the balance on an installment basis.11
In some instances commercial banks also made loans on the collateral of other banks' shares. For example, the Manhattan Bank of New York City, a federal depository, reported $1 m of loans extended on stock collateral and listed 27 different securities taken as collateral. These included New York City bank stock and stock of banks in other states (including Louisiana, Ohio, Kentucky, and Alabama). Sen. Report 312, p. 207. In this way the commercial banking system financed its own capitalization.

In the 1830s, equity investments in state-chartered commercial banks increased dramatically, from $85 million in 1830 to $250 million in 1836 (not including the $35 million of equity converted from the Second Bank of the United States to the Pennsylvania-chartered Bank of the United States of Pennsylvania), or 32 percent per year on an average annual basis, as compared to 10 percent in the 1820s. Loan growth was even faster than equity growth, as state banks sought higher returns by increasing their leverage, thereby exposing note holders, depositors, and shareholders to greater risk.12
This effect was also noted in Bodenhorn, State Banking, figure 11.3. Some of the reduction in leverage is due to the placement of large federal deposits with state banks after 1833. Nationally, leverage still rose, but not as much: if federal deposits and their corresponding assets are removed from the banking system's balance sheet, the capital-asset ratio would have been 0.45 in 1836 instead of 0.43. In the Southwest, the capital-asset ratio would have been 0.55 instead of 0.53 in 1836, and in the Northwest, the ratio would have been 0.45 in 1836 instead of 0.35. Even with federal deposits removed, though, the capital-asset ratio in Northwest banks fell from 0.48 in 1830 to 0.37 in 1835.


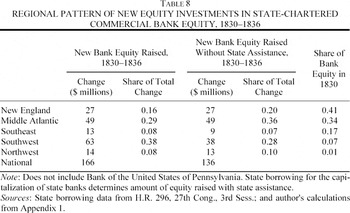
The rising leverage of the banking system did not deter new equity investment in banks. Sixty million of the $166 million in new equity investment in state-chartered banks took place in 1835, at the height of the land boom and at the height of banking leverage. In that year alone, 90 new banks were organized, or one-fourth of all new banks organized between 1830 and 1836. Furthermore, almost half of new bank equity raised without state assistance was invested in the most highly levered regional banking systems, the Middle Atlantic and the Northwest.13
Even after removing federal deposits and their corresponding assets, the banking systems of these two regions were the most highly leveraged. South Atlantic banks were also highly leveraged, but they did not attract equity investment on the same scale, presumably because the expected return on bank assets was not so high in this older region. Expected return on bank equity depended on both the leverage ratio and the expected return on bank assets.
The risk was mitigated by borrowing to buy shares because, if the bank failed, the investor lost both an asset and a liability. Double liability for bank shareholders, which would have increased shareholders' exposure to loss and incentive to monitor management, existed in some regions during this period, most commonly in New England, but was not generally in place, either in the other slow-growth regions or in the high-growth regions. New York had double liability in the 1820s, but replaced it with the Safety Fund legislation of 1829. A number of states adopted this rule either in general law or in state constitutions in the 1840s and 1850s. Marquis and Smith, “Double Liability”; and Moss and Brennan, “Managing Money Risk.”
Although the boom in state banking was not reflected in falling reserve ratios, it was still causally related to the Bank Veto, which brought about three destabilizing monetary effects—effects felt to varying degrees in different regions. First, the removal of the Second Bank opened a large gap between the supply of, and demand for, commercial banking services, creating conditions conducive to a large movement of financial capital into state banking—an entry effect. Second, the veto led to a qualitative change in the kinds of loans available from the commercial banking system, as the dual (federal-state) system gave way to an entirely state-chartered banking system—a credit policy effect. Finally, the removal of federal deposits from Second Bank branches to state-chartered banks eliminated a stabilizing effect that would have developed as a result of the buildup of Treasury deposits during the boom—a reserve retention effect.
THE ENTRY EFFECT
The state banking system grew because state governments decided to charter more banks, and because wealth-holders decided to invest more financial capital into commercial bank equity. Both responses were largest in regions where the Second Bank had dominated commercial banking and where bank equity gave investors access to capital gains on frontier lands.
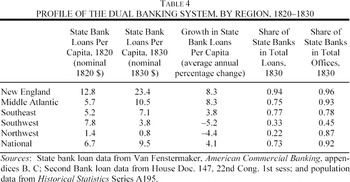
At the time of the Bank Veto, the United States had a dual commercial banking system, with state-chartered banks and one large, federally chartered, nationally branching bank, the Second Bank. Nationwide in 1830, state-chartered banks provided 73 percent of the dollar value of all commercial bank loans; the Second Bank, 27 percent (Table 4). By that year, however, the mix of state and federal banking differed dramatically across regions; state-chartered banks provided 94 percent of all commercial bank loans in New England but only 33 percent in the Southwest and 22 percent in the Northwest, where the Second Bank was most dominant.15
In Ohio, by far the most populated state of the region, there were 11 state banks, all small rural banks with paid-in capital ranging from $72,000 to $100,000. There were no state banks in Cincinnati, only a branch of the Second Bank. The only state bank in Illinois, the State Bank, was in liquidation. There were no state banks in Indiana or Missouri, where the circulating medium was provided by the Second Bank's Louisville, Cincinnati, and St. Louis offices. St. Louis, the other commercial center of the region, was also served only by a branch of the Second Bank branch in 1830. Two state-chartered banks operated in Detroit in 1830. Harding, State Banking, p. 1; Dowrie, Development, pp. 48–58; Cable, Bank of Missouri, chapter 4; and Golembe, State Banks, p. 17.

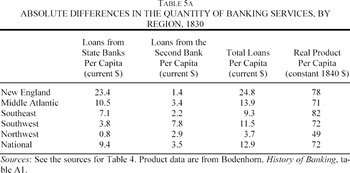
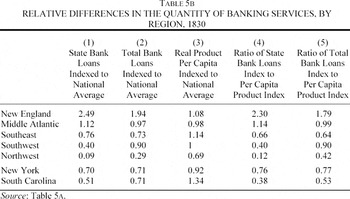
By 1830 too, the quantity of banking services supplied by the dual banking system varied widely in different regions, in terms both of absolute levels (Table 5A) and of relative regional incomes, which indicate relative levels of demand for credit (Table 5B).16
The effects of interest rates and expectations on the demand for credit are not taken into account in this analysis, but in frontier regions the depressing effect of higher interest rates would have been counterbalanced by the stimulating effect of higher growth expectations.


A comparison of the last two columns shows the effect of the closing of Second Bank branches on the supply-demand balance in each region. By these measures, the Second Bank branch closings had no adverse impact on the relative standing of New England, the Middle Atlantic, or the Southeast, but the Southwest and the Northwest fell far behind the national average, even after adjusting for the lower incomes in these regions. In the 1830s the Southwest started out with a level of banking services not far from the national average, but the closing of the Second Bank left it deficient. In the same decade, the Northwest started out in an underbanked condition that became aggravated by the closing of the Second Bank branches there. The absolute level of loans per capita fell by two-thirds in the Southwest and by 78 percent in the Northwest, much more than in any other region.
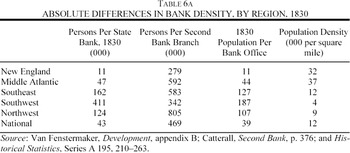
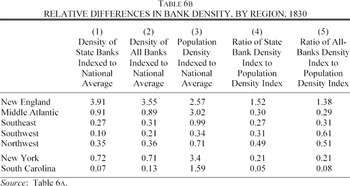
Another indication of the impact of the closing of Second Bank branches on different regions is relative access to a banking office, measured by the number of residents per banking office (i.e., bank density). By 1830, state banks dominated the commercial banking system in terms of the population's access to banking offices; there were 43,000 residents per state banking office, 469,000 per Second Bank branch (Table 6A). Again, the relative density of state and federal banking offices varied across regions. In New England, access to a state banking office was 25 times as great as access to a Second Bank branch; in the Northwest only six times as great, and in the Southwest it was actually slightly lower than access to a Second Bank branch.

Overall access to a banking office was lower on the frontier than in coastal areas, but we expect regions with lower population density to have lower density of banking offices, especially when transportation and communications costs were high. To put these differences in perspective, we must compare bank density to population density. In Table 6B, state and total bank density by region are indexed to the national average, as is population density. The ratio of the total bank density index to the population density index (column 5) reflects whether a region enjoyed greater (ratio greater than one) or less (ratio less than one) relative access to banking facilities than would be expected based on its population density alone. All regions other than New England had lower relative bank density than their relative population densities would have predicted.

The difference between column 5 and column 4 indicates the effect of the removal of the federal bank on each region's relative access to banking facilities. New England's relative access improved, whereas the positions of the Middle Atlantic, Southeast, and Midwest deteriorated slightly or stayed about the same. The only region where the closing of the Second Bank had a significantly adverse impact on access to a banking office was the Southwest, where, consequently, the chartering rate grew the most.17
Very similar results are reached by using an index of urbanization instead of an index of population density.
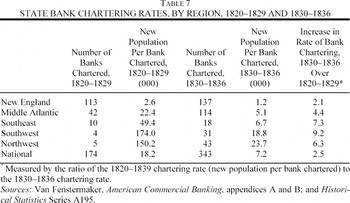
Between 1830 and 1836 all states granted new bank charters at increasing rates, as measured by the ratio of population increase to number of banks chartered (see Table 7), and by this measure the chartering rate at the national level more than doubled. In the 1830s, state governments had both offensive and defensive reasons to charter banks. Economic competition among states drove them to undertake internal improvement projects and to charter banks, both essential to an infrastructure for developing market economies. State legislatures were also afraid that “if they did not create new banks to replace branches of the Second Bank of the United States, other state banks would flood their particular state with notes over which they would have no control.”18
Van Fenstermaker, American Commercial Banking, p. 93.

Bank chartering increased at varying rates across regions and states. The largest increases were in the Southwest, the Northwest, and the Southeast, regions where the closing of Second Bank branches did the most to restrict access to banking services.19
Not surprisingly, state governments on the frontier chartered new banks in every city that lost a Second Bank branch in 1832 or soon thereafter: in 1832, Louisiana chartered the Union Bank in New Orleans; Kentucky chartered the Louisville Bank of Kentucky in 1833 and the Northern Bank of Kentucky in Lexington in 1835; Alabama chartered the Mobile branch of the Bank of the State of Alabama in 1832; Mississippi chartered the Commercial Bank of Natchez in 1836; Ohio chartered the Franklin Bank, a Cincinnati bank, in 1833. St. Louis was served by an agency of the Commercial Bank of Cincinnati, (whose capitalization was increased by the State of Ohio in 1833). The agency purchased the accounts and assets of the Second Bank branch and operated until 1837, when the St. Louis branch of the State Bank of Missouri started operations. One of the directors of the State Bank had been the President of the St. Louis branch of the Second Bank. Sen. Doc. 16, pp. 100–13; Van Fenstermaker, American Commercial Banking, appendix A; and Cable, Bank of Missouri, pp. 83, 95–99.
A comprehensive legislative history is beyond the scope of this article, but there is evidence that the anticipated or actual closure of the Second Bank stimulated state chartering of banks. In Louisiana, the act to charter the Union Bank, explicitly viewed as a replacement for the New Orleans branch of the Second Bank, was adopted in April 1832, three months before the Congress voted to recharter the Bank and the President issued his veto. Green, Finance, p. 24; and Schweikart, Banking in the American South, table 7. The Ohio Legislature was not stirred to action until Jackson issued his executive order to deposit new federal government receipts in state banks rather than the Second Bank, which convinced members that the Bank would not be rechartered. Brown, Second Bank, pp. 173–78. In Indiana, “numerous scattered references indicate that it was because of the expected end of that ‘monster,’ [the Second Bank] and the consequent withdrawal of its circulation, that the first bill for a state bank was introduced into the legislature.” Harding, “State Bank,” p. 2. According to Dowrie, Banking, pp. 59–61, after a bad experience with state banking in the 1820s, the Illinois legislature defeated all banking projects presented to it in 1830–1833 and explicitly prohibited the exercise of banking power in all acts of incorporation it adopted. After Jackson's veto, however, “by a combination … of the Whig forces with those Democrats who interpreted President Jackson's hostility to the Bank of the United States as an indorsement of the state institutions, a bill for the creation of a new state bank was passed by both houses.”
The closing of Second Bank branches could have spurred state governments to charter more banks, but the banking system would grow only if owners of financial capital subscribed to the authorized banking capital. At the regional level, commercial bank equity grew disproportionately only in the two frontier public-land regions, whether or not the measurement includes equity raised with state assistance (Table 8). Equity investments in these western banks were an indirect way for individual investors and state governments to invest in western lands.21
Golembe, State Banking, pp. 123–24, observed that the banks “acted almost as investment houses for people seeking a share of the profits of land speculation” while “spreading the risk as much as possible.”
Even if all of the unexplained credit growth in the Southwest were attributed to fractional-reserve banking, fully half of the credit growth could be attributed to new equity.

In two states in slower-growth regions, New York and South Carolina, state bank equity also grew disproportionately, and each of these states had something in common with the two faster-growth banking regions. New York was not hurt by the closing of Second Bank branches (see Tables 5B and 6B), but it did find itself, by the late 1820s, in an underbanked condition, as measured both by bank loans per capita and by bank density. After a decade of reluctance to charter additional banks, the New York Assembly resumed bank chartering in 1829, when the shortage of banking capital had become a pressing political issue. Further, although New York was not a public-lands state, the value of large tracts of land owned by private land companies in “frontier” areas of central and western New York increased after the completion of the Erie Canal in 1825.23
Evans, Holland Land Company, pp. 389–94. The returns from banking in boom towns were demonstrated in such young cities as Rochester in western New York, a crossing point for the Erie Canal, which was completed in 1825. In 1828 the Bank of Rochester declared an extra dividend of 10 percent in 1828, for a total return of 19 percent. Rochester, p. 173.
In South Carolina the level of bank loans per capita was disproportionately low in 1830, and it became significantly worse after the closing of the Second Bank branch in Charleston (see Table 5B). Bank density was also very low in proportion to the state's population density, both before and after the exit of the Second Bank. In this southeastern seaboard center of cotton marketing and distribution, the Charleston branch had provided substantial discounting facilities (exceeding $3 million at the end of 1831).24
House Doc. 147, p. 28.
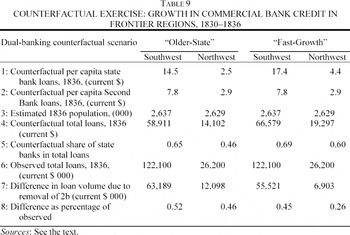
Had the Second Bank remained in place, both parts of the dual banking system would have grown. To estimate how much of the observed growth in state bank credit in frontier areas can be attributed to the removal of the Second Bank, it is useful to conduct a counterfactual exercise, calculating what this growth would have been if the Second Bank had continued to exist (see Table 9). Applying this alternative growth rate generates the theoretical level of state bank loans per capita in the Southwest and the Northwest in 1836 (row 1). Adding what would then have been Second Bank loans per capita (row 2)—assumed to be equal, in 1836, to the observed level of 1830—and multiplying the per capita bank loan estimate by the (estimated) 1836 population (row 3) produces the level of total commercial bank loans (row 4). The difference between the observed level of commercial bank loans in 1836 (all from state banks) and what would have been the level in a dual-banking system can be attributed to the removal of the Second Bank.

This counterfactual method contains a bias against finding support for the hypothesis that the removal of the Second Bank had a significant effect: it assumes that there would have been as much population movement into frontier areas even if there had been no change in banking institutions, and this assumption consequently amplifies the hypothetical loan levels. The method also incorporates the assumption that all growth in credit per capita would have come from the state banks, not from the Second Bank—an assumption that can be justified on the grounds that growth in Second Bank loans would have been limited by the Bank's constant level of capitalization, set by Congress.25
If the Second Bank had been rechartered as a federal bank, any additional capital provided in the new charter would not have been realized until the new charter began, in 1836.
Clearly, the outcome of this counterfactual exercise rests critically on the growth rate assumed for state bank loans. Thus, two different scenarios may provide a more reliable conclusion than just one. One way to project growth in state banking on the frontier is to assume that state banking in the Southwest would have grown as fast as state banking in its more mature counterpart, the Southeast, grew in the dual banking environment of the 1820s, and that state banking in the Northwest would have followed the growth pattern of the Middle Atlantic states in the 1820s (from Table 4). Under this “older-state” assumption, the removal of the Second Bank would explain $79 million of the $122 million in commercial bank loans observed in the Southwest in 1836 and $12 million of the $26 million observed in the Northwest.
This figure of $79 million for the Southwest may be misleadingly large, however, because in the 1820s per capita loans grew much more slowly in the Southeast than in the Middle Atlantic (3.8 percent per year versus 8.3 percent per year). To modify this “older-state” scenario, therefore, one may assume that the Southwest would have been more likely to grow as Georgia did (25 percent average annual growth in per capita loans in the 1820s) than as the Southeast region grew as a whole. This alternative approach, reported in Table 9, attributes $63 million of $122 million to the removal of the Second Bank. A “fast-growth” approach projected the observed 60 percent average annual growth of 1830–1832 in the Southwest to both frontier regions. Even in this fast-growth scenario, a significant gap remains between the observed credit growth and credit growth in the counterfactual world ($55 million in the Southwest, 45 percent of the observed, and $7 million in the Northwest, 26 percent of the observed).26
Although the growth in bank credit and public land sales in the Southwest began before 1830, the rate of credit growth accelerated after 1832, the year of the veto. In 1828–1832, bank credit grew at an average annual rate of 42 percent; in 1832–1836, it grew at an average annual rate of 162 percent. Data limitations made it impossible to conduct the same comparison for the Northwest.
In sum, the counterfactual exercise shows that between 45 percent and 52 percent of the observed growth in bank credit in the Southwest and between 26 percent and 46 percent of the observed growth in credit in the Northwest can be considered excessive credit growth caused by the removal of the Second Bank.
THE CREDIT POLICY EFFECT
The closing of the Second Bank's branch offices also led to a qualitative change in commercial banking practices, as the dual banking system gave way to the state banking system. Although the types of commercial banks chartered by different states varied somewhat from each other, the credit policies of the state-chartered banks were generally more liberal than those of the Second Bank. Whereas the Second Bank had institutional obligations to the federal government, which chartered it, state-chartered banks had institutional obligations, explicit or implicit, to state governments and to stockholder-directors who contributed substantially to the banks' capitalization. These relationships drew state banks into areas of finance the Second Bank had avoided, notably land development and state public works projects.
Under its charter, the Second Bank had to provide free fiscal services to the national government, which had receipts and payments spanning a broad geographic area, both nationally and internationally. The Second Bank pursued a business strategy of creating synergies between its core lending business and its charter obligations. This strategy led the bank to specialize in trade finance. Thus, for example, in 1830, when the Second Bank provided 27 percent of all credit extended by the commercial banking system, it held over 60 percent of its earning assets in bills of exchange—short-term credit instruments that financed interregional and international trade.27
Knodell, “Profit,” table 2. Over the course of the 1820s, the Second Bank had pursued greater profitability by increasing its ratio of assets to capital. As the bank's leverage rose, so did its reliance on circulating notes and deposits to fund its assets, reinforcing its relative preference for shorter term assets in order to manage liquidity risk.
After being appointed its president in 1823, Nicholas Biddle sought to improve the quality of the bank's portfolio. To its branches he issued a prohibition on real estate lending, arguing that the bank had “so large a part of the capital of the Bank locked up in real estate,” the result of the bank's having taken ownership of real estate in repayment of debts incurred during the credit expansion of 1818–1819, particularly at the western branches.28
Catterall, Second Bank, pp. 484, 66, 100. Catterall cites no instances of Second Bank lending to any state government.
During Biddle's administration, the head office at Philadelphia appointed both the Presidents of the boards of the branches and the cashiers of the branches, the latter being “carefully selected from the employees trained at Philadelphia.” The branch presidents and cashiers played the lead role in nominating members of their boards, with the understanding that they were to avoid persons who “have already borrowed too much, who wish to borrow too much, or who have needy friends whose claims they may urge successfully while sitting at the Board, when they might otherwise be resisted.” Catterall, Second Bank, pp. 384, 387.
The new banks that were chartered on the southwestern frontier were various combinations of “plantation banks,” internal improvement banks, and commercial banks.30
Bodenhorn, State Banking, pp. 231–32, 253–55, 259–60; and Schweikart, American South, pp. 175–82. Bodenhorn argues that although plantation banks raised capital through mortgages supplied by planters, much of their subsequent lending was commercial. The plantation banks in Louisiana were all in New Orleans, where an extensive business in discounting domestic and foreign bills of exchange was vacated by the Second Bank of the U.S. (then re-entered by the Bank of the United States of Pennsylvania through an agency relationship with the Merchants Bank of New Orleans, chartered in 1836).
One property bank, the Union Bank of Louisiana, presented these arrangements on its 14 December 1835 balance sheet with the entries, “Capital: State bonds sold,” and “Dividends declared forming capital” Sen. Doc. 312, p. 524. Green, Finance, p. 116 and chapter 4; and McGrane, Foreign Bondholders, chapter 9.
Bodenhorn, State Banking, pp. 289. Because these banks funded their long-term assets with long-term liabilities (Louisiana banks' average capital-asset ratio was 0.67 in 1830–1836; Mississippi's banks' was 0.48), they were not exposed to liquidity risk. When they failed, it was because all of their assets were invested in one way or another in the cotton economy.
The capitalization of these banks tended to be large compared to banks in other regions, and southern states borrowed heavily to assist in this capitalization.33
The average capitalization of banks in the Southwest was $2 million in 1836, compared to $0.4 million nationally; Appendix 1. In Louisiana, three property banks received 86 percent of the state's total bond subsidies (Green, Finance, p. 109); in Florida, $3 million of the debt issued for banks went to capitalize one property bank, the Union Bank. In Alabama, the state used bond proceeds to acquire $2 million of equity in the newly chartered Planters and Merchants Bank of Mobile. In Mississippi, the state assisted with the capitalization of the Planters Bank of Natchez and the Agricultural Bank. House Report 296 (27-3), pp. 70–75; Schweikart, Banking in the American South, pp. 48–59, McGrane, Foreign Bondholders, pp. 194, 225; and Bodenhorn, State Banking, pp. 250–60.
Author's calculations from House Report 296 (27-3).
Commercial banking and real estate lending also engaged the new banks chartered by northern state governments.35
Bodenhorn, State Banking, p. 224, concludes that “credit relations and institutions in the Old Northwest differed from those in the South in degree rather than in kind.” The new banks chartered in New York under the 1829 Safety Fund Act also lent on real estate collateral. By 1836 the Bank Commissioners of New York were worried about the Safety Fund banks' involvement in mortgage lending and the “marked growth in loans financing land speculation in western New York.” Bodenhorn, State Banking, p. 161.
Due to the rapid entry of exchange brokers and private bankers into Midwestern cities during this period, the region was not starved for trade finance. Knodell, “Financial Deepening,” tables 2–4.
Harding, “State Bank,” pp. 14–24; and Golembe, “State Banks,” pp. 98, 106, 109.
In his study of state banks in the Old Northwest, Carter Golembe concludes that real estate loans were common in Ohio, “even in towns that were able to provide banks with a great deal of business of a commercial nature,” and that the banks of Illinois, Wisconsin, and Michigan were “most heavily involved in real estate transactions, particularly of a speculative nature.” The Commercial Bank of Lake Erie, a Cleveland bank that was revived in 1831, “was in the mainstream of western banking institutions: issuing credit not only for mercantile transactions but also for real-estate purchases, both in Cleveland and in undeveloped lands sold by the state and federal governments in the mid-1830s.”38
Golembe, State Banks, p. 135; and Scheiber, “Commercial Bank,” p. 63. An analysis at the land district level shows that land sales most outpaced settlement between 1830 and 1840 in the northern land districts of Ohio, Indiana, and Illinois, and in the southern land districts of Michigan and Wisconsin. Knodell, “Financial Stability,” table 4.6, pp. 263–68.
Real estate lending by western banks was variously conservative and speculative. The State Bank of Indiana and the Ohio Life Insurance and Trust Company followed a relatively conservative policy of restricting agricultural and urban real estate lending to improved lands, with low loan-to-value ratios, and in established urban areas. At the other extreme, the Bank of Illinois at Shawneetown and the Franklin Bank of Cincinnati directly helped finance the development of new towns at Massac, Illinois, and Jeffersonville, Indiana. A large shareholder of the State Bank of Illinois borrowed from that bank to speculate in town lots in Alton, Illinois. The Bank of Michigan financed investments in town sites in Detroit and western Michigan.39
Haeger, Investment Frontier, chapter 3; Golembe, “State Banks,” chapter 5; Dowrie, Banking in Illinois, pp. 92, 108–09; and Scheiber, “Commercial Bank,” p. 63. As a group, state banks on the northwestern frontier were more leveraged (i.e., had lower capital-asset ratios) than their counterparts to the south, particularly those northern state banks that were more heavily involved in speculative real estate lending. Illinois banks' capital-asset ratio averaged 0.31 in 1830–1836; Ohio banks' averaged 0.42.
An examination of how new Midwestern banks were organized and capitalized provides additional insight into the connection between state banking on the frontier and real estate investment. Between 1832 and 1834, Ohio state banking capital increased by $7.4 million, of which $5.3 million was issued by five of the largest institutions. Sixty percent of the assets of these five were owned by eastern investors, who formed group partnerships with the western elite to organize, capitalize, and direct these banks. In The Investment Frontier, John Haeger provides a detailed historical record of the work of one such investor group, led by Charles Butler, Lot Clark and Thomas Olcott, upstate New Yorkers who invested in both bank stock and western lands.40
Charles Butler, who was instrumental in the organization of the Ohio Life Insurance and Trust Co., gathered many of the same investors together to capitalize the American Land Company in 1835, which acquired large holdings of frontier land on both the southern and northern frontiers. Haeger, Investment Frontier, p. 108.
This investment activity was emblematic of a larger process of institutionalization of investment in western lands, and of a splitting off of lending from investing. Earlier, eastern investors bought western lands, then sold them on credit to settlers, these transactions being facilitated by western agents, typically attorneys. In the 1830s eastern investors had the option of investing in a more diversified portfolio of land, by buying shares issued by a land company, or investing in a more diversified portfolio of loans by buying shares issued by a bank, a life insurance company, or a trust company. States chartered a number of trust companies in the 1830s (Smith, Development, chapter 12).
The Dwight family of New York and Massachusetts played a similar role in the capitalization of the Bank of Michigan in Detroit and the Commercial Bank of Lake Erie in Cleveland. The cashier of the Bank of Michigan from 1825 to 1836 was Charles Trowbridge, who began his career as the Detroit agent and partner for Arthur Bronson, an eastern land investor with large western holdings, who provided finance for the ventures of the Butler-Clark-Olcott group as well. Like Whittlesey and Williams, Trowbridge later became an active land developer and promoter of town sites in western Michigan.42
Huntington, Banking, pp. 138–40; Haeger, Investment Frontier, chapter 3; Golembe, “State Banks,” chapter 5; and Scheiber, “Commercial Bank” and “Entrepreneurship.”
Frontier bank lending to the property sector amplified the land boom, either directly or indirectly. State-chartered commercial banks provided a significant portion of the financing of land purchases and land development on the southern frontier.43
I am not aware of any estimates of the share of eastern capital in total purchases of public lands on the frontier from the federal government.
According to Schweikart, American South, p. 197, the Union Bank of Florida, chartered in 1833, “spearheaded the speculative surge in plantation lands.” One borrower, a plantation owner, was the second largest stockholder in the Union Bank by 1839.
On the northern frontier, the increase in bank equity ($14 million) between 1830 and 1836 was small in comparison with $34 million of total sales of public lands in Ohio, Illinois, Indiana, Michigan, and Wisconsin.45
Land sale data from Cole, “Cyclical and Sectional Variations,” p. 52.
Golembe, State Banking, chapter 5; Haeger, Investment Frontier, chapters 5, 6, 8, 9; and McNall, Genesee Valley, chapter 14.
As farmers, planters and land developers looked to state-chartered banks for longer-term loans in 1830–1836, so did state governments, both where commercial banking expanded relatively rapidly (the Northwest) and where it grew relatively slowly (Pennsylvania, Maryland, and Virginia). By 1839 the State Bank of Illinois held $2.5 million in Illinois internal improvement bonds, not because it was required to by law but “to retain the good will of the legislature.” Similarly, the State Bank of Indiana made what started out to be short-term advances to the state's canal fund, eventually rolling them over into de facto long-term loans despite the discomfort of the bank's officers. State-chartered banks in Ohio were an important source of demand for the state bonds issued after 1836 to finance the expansion of the state's system of canals.47
Bodenhorn, State Banking, pp. 145–52, 227–34; Golembe, “State Banks,” pp. 177–87; and Scheiber, Ohio Canal Era, chapter 6. States in the Southwest did a lot of borrowing in this period, but for banks, not for public works; see Wallis, “Depression,” table 3.
Longer-term finance for land development and internal improvements would not have been so forthcoming from the old Second Bank, with its federal government orientation and “real bills” approach to portfolio management. Nevertheless, the removal of the Second Bank cannot account for all of the observed increase in the supply of long-term lending, because, had the Bank survived, the dual banking system would have continued to expand in frontier states, and with it the supply of longer term loans would have also grown. A counterfactual scenario based on the exercise in the previous section demonstrates the effect of the Second Bank's removal on the supply of longer-term loans. In this scenario, long-term lending is lower for two reasons: the total volume of loans is smaller, because the hypothetical survival of the Second Bank slows the pace of state bank expansion; and the share of long-term lending in total lending is smaller.
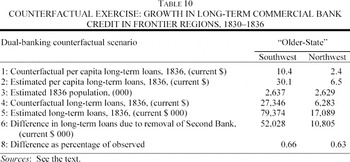
The exercise compares the actual increase in longer-term loans to a hypothetical estimated increase. Absent any systematic evidence on the composition of state banks' portfolios of earning assets, the actual increase must also be an estimate. I have based this estimate on the assumption that state banks held 50 percent of their loans as long-term loans in 1830 and 65 percent in 1836, and that western branches of the Second Bank held 40 percent of their loans as longer-term loans. The counterfactual scenario of a dual-banking world in 1836 is based on the assumption that state banks would have continued to hold 50 percent of their loans as long-term loans, the Second Bank 40 percent. Applying these loan-mix assumptions to the observed and counterfactual data on per capita loans and population from Table 8, using the “older-state” scenario for both frontier regions, leads to the conclusion that the removal of the Second Bank resulted in an additional $52 million of longer-term credit in the Southwest and an additional $11 million in the Northwest (Table 10).48
Further, none of the longer-term credit provided by the Second Bank in the counterfactual world would have been available for real estate lending.

THE RESERVE-RETENTION EFFECT
In his history of the public land-office business, Malcolm Rohrbough presented the traditional historian's view that the Bank Veto and the removal of the federal deposits led state banks to expand loans “at a dizzy rate, while often filling their vaults with public monies deposited by the local (land office) receiver…(creating) a cycle of loan, purchase, and deposit that continued unchecked.”49
Rohrbough, Land Office Business, p. 178.
Frontier banks' reserves grew, first, because the reserves of the banking system as a whole increased, and, second, because these banks' share of total reserves rose. According to Temin's data, reserves of the commercial banking system first increased in 1830, when banks' share of a basically constant national specie stock rose. Bank reserves increased again after 1833 even though the banking system's share of the national specie stock fell, thanks to large increases in the national stock of specie as the national economy ran surpluses on its overall balance of payments.50
Engerman, in “Note on Economic Consequences,” argued that the rise in the nonbank public's relative preference for specie over bank money was a result of the Bank Veto. In a counterfactual no–Bank Veto world, if the banking system had maintained its 1830 share of the national specie stock, the specie stock increased by $41 million (as it actually did in 1830–1836), and state banks had maintained their 1830 share of the banking system's reserves, state bank reserves would have been $5 million larger than they actually were in 1836. The analysis that follows abstracts from this effect of the veto.
Author's calculations from Temin, Jacksonian Economy, table 3.3. The information reported in Appendix 1, from Van Fenstermaker, Commercial Banking, combined with information on Second Bank specie holdings from Catterall, Second Bank, appendix V, indicates a net increase of $19 million in the specie holdings of the banking system between 1830 and 1836 (from $21 million to $40 million, instead of $25 million to $37 million, in Temin). The difference is due to different underlying data sources and methods: Temin's series for specie in state banks (imputed by the author from his series on specie in all banks and Catterall's data for the Second Bank) is based on Van Fenstermaker's data for years before 1833, scaled up to adjust for the proportion of reporting banks (which was not done in Appendix 1), and on Treasury data after 1833. The Treasury numbers for state banks were “mysteriously” smaller than Van Fenstermaker's, as noted by Temin (p. 183). In sum, Temin's (implicit) 1836 number for specie in state banks is smaller than that in Appendix 1, and his 1830 number is larger.
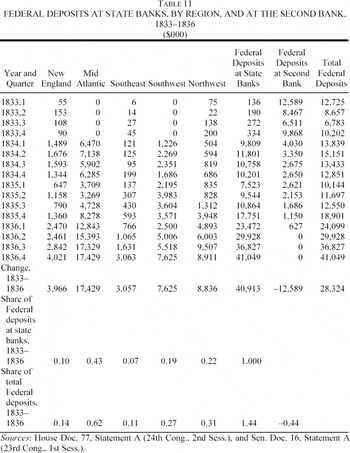
At the outset of the 1833–1836 surge in commercial bank reserves, President Jackson issued an Executive Order mandating that federal receipts be deposited in designated state-chartered depository institutions instead of in the Second Bank. Between the fourth quarter of 1833 and the first quarter of 1834, the Second Bank's share of all federal deposits fell from 97 percent to 30 percent, then fell more gradually over the next two years, until by July 1836 there were no federal deposits at the Second Bank. As a result of the removal of Treasury deposits and the Second Bank's winding up its affairs as a federally chartered bank, the Second Bank's specie reserves fell by $8 million while those of state-chartered banks (other than the Bank of the United States of Pennsylvania) rose $20 million between 1830 and 1836.52
Author's calculations from Temin, Jacksonian Economy, table 3.3; and Catterall, Second Bank, appendix V. Van Fenstermaker's data show an increase of $27 million in specie reserves at state-chartered banks other than the Bank of the U.S. of Pennsylvania.
During this same period federal deposits increased dramatically, as federal receipts from public land sales and import duties increased and as the newly debt-free federal government ran large budget surpluses. Between the beginning of 1833 and the end of 1836, $40.9 million in new federal deposits accumulated at state-chartered depositories; over the same period, $12.6 million of pre-existing federal deposits were drawn down at the Second Bank, for a net increase in federal deposits in the commercial banking system of $28.3 million (see Table 11). The large federal surpluses were left on deposit where new receipts were generated. As a consequence federal deposits accumulated disproportionately in federal depository institutions in the Middle Atlantic, Southwest, and Northwest. Of the $40.9 million in federal deposits that accumulated at state-chartered depositories, banks in the Middle Atlantic received 43 percent, banks in the Southwest 19 percent, and banks in the Northwest 22 percent (Table 11).

The Treasury's monetary behavior is one of many factors behind the disproportionate growth in frontier banks' reserves, including net external investment in western corporations (such as banks), in western land and land development, and in long-term securities issued by western state governments.53
Golembe, State Banks, p. 230.
Author's calculations from Appendix 1. This was also noted by Ng, “Structure,” p. 31.
The disproportionate accumulation of federal deposits in frontier banks has been noted by others, but the point not already made in the literature is that under the dual commercial-banking system, even if the Treasury had kept the land office receipts in the frontier regions, the growth in federal deposits would have redistributed reserves from state-chartered banks to the western branches of the Second Bank.55
On the disproportionate accumulation, see Golembe, State Banks, pp. 227–29. Rockoff, “Money,” pp. 456–57, calculated the effect, on money supply growth, of transferring government deposits from the Second Bank to state banks, given that the Second Bank had a higher reserve ratio than the state banks. He found that this transferring of deposits caused the money supply to be only 1.3 percent larger, an insignificantly small effect. Rockoff used reserve ratio data from a time when the difference between the Second Bank's and state banks' reserve ratios (17 percent and 14 percent respectively) was very small. Over 1822–1832, the state banks' reserve ratio averaged 16 percent, and the Second Bank's 30 percent (author's calculations from Van Fenstermaker, Commercial Banking; and Catterall, Second Bank). Using the longer-run average reserve ratios shows that removal of the deposits boosted the money supply by 6 percent, still insignificant compared with the size of the observed increase. From a credit creation point of view within the framework of the model used in this article, the transfer of deposits would have stimulated only the fractional-reserve component of state bank lending, not the equity-funded component. Rockoff's analysis did not consider the difference in lending practices between the federal and the state banks.
Until 1836 federal deposits were relatively concentrated in a few institutions in both frontier regions. In the Southwest three banks held 70 percent of all federal deposits at the end of 1836, when deposits were at their highest point: the Mobile branch of the Bank of the State of Alabama, the Union Bank of Louisiana, and the Commercial Bank of New Orleans. At the same time in the Northwest, the Bank of Michigan, the Franklin Bank in Cincinnati, and the Commercial Bank of Cincinnati held 43 percent of federal deposits in the region.56
The Commercial Bank of Cincinnati alone held 58 percent of all federal deposits in the Northwest if the deposits at its agency in St. Louis are combined with the deposits at its head office in Cincinnati. House Doc. 77.
The southwestern depository banks in this group are the Union Bank of Louisiana, the Mobile branch of the Bank of the State of Alabama, the Planters' Bank of Natchez, and the Commercial Bank of New Orleans. The northwestern banks are the Bank of Michigan, the Farmers and Mechanics' Bank of Detroit, the State Bank of Indiana, the Franklin Bank of Cincinnati, and the Commercial Bank of Cincinnati.
Federal deposits were relatively more important in the north not because the average level of federal deposits was higher there but because the northern banks were on average much smaller than the southern banks. The average level of federal deposits at the top three banks in the Southwest between the first quarter of 1834 and the last quarter of 1836 was $756,000; the average level at the top three northwestern depositories for the same period was $520,000. The depository banks in the Southwest had average capitalization of $4 million; those in the Northwest, $0.7 million (Sen. Doc. 312).
The growth in federal deposits and their concentration in a few institutions fuelled the land boom, however unintended that effect may have been. According to Golembe, individuals involved in organizing new banks actively sought federal deposits, which “seem to have been regarded by the receiving banks more as additions to their capital than as obligations which they might have to meet unexpectedly.”59
Golembe, State Banks, pp. 226–27.
In sum, after the veto the Treasury's management of federal government deposits reinforced the frontier land boom and the pattern of rapid money and credit growth on the frontier, by redistributing bank reserves to the same regional state banking systems that attracted much of the new bank equity. Had the Second Bank continued to serve as the federal government's fiscal agent, the same Treasury behavior would have redistributed bank reserves to the frontier branches of a financial institution that avoided loans for real estate development and state infrastructure.
CONCLUSION
Previous accounts of the monetary history of the United States in the 1830s, whether from the traditional historians or from the New economic historians, have implicitly assumed that the balance sheets of the commercial banks of the 1830s looked much like those of modern commercial banks, in which equity comprises a relatively small portion of all bank liabilities. This article has proposed a new interpretation of the monetary effects of President Jackson's veto of the bill that would have rechartered the Second Bank, based on an institutional feature that made commercial banks in the 1830s quite different from their modern counterparts. Because equity accounted for about half their liabilities, they were as much mutual funds, funding asset acquisition with equity shares, as they were banks, funding asset acquisition with reserve-backed notes and deposits.
I have identified three important implications of this institutional fact for our historical understanding of monetary events during this period. First, at the aggregate level, a model that ignores the importance of equity as a source of funding for commercial bank asset acquisition leaves over half of the total increase in commercial bank credit of $337 million unaccounted for. Second, commercial bank equity—and with it commercial bank credit—grew disproportionately in frontier areas largely for two reasons: the closing of Second Bank branches stimulated chartering activity, and the prospect of investing in land at the frontier was attractive. In addition, because the state banks that replaced the Second Bank were, to varying degrees, more reliant on equity finance than the Second Bank had been, they were also more inclined than the Second Bank to lend long-term, especially to individuals who provided significant amounts of their equity capital, or to the states that chartered the banks.
By the early 1840s, commercial bank assets and liabilities were contracting rapidly in a classic cycle of falling asset prices and debt deflation, particularly in the South and West.60
Ng found that “the large decline in the [commercial banking] industry from 1840 to 1845 was centered in the West and South,” through “large numbers of closings or failures and large reductions in the assets of existing banks.” “Structure,” p. 37.
Appendix

I would like to thank the editors, two anonymous referees, Michael Edelstein, John Wallis, Carol Heim, David Weiman, and participants in the Columbia University Economic History Workshop for helpful comments on earlier versions of this article. I also thank John Stifler for his able editorial assistance.