Within the broad category of communication breakdowns, nonunderstanding occurs when a listener does not understand the speaker, which contrasts with nonhearing (i.e., the listener does not hear the speaker) and miscommunication (i.e., the listener understands the speaker’s message differently than it was intended). A further important distinction is between misunderstanding (i.e., the listener settles on the wrong interpretation) and nonunderstanding, as only the latter refers to situations when listeners realize that they cannot make sense of a speaker’s utterance (Bremer, Reference Bremer, Bremer, Roberts, Vasseur, Simonot and Broeder1996). In contrast to misunderstanding, which becomes apparent only retrospectively, nonunderstanding is apparent during the conversation and may be remediated. When interlocutors pursue remediation, they make nonunderstanding visible, typically through their use of verbal and visual information to achieve understanding (e.g., Firth, Reference Firth1996; Wagner, Reference Wagner1996). The main objective of this exploratory study was to investigate whether a listener’s behavior during nonunderstanding has a visual “signature” for a second language (L2) speaker, on the assumption that visual cues provided by the listener to the speaker might be perceptible by an observer of the interaction. If the goal of interaction is for interlocutors to exchange information, then it would be important to determine whether specific visual cues are provided when communication breaks down, with the idea that L2 speakers may need to be made aware of such cues.
Researchers from a variety of fields have investigated the verbal and visual information that interlocutors exchange during nonunderstanding. Reflecting the perspective that mutual understanding is a joint endeavor, lingua franca researchers have documented the strategies employed by both speakers and listeners to prevent and resolve nonunderstanding (Björkman, Reference Björkman2014; Cogo & Pitzl, Reference Cogo and Pitzl2016; Kaur, Reference Kaur2010, Reference Kaur2012; Kirkpatrick, Reference Kirkpatrick and Prescott2007; Mauranen, Reference Mauranen and Flottum2007). Just as speakers can use a variety of strategies when they perceive that a listener is having difficulty understanding, listeners can also use strategies to signal their lack of understanding, such as complete or partial repetition with rising intonation or clarification requests. Alternatively, they may decide to “let it pass” (Firth, Reference Firth1996) on the assumption that the information will become clear as the conversation continues or that it is not relevant enough to warrant remediation. The conversation analysis (CA) approach also conceptualizes understanding and the resolution of nonunderstanding as being locally accomplished through the collaboration and coconstruction of meaning by interlocutors (Firth, Reference Firth1996; Wagner, Reference Wagner1996). Through the focus on repair, which includes practices for interrupting ongoing conversation to deal with problems in speaking, hearing, or understanding (e.g., Schegloff, Reference Schegloff1997, Reference Schegloff2007; Schegloff, Jefferson, & Sacks, Reference Schegloff, Jefferson and Sacks1977), CA nonunderstanding research identifies how interlocutors use both verbal messages and visual cues to remediate problems.
Within the interactionist perspective, nonunderstanding has been examined through the lens of interactional moves that speakers use to establish understanding and moves that listeners employ to seek clarification or confirm message content. In early interactionist studies of communication breakdowns (e.g., Gass & Varonis, Reference Gass, Varonis, Coupland, Giles and Wiemann1991; Varonis & Gass, Reference Varonis and Gass1985), conversations between native and L2 speakers were examined for instances of problematic communication, which included phenomena ranging from avoidance behaviors to misunderstanding, with the term incomplete understanding being used for what Bremer subsequently operationalized as nonunderstanding. Numerous interaction studies from the 1980s to present have described how L2 speakers and their interlocutors address nonunderstanding during conversation, focusing on constructs such as the negotiation of meaning, clarification requests, confirmation checks, comprehension checks, prompts, and recasts. Meta-analytic studies have examined the effectiveness of these interactional features at promoting L2 learning in both classroom and laboratory settings (e.g., Li, Reference Li2010; Lyster & Saito, Reference Lyster and Saito2010; Mackey & Goo, Reference Mackey, Goo and Mackey2007; Miller & Pan, Reference Miller and Pan2012; Plonsky & Gass, Reference Plonsky and Gass2011; Russell & Spada, Reference Russell, Spada, Norris and Ortega2006), with overall findings indicating beneficial effects, but with variation across settings, proficiency levels, linguistic targets, and specific interactional moves.
Unlike CA studies that grant a primary role to visual bodily behaviors, such as leans, head direction, head position, holds, facial expressions, and eye gaze in nonunderstanding (e.g., Floyd, Manrique, Rossi, & Torreira, Reference Floyd, Manrique, Rossi and Francisco2016; Seo & Koshik, Reference Seo and Koshik2010), interaction research has largely analyzed interlocutors’ verbal behavior. The relative scarcity of interaction research with an analysis of visual cues is surprising because interlocutors during face-to-face communication are normally visible and draw on both language and paralinguistic features such as gaze, posture, and gesture to coconstruct understanding (Goodwin, Reference Goodwin and Kita2003). Indeed, when discussing interactional feedback, several researchers have acknowledged that nonlinguistic cues in the form of gestures or facial expressions may help orient L2 speakers to the corrective intent of feedback (Gullberg, Reference Gullberg2006, Reference Gullberg2010; Long, Reference Long2007; Lyster, Reference Lyster1998; Nakatsukasa, Reference Nakatsukasa2016). There is also mounting evidence suggesting that the presence of gestures in interlocutors’ speech yields measurable benefits for listener comprehension (e.g., Dahl & Ludvigsen, Reference Dahl and Ludvigsen2014; Sueyoshi & Hardison, Reference Sueyoshi and Hardison2005), although L2 speakers do not always interpret the meaning of gestures accurately (Kamiya, Reference Kamiya2018; Mohan & Helmer, Reference Mohan and Helmer1988). Furthermore, recent classroom-based studies have documented both the verbal information and visual cues that L2 instructors provide in response to student errors (Davies, Reference Davies2006; Faraco & Kida, Reference Faraco, Kida, McCafferty and Stam2008; Wang & Loewen, Reference Wang and Loewen2016), with many feedback moves accompanied by visual cues such as nodding, head shakes, and pointing.
While these findings generally highlight the importance of nonverbal cues in L2 interaction, there is presently little direct evidence that nonunderstanding episodes are associated with specific nonverbal cues provided by listeners when they fail to understand. For example, it is unclear whether the classroom data in prior research included nonunderstanding episodes exclusively because instructors often provide feedback for pedagogical purposes, such as to draw a student’s attention to an error, rather than to remediate actual nonunderstanding. Similarly, although recent laboratory-based research has shown that visual cues in the form of eye gaze (specifically mutual gaze) facilitate targetlike responses to recasts (McDonough, Crowther, Kielstra, & Trofimovich, Reference McDonough, Crowther, Kielstra and Trofimovich2015; McDonough, Trofimovich, Dao, & Abashdize, Reference McDonough, Trofimovich, Dao and Abashidze2018), the interlocutors in these studies were instructed to provide recasts, which makes it difficult to determine whether nonunderstanding occurred. Finally, while a speaker’s use of gestures and other nonverbal cues generally aids listener comprehension (Dahl & Ludvigsen, Reference Dahl and Ludvigsen2014; Sueyoshi & Hardison, Reference Sueyoshi and Hardison2005), it is unclear whether a listener’s use of visual cues signals nonunderstanding to the speaker and whether such cues are detectable by speakers or anyone observing the interaction.
Therefore, in light of the importance of visual cues in face-to-face communication and their documented role in nonunderstanding, this research report first explores whether listeners provide L2 speakers with visual cues that signal their lack of understanding. We expected that nonunderstanding episodes might contain a greater proportion of holds than understanding episodes. Holds have been attested across multiple languages during repair initiation turns “when relatively dynamic movements are temporarily and meaningfully held static” until the nonunderstanding has been resolved and dynamic movements resume (Floyd et al., Reference Floyd, Manrique, Rossi and Francisco2016, p. 176). A range of behaviors can be held static such as gaze, head position, upper body lean, or eyebrows, with release occurring during or shortly after the speaker provides clarification. As to the incidence of other visual behaviors in our data, we made no specific predictions given a paucity of prior L2 research targeting this issue. However, because head nods, frowns, postural changes, blinks, eyebrow flashes, smiles, and laughter have all been attested as interlocutors’ back-channeling signals in communication between native speakers (e.g., Bavelas, Coates, & Johnson, Reference Bavelas, Coates and Johnson2002; Floyd et al., Reference Floyd, Manrique, Rossi and Francisco2016; Johnson, Reference Johnson1991; Knapp, Hall, & Horgan, Reference Knapp, Hall and Horgan2013), we expected that at least some of these cues would emerge in this dataset. We asked the following question:
1. Is there a difference in the listener visual cues that occur in understanding versus nonunderstanding episodes?
In addition to analyzing the occurrence of visual cues, the current report also investigates whether observers of interaction are sensitive to visual cues when assessing the listener’s comprehension. An ideal approach for addressing this issue would be to investigate whether L2 speakers perceive and act on the visual cues provided to them by a listener when communication breaks down. However, because this exploratory study made use of an existing corpus of video-recorded interactions, access to the speakers was not possible. Therefore, we reasoned that (if present) any visual cues provided by the listener to the L2 speaker should also be detectable by casual observers, especially observers from the same speech community. We thus examined whether access to the listener’s visual cues influenced how observers of interaction (henceforth, raters) evaluated the listener’s understanding (i.e., the extent to which the listener understood the intended message). If the raters are sensitive to visual cues of nonunderstanding, then they should use this visual information to judge the degree of listener’s comprehension when this information is available to them. We therefore asked the following question:
2. Does access to listener visual cues affect raters’ assessments of the listener’s comprehension in nonunderstanding episodes?
METHOD
PARTICIPANTS
L2 speakers
The nonunderstanding episodes came from a larger research project in which English L2 speakers carried out communicative tasks with a male, bilingual French-English graduate student (McDonough et al., Reference McDonough, Trofimovich, Dao and Abashidze2018). The 21 L2 speakers (11 women, 10 men) were enrolled in undergraduate (n = 14) and graduate (n = 7) degree programs at an English-medium university in Montreal. They ranged in age from 18 to 34, with a mean age of 24.9 years (SD = 4.5). They spoke six different first languages (L1s), which included Vietnamese (6), Mandarin (5), Farsi (5), Spanish (2), French (2), and Arabic. They reported having studied English for a mean of 10.1 years (SD = 5.1). As for their English proficiency, 10 participants reported TOEFL iBT scores (M = 89.1, SD = 7.8), while the others reported IELTS scores (M = 6.4, SD = 0.4). Based on equivalency tables, the participants’ proficiency was estimated to be at the B2 level in the Common European Framework of Reference.
Raters
The raters represented the population of multilingual English speakers in the large multicultural city of Montreal. They were recruited from the same population of university-level students as the speakers, on the assumption that the raters would resemble potential interlocutors of the speakers as members of the same speech community (e.g., students enrolled in the same courses). The 66 undergraduate students (39 women, 27 men) were studying in a variety of degree programs at the same university as the L2 speakers. They ranged in age from 18 to 56, with a mean of 22.9 years (SD = 5.3). Almost all the raters were multilinguals (n = 53) or bilinguals (n = 11), with only two English monolinguals. Forty-three (65%) of the raters reported either English or French as an L1. The other raters reported L1s of Mandarin (4), Spanish (3), Farsi (3), Cantonese (3), Bangla (2), Bantu, Hungarian, Italian, Punjabi, Tagalog, Ukrainian, Tamil, and Vietnamese. The non-English L1 raters self-evaluated their English proficiency using a 9-point Likert scale (1 = beginner, 9 = nativelike), with a mean ranking of 7.6 (SD = 1.0). In terms of the raters’ familiarity with accented English, their mean score on a 9-point Likert scale (1 = not at all familiar, 9 = very familiar) was 6.9 (SD = 2.0). All raters had previously taken language courses, ranging from English writing or foreign language classes to linguistic courses in phonology or grammar.
MATERIALS
Episode selection
Episodes of understanding and nonunderstanding were taken from a larger study about L2 speakers’ responses to recasts (McDonough et al., Reference McDonough, Trofimovich, Dao and Abashidze2018) where L2 speakers interacted with a graduate student while both interlocutors were video-recorded. Using the transcripts as a guide, 21 nonunderstanding episodes were identified in which the graduate student was listening to the L2 speakers and expressed nonunderstanding of an utterance by requesting clarification (e.g., a what? your what? huh?), after which the L2 speaker reformulated their utterance and the listener signaled comprehension. After identifying the nonunderstanding episodes, 21 comparable episodes of understanding were selected so that each L2 speaker contributed one episode of each type to the rating stimuli. Listener responses that were considered evidence of understanding included noncorrective repetition with rising intonation and follow-up questions. All episodes were chosen based on the transcripts exclusively, without any prior knowledge of whether the videos would contain visual cues. Table 1 provides examples of both episode types. Whereas the listener’s second turn in the nonunderstanding episode was a clarification request (That has what?), it was a follow up question (Oh they would?) in the understanding episode.
Nonunderstanding and understanding episodes

Note: S = L2 speaker, L = listener.
For each pair of episodes from a specific L2 speaker, the length of their initial utterance (first turn) and the listener’s response (second turn) were matched. There were no significant differences between the nonunderstanding and understanding episodes in terms of the duration of (a) the L2 speakers’ initial utterances, t(20) = 0.70, p = .49, d = 0.22, or (b) the listener’s second turn questions, t(20) = 0.57, p = .58, d = 0.11. To validate our classification of the episodes as understanding and nonunderstanding, we also compared ratings of the L2 speakers’ comprehensibility (scores on a 100-point scale) and intelligibility (words correctly transcribed/all words), both provided by the raters as part of the testing procedure (see following text). The L2 speakers were rated as being more comprehensible in the understanding episodes (M = 52.73, SD = 11.04) than they were in the nonunderstanding episodes (M = 40.98, SD = 11.39), t(43) = 10.46, p = .001, d = 1.05. The L2 speakers were also more intelligible in the understanding episodes (M = .49, SD = .07) than in the nonunderstanding episodes (M = .36, SD = .12), t(43) = 7.10, p = .001, d = 1.32.
Rating stimuli
After selecting and validating the 42 episodes, we next edited the videos into short clips (M = 4.5 seconds, SD = 3.3) that showed the listener’s upper body (torso, arms, and face) while listening to the L2 speaker’s initial utterance. The videos were cropped prior to the listener’s utterance in the second turn because access to his response would reveal to the raters whether he had understood. To manipulate the independent variable of access to visual information, three versions of each video were created: clear listener’s face and clear L2 speaker’s voice (+face/+voice), blurred listener’s face with clear L2 speaker’s voice (–face/+voice), and clear listener’s face with distorted L2 speaker’s voice (+face/–voice). Three versions of materials were designed to help determine whether access to the visual information from the listener would enable the raters to detect nonunderstanding, compared to when no visual information from the listener is available.
To create the –face versions of the episodes, the listener’s face was blurred through video editing in Adobe Premiere Pro by using the “mosaic” function to cover the listener’s face from the top of his forehead to his chin with “square blocks.” The horizontal and vertical block was set at 10° of visual angle for all videos. To create the –voice versions of the episodes (so as to make the L2 speaker’s utterance unintelligible), the L2 speaker’s first turn utterance was low- and high-pass filtered in the same software within the range of 400–23,000 Hz and was edited through the “pitch shifter” function by setting up a semitone (temporal setting of –8 milliseconds, at 350 Hz frequency, and a 50% overlap). Videos in each condition were randomized into four lists. Three practice videos from L2 speakers who were not included in the present study were created for each condition. The videos were presented using the EyeWorks 3.0 program where raters clicked on the “continue” button to go to the next video whenever they were ready.
Rating materials
The rating materials elicited the raters’ assessment of the listener’s comprehension, using a rating booklet with the three practice videos and 42 target episodes. The raters watched the video twice; they provided ratings of the L2 speaker’s comprehensibility and the listener’s comprehension after the first viewing. For L2 speaker comprehensibility, a continuous 100-millimeter scale was provided with two descriptive anchor points: hard for me to understand and easy for me to understand. The same 100-millimeter scale was used for the listener’s perceived comprehension, but the anchor points were he understood 0% and he understood 100%. After watching the video a second time, the raters assessed intelligibility by transcribing the L2 speaker’s utterance in the blank space provided. The rating booklet included definitions of the key terms of comprehensibility (i.e., raters’ perception of ease or difficulty in understanding the L2 speaker), perceived comprehension (i.e., raters’ perception of the degree to which the listener understood the L2 speaker’s utterance), and intelligibility (i.e., raters’ accuracy at transcribing the L2 speaker’s utterance). As reported previously, the measures of L2 speaker comprehensibility and intelligibility were used to validate the researchers’ classification of understanding and nonunderstanding episodes by checking whether the L2 speakers’ utterances in the nonunderstanding episodes were indeed of lower comprehensibility and intelligibility than their utterances in the comparable understanding episodes.
DESIGN AND PROCEDURE
For the first research question, the study used a within-groups design to compare the listener’s provision of visual cues during L2 speakers’ initial utterance in the understanding and nonunderstanding episodes. Listener visual cues were operationalized as the categories of the visual behaviors (see following text) such as head nods, blinks, and facial expressions (e.g., frowns, pursed lips) that emerged from observing the listener while he was listening to the L2 speakers. A between-groups design was employed to address the second research question about the impact of access to visual cues on raters’ perceptions of listener comprehension. The independent variable was video type, with three levels created by manipulating the listener’s face (clear or blurred) and the L2 speaker’s voice (clear or distorted). The resulting three conditions were clear face and voice (+face/+voice), blurred face and clear voice (–face/+voice), and clear face with distorted voice (+face/–voice). Our planned comparisons therefore focused on whether rater perceptions would differ based on access to the listener’s face (+face/+voice compared to –face/+voice). The +face/–voice condition was included for comparison, to confirm that access to the listener’s face influenced raters’ assessments, even when they could not hear the L2 speakers’ utterance. A fourth condition of blurred face and distorted voice was not included as the raters would not have had sufficient auditory or visual information to assess the L2 speakers’ speech or the listener’s comprehension.
Raters were randomly assigned to one of three video types, with 22 raters evaluating each. Each rater evaluated the L2 speaker’s comprehensibility and intelligibility along with the listener’s comprehension during an individual 60-minute session. After filling out consent and background information forms (15 min), they read the instructions and definitions of key terms in the rating booklet, asked any clarification questions, and completed the three practice videos (10 min). They then provided ratings for the 42 target episodes (30 min). After completing the videos, the raters were asked to fill out an exit questionnaire (5 min) to explore whether they had any concerns about the procedure.1
DATA ANALYSIS
With the exception of holds, the coding of listener visual cues in the videos followed a bottom-up approach, in the sense that there was no a priori expectation as to which cues would be associated with understanding and nonunderstanding episodes. First, the third researcher analyzed the episodes to determine whether the listener initiated a hold during the listener’s second turn (clarification request or follow-up question). A research assistant (RA) then independently coded the videos for interrater reliability, which yielded a Cohen’s kappa value of .91. Next, the listener’s other visual cues were coded by the third researcher and organized into the following major categories, based on their occurrence in the dataset: (a) head nods, (b) blinks, and (c) facial expressions, which included cues such as smiling, frowning, pursed lips, and raised eyebrows. The raw frequencies of the visual cues observed by the coder in each episode were summed. After establishing the categories, the third researcher watched the videos again to record frequency counts for each category, after which a peer reviewed the videos and frequency counts, with any disagreements resolved through discussion. To assess reliability, an RA independently coded all videos for visual cues. Interrater reliability, assessed using two-way mixed average-measures intraclass correlation coefficients, were .96 for nods, .99 for blinks, and .92 for the combined category of facial expressions.
For the raters’ assessments of the L2 speakers’ comprehensibility and the listener’s comprehension, the location of their checkmarks or crosses on the scales was converted to a numeric score (0–100) by measuring the distance from the leftmost edge of the 100-millimeter scale. For intelligibility, the number of correctly transcribed words was divided by the utterance word length to obtain proportion scores. Words that were unintelligible in the videos and filler sounds (e.g., uh, hmm, mhm) were not included in the calculation. Any repetitions or false starts were only counted once, and differences in contracted/noncontracted forms were ignored (i.e., it is vs. it’s), as were differences in commonly used reductions (e.g., going to vs. gonna) and symbols (e.g., & vs. and). A subset of the ratings (10%) was independently scored by an RA, and interrater reliability, using two-way mixed average-measures intraclass correlation coefficients, was .99 for comprehensibility, .98 for comprehension, and .98 for intelligibility. Alpha was set at .05 for all statistical tests.
RESULTS
LISTENER VISUAL CUES
The first research question asked whether there was a difference in listener visual cues during understanding and nonunderstanding episodes, focusing narrowly on the visual cues that occurred during the L2 speakers’ initial utterance. The coding revealed that there were 18 holds in the nonunderstanding episodes, but only one hold in the understanding episodes. A chi-square test with a continuity correction confirmed that there was a significant association between episode type and holds with a large effect size, χ 2(1, 42) = 24.60, p = .001, Cramer’s V = .81. Turning to the specific types of visual cues (blinks, head nods, and various facial expressions) that emerged from the data, Examples 1 and 2 illustrate how the listener’s (L) visual cues co-occurred with the L2 speaker’s (S) initial utterance in the nonunderstanding and understanding episodes previously shown in Table 1. In the nonunderstanding episode (Example 1), the raters heard the L2 speaker’s utterance and the video showed the listener’s face (L), but their episode ended before he requested clarification (that has what?). During the L2 speaker’s utterance, the listener provides numerous visual cues, including several blinks, pursed lips, and a furrowed brow. By contrast, in the understanding episode (Example 2), the listener does not provide many visual cues during the same L2 speaker’s initial utterance.
Visual cues during nonunderstanding

Visual cues during understanding

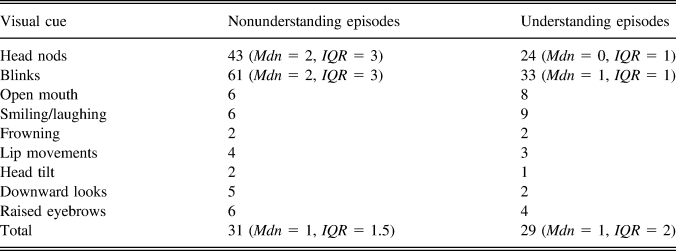
As shown in Table 2, there were descriptive differences in the quantity of visual cues, with nonunderstanding episodes featuring more head nods and blinks than understanding episodes. However, the occurrence of specific kinds of facial expressions was similar across both episode types, as was the total number of facial expressions. As the data lacked normal distribution, the values were compared using separate Wilcoxon signed-ranks tests, which are nonparametric paired-samples t tests. There was a statistically significant difference for head nods, Z = 2.02, p = .043, d = 0.61, a trend toward significance for blinks, Z = 1.72, p = .085, d = 0.57, and no statistically significant difference for the sum of all facial expressions, Z = 0.38, p = .714, d = 0.13.
Frequency of listener visual cues (sum across all episodes) by episode type

RATER ASSESSMENTS
Having established that nonunderstanding episodes have a different visual signature than understanding episodes, the second research question explored raters’ sensitivity to the visual cues associated with nonunderstanding. More specifically, we compared the ratings for the nonunderstanding episodes from two conditions: clear face with clear voice (+face/+voice) and blurred face with clear voice (–face/+voice). Raters who had access to the listener’s visual cues gave lower listener comprehension scores (M = 54.11, SD = 10.35) than raters without access to the listener’s face (M = 62.55, SD = 16.64). An independent-samples t test indicated that the difference in ratings was significant, t(42) = 2.02, p = .05, d = 0.61. To follow up on this finding, we examined the ratings for nonunderstanding episodes from the control condition where raters also had access to the listener’s visual cues but could not hear his utterance (+face/–voice). If listener comprehension ratings reflect orientation to visual cues, then the ratings for the two +face conditions should be similar because the listener’s face alone was sufficient to signal a communication breakdown. In the control +face/–voice condition, the mean rating was 52.17 (SD = 16.23), which did not differ significantly from the mean rating of 54.11 (SD = 10.35) in the +face/+voice condition, t(42) = .03, p = .98, d = 0.14. In sum, the results generally supported the conclusion that the raters were sensitive to visual cues associated with nonunderstanding when rating listener comprehension.2
DISCUSSION
The current exploratory study investigated the occurrence and perception of listener visual cues in cases of nonunderstanding involving L2 speakers. Whereas prior classroom-based research has documented a contingency between the linguistic feedback and visual cues provided by instructors in response to their students’ errors (e.g., Faraco & Kida, Reference Faraco, Kida, McCafferty and Stam2008; Wang & Loewen, Reference Wang and Loewen2016) and access to visual cues has been linked to increased listener comprehension (e.g., Dahl & Ludvigsen, Reference Dahl and Ludvigsen2014; Richardson & Dale, Reference Richardson and Dale2005; Sueyoshi & Hardison, Reference Sueyoshi and Hardison2005), it is still largely unknown how a listener provides nonverbal cues to signal that a breakdown in communication occurred or whether these cues are perceptible to an external observer. In this dataset, nonunderstanding episodes were uniquely associated with holds, which referred to the listener’s temporary cessation of dynamic movements. With holds attested in 18 of the 21 nonunderstanding episodes compared to only one understanding episode, this visual cue appears to clearly distinguish both episode types, which is consistent with prior comparative research on communication breakdowns across several languages (Floyd et al., Reference Floyd, Manrique, Rossi and Francisco2016).
In addition, in the current dataset listener visual cues in the form of head nods and blinking were attested to a greater extent in nonunderstanding episodes than in length-matched understanding episodes. Although these differences were modest (for head nods) or narrowly missed statistical significance (for blinks), they were associated with nontrivial effect sizes, all falling between the benchmarks for small- and medium-strength effects (Plonsky & Oswald, Reference Plonsky and Oswald2014), and were comparable in magnitude to marginal changes for rates of gesture production following negative feedback in native speaker interaction (Hoetjes, Krahmer, & Swerts, Reference Hoetjes, Krahmer and Swerts2015; Holler & Wilkin, Reference Holler and Wilkin2011). For head nods, these findings are consistent with work on native speaker interaction, where head nods with vocalizations such as “mmm-hmm” (Bavelas et al., Reference Bavelas, Coates and Johnson2002) or nods accompanied by frowns, postural changes, eyebrow flashes, smiles, and laughter (Knapp et al., Reference Knapp, Hall and Horgan2013) are used by listeners in back-channeling. Head nods have also been shown to be used by speakers to track their interlocutors’ understanding (Aoki, Reference Aoki, Goodwin, LeBaron and Streeck2011), although specific uses of visual cues, including head nods, might be culture specific (Kita, Reference Kita2009). Similarly, along with raised eyebrow and wrinkled nose, blinking can be used to initiate a repair (e.g., Johnson, Reference Johnson1991), with blinking also linked to affective arousal and cognitive difficulty (Knapp, Cody, & Reardon, Reference Knapp, Cody, Reardon, Berger and Chafee1987), which implies that blinks might signal an interlocutor’s difficulty in understanding. A more refined explanation of how specific interlocutor-provided visual cues map onto an L2 speaker’s utterance, particularly when understanding is compromised, must await future research. In the interim, the pattern that emerges from this dataset is that head nods and (to some extent) also blinks were the two most frequent visual cues associated with nonunderstanding.
As for whether the visual cues of nonunderstanding were perceived by raters, they gave lower ratings for listener comprehension when they had access to the listener’s face, and this effect approached the benchmark for a medium-strength effect (Plonsky & Oswald, Reference Plonsky and Oswald2014). Raters appeared to rely on the visual information available in the listener’s face to judge his comprehension level, crucially, even when the listener’s utterance had been distorted. To the best of our knowledge, this is among the first demonstrations of rater sensitivity to visual cues to nonunderstanding involving L2 speakers, extending prior work on raters’ sensitivity to the visual cues of speaker certainty in native speaker interactions (Krahmer & Swerts, Reference Krahmer and Swerts2005). The current findings also extend prior research showing that L2 speakers are sensitive to various visual cues provided by their interlocutors, using such cues to aid in comprehension (Sueyoshi & Hardison, Reference Sueyoshi and Hardison2005) or to distinguish various functions of teacher talk such as whether the teacher is asking a question or making a statement (Kamiya, Reference Kamiya2018). Nevertheless, given that L2 speakers are not always accurate at interpreting visual cues (Mohan & Helmer, Reference Mohan and Helmer1988), that interlocutors may not distinguish, through their looking behaviors, visual cues provided by native versus nonnative speakers (Gullberg & Holmqvist, Reference Gullberg and Holmqvist1999), and that attending to visual information provided by the interlocutor does not guarantee the uptake of its meaning (Gullberg & Kita, Reference Gullberg and Kita2009), the current preliminary results need to be interpreted cautiously.
With the view of clarifying the role of verbal and nonverbal cues in communication breakdowns, future research should use larger datasets to extend these findings to other types of listeners and raters, such as monolingual and multilingual speakers representing different ages and levels of familiarity with L2 speech. Researchers might also increase the temporal “window” through which they analyze nonunderstanding. Assuming that the holds in head and body movements associated with repair may span more than one turn (Floyd et al., Reference Floyd, Manrique, Rossi and Francisco2016) and may precede verbal appeals for repair (Seo & Koshik, Reference Seo and Koshik2010), researchers should target longer video episodes that include the L2 speaker’s trigger utterance, the listener’s request for repair, and its resolution in the next turns. Another fruitful research avenue would be to examine whether and to what degree potentially conflicting messages are provided through verbal and nonverbal means (Bavelas, Black, Chovil, & Mullett, Reference Bavelas, Black, Chovil and Mullett1990), especially in cases of nonunderstanding (e.g., head nods or smiles accompanied by clarification requests), compared to congruent information (e.g., frowns or raised eyebrows along with appeals for clarification), and whether conflicting verbal–nonverbal information might be more salient to raters. Similarly, researchers must explore potential cross-cultural and cross-linguistic differences in the function and use of various visual cues in interaction (e.g., Aoki, Reference Aoki, Goodwin, LeBaron and Streeck2011; Kita, Reference Kita2009), focusing on language- or culture-specific effects for all participants in interaction as well as for those observing it. More importantly, future work should focus on whether interactants—not just external observers—attend to possible visual cues to nonunderstanding and act on this information, ideally while also employing more rigorous analytical approaches and more complex statistical procedures than those used in this exploratory research. Finally, it would be important to explore the effectiveness of pedagogical interventions that help L2 speakers notice visual cues and use preemptive strategies to prevent communication breakdowns. For now, our finding of a possible visual signature of nonunderstanding in interactions involving L2 speakers awaits further confirmation.