I. INTRODUCTION
One-dimensional (1D) nanomaterials have extraordinary physical and chemical properties in comparison to their bulk counterparts. Reference Li, Zhang, Han, Liu, Tang and Zhou1,Reference Bellew, Bell, Mccarthy, Fairfield and Boland2 Their finite size confines the electron wave functions, resulting in quantized energy levels and a significant modification of the transport and optical properties. Reference Kim, Kim, Na, Yang, Choi, Jeong, Lee and Kim3 1D materials such as nanorods/nanowires are found to have a wide range of applications in photovoltaic, electronics, optoelectronics, plasmonics, etc. Reference Borgström, Immink, Ketelaars, Algra and Bakkers4 For example, tin-doped indium oxide (ITO) is a widely used bulk material in light-emitting diodes (LED), Reference Wan, Dattoli, Fung, Guo, Chen, Pan and Lu5 solar cells, Reference Hill, Banks, Haller, Orazem and Ziegler6,Reference Noh, Han, Lee, Kim, Hong, Han, Shin and Jung7 gas sensors, Reference Xue, Chen, Liu, Shi, Wang and Wang8,Reference Afshar, Preiß, Sauerwald, Rodner, Feili, Straub, König, Schütze and Seidel9 flat panel displays, Reference Cairns, Witte, Sparacin, Sachsman, Paine, Crawford and Newton10 and transparent conducting electrodes. Reference Freeman, Poeppelmeier, Mason, Chang and Marks11 And as such, 1D nanostructures of ITO have attracted much attention recently due to the expected improvement in the performance of various device applications over planar ITO thin film based devices. Reference Joanni, Savu, Desousagoes, Bueno, Defreitas, Nogueira, Longo and Varela12–Reference Dattoli and Lu21
Up to date, two mechanisms have been discussed in ITO nanowires (NWs) growth, namely Au-assisted vapor–liquid–solid (VLS) growth Reference Johnson, Aloni, McCready and Bourret-Courchesne22–Reference Hashim24 and self-catalytic VLS growth. Reference Beaudry, Tucher, Laforge, Taschuk and Brete25–Reference Yamamoto, Morisawa, Murakami and Nakatani27 In Au-assisted VLS growth of ITO NWs, the growth temperature is above 800 °C and the complete removal of catalyst Au particles poses a challenge to obtain high purity ITO NWs. In self-catalytic VLS growth, however, the material to be grown as nanowires itself acts as a catalyst for nanowire growth. The growth temperature is much lower (below 400 °C), but the main drawback still remains in the effective control over the diameter of the nanowires. Therefore, new processes are in dire need to address these issues.
Polymer monodisperse microspheres with large specific surface area, strong adsorption, aggregation, and surface reaction ability have been used in the field of medical immunology, biological engineering, chemical industry, and microelectronics. Reference Li, Yang and Huang28–Reference Zhao, Zhao, Wu, Zhang, Deng, Hu, Chen and Peng32 The polystyrene (PS) spheres with the characteristics of transparency and corrosion resistance are widely used as masks. Reference Huang, Yun, Wang, Ding, Li, Wang, Zhang, Guo, Su, Liu and Hou33 The PS has two kinds of decomposition in the 280–300 °C, one being the main chain broken, and the other the side chain broken. The material is still polymer after main chain broken, but the benzene, styrene, and other volatile gases are produced successively by the side chain broken (the schematic diagram is shown in Supplement Material Sec. 1). For PS spheres, the surface deformation (expansion and irregularities) occurs preferentially when the surface viscosity is enhanced.
In this study, we report our experimental results using PS as assisted material to grow high quality ITO NWs with controllable size and density at 300 °C, by means of electron-beam deposition. This method prepared PS spheres on substrate by self-assembly, followed by the use of electron beam evaporation (EBE) to fabricate ITO NWs via PS sites. PS were then removed by annealing to obtain ITO NWs with uniform distribution and better crystal quality. The density of NWs was regulated by the density of PS spheres. Scanning electronic microscopy (SEM), transmission electronic microscopy (TEM), X-ray diffraction (XRD), and X-ray photoelectron spectroscopy (XPS) were used to analyze the morphology, structure, and composition of the so grown ITO NWs. A careful observation of the morphology of NWs in different growth stages was conducted as a means to investigate, the control factors of different growth density. Finally, this novel growth method was applied to a special pyramidal substrate to form a dense ITO NW networks, serving as an effective transparent conductive electrode for optoelectronic devices.
II. EXPERIMENTAL
A. The preparation of ITO NWs
Sample preparation started with a hexagonally-ordered monolayer template of PS (size of 670 nm) spheres coated on quartz or GaN wafer by self-assembly. PS spheres were then etched by oxygen plasma to modify the morphology of the template. ITO source (In2O3:SnO2 = 90:10, wt%) was then deposited on the template by EBE at a deposition rate of 0.1 nm/s for 15 min, with the chamber temperature stabilizing at 300 °C and pressure less than 5 × 10⁻⁴ Pa. PS residuals were removed by annealing at 300 °C for 10 min under the nitrogen condition, as the last step to complete the growth of ITO NW networks.
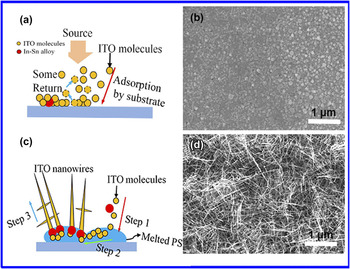
Since the EBE deposition of ITO is a dynamic gas and solid phase transformation process, the vaporized ITO molecules reaching the substrate surface will be either adsorbed or coagulated. Some indium–tin (In–Sn) alloy liquid droplets have formed, when the temperature is above 160 °C (In–Sn eutectic melting point is generally in the 120–160 °C Reference Kumar, Gaddam, Rao and Rajanna34 ). If no PS spheres were present on the substrate, the surface adsorption capacity of substrate would be relatively small. Most of the hybrid molecules (In2O3, SnO2) would be adsorbed and grown on the entire substrate, while a small portion would be bounced back, as shown in Fig. 1(a) and substantiated by the SEM morphology in Fig. 1(c). Under such conditions, the In–Sn alloy droplets were covered by the particles of hybrid molecules to form a dense film on the substrate, instead of growing along any fixed crystal orientation and forming NWs.
The growth schematic diagrams and SEM images of PS-assisted ITO NWs. (a) The substrate without PS, most of ITO molecules were adsorbed and get together on the substrate, while another portion of the molecules was bounced back; (b) the substrate with PS spheres. Step 1: ITO molecules were adsorbed by the molten PS; step 2: some molecules are adsorbed directly on the surface of In–Sn alloy; step 3: the ITO NWs begin to grow. The SEM images of deposited ITO on GaN substrate (c) without PS, and with (d) 670 nm diameter of PS spheres.

When the substrate is coated with PS spheres, however, the PS is in the molten state under the temperature of 300 °C, and the surface adsorption energy is larger. In this case, the ITO molecules and In–Sn alloy are adsorbed preferentially by the melted PS spheres. In–Sn alloy keeps its liquid sate in PS, and more impinging atoms will be absorbed because of the higher sticking coefficient. Nucleation occurs at the droplet/PS interface, resulting in the ITO NWs growth.
B. Structural analysis of NWs
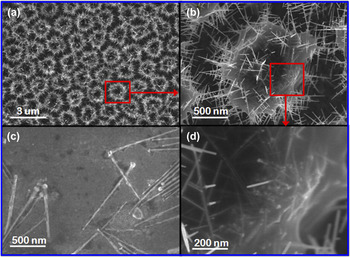
To verify the existence of In–Sn alloy particles with ball shape in the root of needle NWs, the substrate with PS spheres (670 nm) was used to grow ITO NWs by using the previous conditions for deposition 10 min. The results were showed in Fig. 2(a). One of them was selected for a more detailed observation, as shown in Fig. 2(b). Since PS was transparent material, the internal structure could be seen from the circled region [Fig. 2(d)]. The particulate matter was the nucleus of ITO and the slightly raised surface was the precipitation of ITO NWs. Then, this sample was soaked in chloroform for 30 min under ultrasonic condition. When the PS was dissolved away, some NWs fell in the solution without any damage. The fallen NWs were salvaged by a silicon wafer from the solution, and observed by SEM after dry naturally, as shown in Fig. 2(c). It can be seen that the root of needle NWs have the ball-shaped In–Sn alloy particles.
(a) The SEM image of intermediate in NWs growth process; (b) the magnified view of circled ITO NWs on a separate PS sphere; (c) the image of ITO NWs after removing the PS; (d) the initial morphology of ITO NWs growth in the interior of PS.

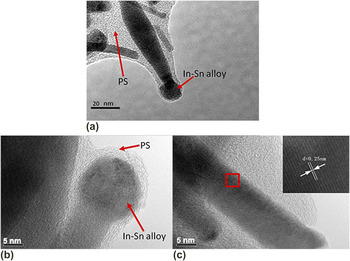
The TEM was used to characterize the structure of the fabricated NWs. At the initial stage of NWs growth, the In–Sn alloy and the nanowires were coated by PS. from Fig. 3(a), the alloy particles were trying to get rid of the shackles of PS by the continuous growth of NWs. Figures 3(b)–3(c) show the high resolution TEM (HRTEM) images of the In–Sn alloys (at the root of nanowires) and the trunk of NWs. The ball particle of In–Sn alloys was polycrystal in Fig. 3(b). When the propelling force from NWs growth was less than the binding force of PS, the alloy particles were wrapped in PS [Fig. 3(b)]. Fig. 3(c) clearly showed the high degree of crystallinity with clear lattice fringes. Spacing between the lattice fringes was found to be 0.25 nm, which was well coincided with the “d” spacing of the (400) plane of the cubic phase of In2O3. Reference Fung, Sun, Ng, Ng, Djurišić, Chan and Chan16,Reference Li, Chen, Kim, Xu, Zhao and Ziegler35,Reference Wang, Lu and Wu36
(a) The TEM image of ITO NWs at the beginning stage of growth; the HRTEM images of (b) the root part of needle-shaped NWs; (c) the trunk of NWs.

III. RESULTS AND DISCUSSION
A. The effects of density and temperature on NWs
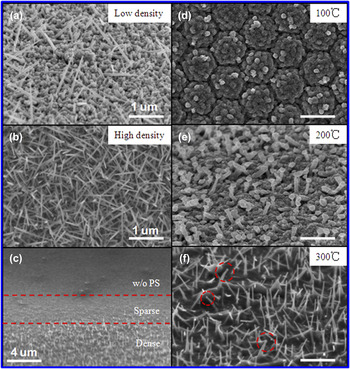
Based on above description and results, the morphology of NWs could be adjusted by the size of self-assembled PS spheres. The density control of ITO NWs was also a prerequisite for the wide application, and which could be controlled by the density of PS spheres. Different density of PS spheres monolayer was prepared by configuring different concentrations of PS spheres dispersion in alcoholic solution (see Supplement Material Sec. 2). The fabricated NWs via PS spheres monolayer using the dispersion concentration with 15% show in Fig. 4(a), and the concentration is 65% in Fig. 4(b). The density of ITO NWs in Fig. 4(b) is denser than that in Fig. 4(a). If we pull the substrate with acceleration from PS dispersion, the distribution of PS spheres has shown a dense to sparse. Based on this substrate, the growth morphology of NWs is shown in Fig. 4(c).
The images of ITO NWs with different density: (a) low density; (b) high density; (c) gradient density. And the images of NWs on different deposited temperature: (d) 100 °C; (e) 200 °C; (f) 300 °C. The scale bar is 500 nm in (d–f).

To research the effect of temperature on the growth of NWs, the temperature 100 °C (lower than the In–Sn alloy’s eutectic point and melting point of PS), 200 °C (higher than In–Sn alloy’s eutectic point, but lower than the melting point of PS), and 300 °C (higher than In–Sn alloy’s eutectic point and melting point of PS) were selected, while ensuring other conditions remain unchanged, then depositing for 10 min with PS spheres of 500 nm. When the preset temperature of EBE chamber is reached, stable for 20 min, it’s to ensure the uniform temperature of sample. Figures 4(d)–4(f) show the morphology of ITO after deposition at different temperatures. When the deposition temperature is low (100 °C), the PS spheres and In–Sn alloy cannot melt and the adsorption capacity of substrate is much weaker. That result in most vapor molecules return to the cavity, so the crystal nucleus is difficult to generate and the condensation happens only on the large aggregates. We can see some large ITO particles on the surface of PS spheres from Fig. 4(d). At 200 °C, the In–Sn alloy is in molten state, while the surface of PS spheres has a certain adhesion due to long time baking. But the adhesive force is too weak to astrict the droplets, the ITO NWs with ball-shaped head begin to grow [the mechanism like as the described with Fig. 1(b)], the SEM image shown as Fig. 4(e). When the substrate temperature is 300 °C, all the PS spheres have been melted and the adsorption capacity is so stronger. The hybrid molecules were adsorbed by the molten PS spheres, and the In–Sn alloy droplets were caught by PS, resulting in the nucleation. The needle-shaped nanowires began to grow based on these nuclei, shown as Fig. 4(e). Meanwhile, a small amount of In–Sn alloy particles escaped from PS, and then few NWs with ball-shaped head were formed, as shown in the red circle in Fig. 4(e).
B. XRD analysis
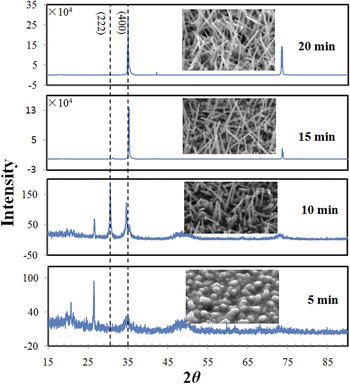
To determine the appropriate growth time, the crystal quality at different growth time has been analyzed. The morphology and XRD of ITO NWs at different growth stages have been shown in Fig. 5. The monolayer film of PS spheres was prepared with same size (∼670 nm) at the same dispersion concentration on four GaN substrates, and then the ITO was deposited for 5, 10, 15, and 20 min under the same condition. As can be seen, the crystal orientation is not determined and the miscellaneous peaks appear more at the initial stage of ITO NWs growth. With the growth, the crystal orientation is along [100] direction. Reference Yu and Lee37–Reference Dam, Wang and Lee39 The morphology of NWs becomes smooth and uniform. The diffraction lines show the growth structure of samples. The intensity of the two major (222) and (400) peaks at 2θ = 30.5 and 35.4° in ITO NWs film after growth 15 min is more obvious than that in ITO NWs at the initial stage (<10 min). It is indicated that the PS-catalytic ITO NWs have better single crystal quality after growth of 15 min.
The morphology and XRD results of ITO NWs at different growth stages. From bottom to top, the growth time is 5 min, 10 min, 15 min, and 20 min, respectively.

C. XPS analysis
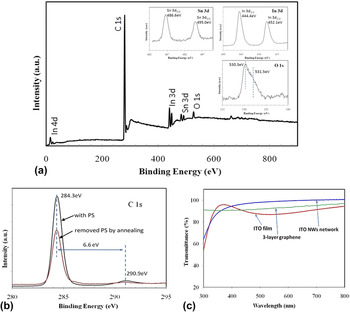
The XPS was used to verify the composition of ITO NWs. Reference Kumar, Rao, Rajanna and Phani26 The sample was prepared by using 670 nm PS spheres for growth 15 min. Figure 6(a) shows the survey spectrum recorded on the ITO NWs film in the binding energy range of 0–900 eV. The survey spectrum shows the presence of In, Sn, O, and carbon elements without any other impurities. Presence of Sn in the survey spectrum confirms the doping of Sn into the In2O3 nanowires. The core level spectra of In 3d, Sn 3d, C 1s, and O 1s are shown in the inset figures, respectively. The core level spectrum of the In 3d shows the peaks centered at 444.6 eV and 452.1 eV, which correspond to the In 3d 3/2, In 3d 5/2 respectively. Similarly, Sn 3d core level spectrum shows the peaks centered at 486.8 eV and 495.2 eV, which correspond to the Sn 3d 5/2 and In 3d 3/2 respectively. The high resolution spectrum of asymmetric O 1s was de-convoluted and shown two peaks centered at 530.3 eV and 531.5 eV respectively. The peak at 530.3 eV can be assigned to In2O3 related oxygen, while the other peak at 531.5 eV assigned to SnO2 related oxygen. Reference Maestre, Cremades, Gregoratti and Piqueras40,Reference Nguyen, Vaddiraju and Meyyappan41
The XPS spectra recorded from the ITO NWs network. (a) The survey spectrum, the images is the core level spectrum of Sn 3d, In 3d, and O 1s. (b) The core level spectrum of C 1s with PS and w/o PS. (c) The transmittance of ITO film, ITO NWs film, and 3-layer graphene.

The spectrum shows that the intensity of C 1s peak is particularly strong. The peak centered at 284.3 eV corresponds to the –CH2– in the polystyrene polymer. There is a hump at 290.9 eV, at a distance of ∼7 eV from the main peak, the intensity of which is 1/5 of the main peak. It’s due to the П electronic transitions in aromatic ring π → π*. Reference Pan and Prest42 Next, the sample is annealed at 300 °C for 20 min under the nitrogen condition, so that the residual PS is decomposed fully. Then the sample is tested again by XPS, the peaks of other elements are unchanged except for the C 1s peak. From Fig. 6(b), the main peak of C 1s decreased and the peak of 290.9 eV disappeared, which means the polystyrene has been cleared. Meanwhile, it’s clear that the pure ITO NWs by thermal annealing can be obtained. And this result shows that the polystyrene did not participate in any reaction in the process of ITO NWs fabrication, only as assisted material.
D. Application of ITO-NW networks
According to the discussion about the diameter of PS, growth temperature, as well as growth time, the ITO NWs networks was used to test the performance, which were prepared by PS spheres of 670 nm for 15 min at 300 °C. ITO bulk film and ITO NWs network film shown in Fig. 6(c) were both fabricated on quartz substrate and annealed for 20 min at 300 °C under the nitrogen ambient. The transmittance of ITO NWs has improved significantly than ITO bulk film after the wave length of 400 nm. The transparency of ITO NWs film at 521 nm increased to 96% while ITO bulk film shows improvement up to 84%. The gap between NWs is much larger than the one in dense bulk film. Although the surface with NWs has lower reflectivity but larger absorption due to light trapping effect, Reference Wan, Xu, Chen, Gan, Guo, Xu and Chen43–Reference Sivakov, Andra, Gawlik, Berger, Plentz, Falk and Christiansen45 the transmittance still has some improvement. Comparing with the transmittance of graphene (three layers), Reference Kim, Lee, Jung, Baik, Mastro, Hite, Eddy and Kim46,Reference Pang, Hernandez, Feng and Müllen47 the transmittance of ITO NWs network is better than that of graphene at visible wave length. Whereafter, the sheet resistance was measured by using four-probe method, the ∼16 Ω/□ for ITO film, ∼200 Ω/□ for ITO NWs network, and ∼400 Ω/□ for three-layer graphene. The sheet resistance of ITO NWs network is larger than that of the bulk material, because there are some air gaps in the intertwined NWs. But, the sheet resistance of ITO NWs network is better than that of graphene, which shows the network has good lateral conductivity.
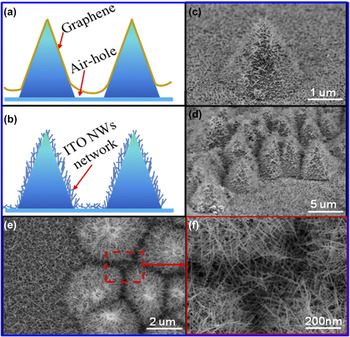
In our previous works, ITO NW networks have been found the bipolar resistive switching behaviors, Reference Li, Gong, Wang, Wang, Zhang and Yun48 and used as a transparent conductive layer to improve the light extraction efficiency. Reference Li, Gong, Li, Liu, Feng, Liu and Yun49 Now, it can replace the graphene on the device with special morphology. The graphene was always used as a conductive electrode on the pyramid shaped nano-LED or flexible LED, Reference Wang, Ma, Liu, Yi, Zhu and Wang50 but a problem was often faced that there are some air holes between the two near pyramids, as shown in Fig. 7(a). The graphene has a certain mechanical strength and cannot fit with pyramids completely. The ITO NWs network prepared by PS-catalytic method is a good solution to this problem, as shown in Fig. 7(b). Figure 7(c) is the SEM image about a single pyramid with ITO NWs network, the surface of the pyramid was covered by ITO NWs network completely. Figure 7(d) is the side view about a group of pyramids covered by ITO NWs network. Figure 7(e) is the plan view SEM image, and Fig. 7(f) is an enlarged view of the interstices between pyramids. So, the ITO NWs were intertwined with each other to form a dense network, which connected each pyramid very well. The ITO NW networks not only have tightly contacting with special morphology structures, but also have the characteristics of high transmission and low resistivity. As a new type of conductive film, the ITO NW networks have a broad application area.
The schematic diagrams of (a) graphene (b) ITO NWs network on pyramids. The SEM images of ITO NWs network on (c) a single pyramid (d) a group of pyramids. (e) The plan view of ITO NWs network on pyramids. (f) The enlarged view of the interstices between pyramids.

IV. CONCLUSIONS
In conclusion, this work presents a method to grow ITO NWs using PS spheres as assisted material at low temperature by electron beam evaporation deposition. The growth mechanism of PS-assisted ITO NWs was analyzed in detail. Through analyzing the effect of the size and density of PS spheres on ITO NWs’ morphology, and the analysis of the growth temperature and time in the process of deposition, the optimal growth program was selected. The ITO NW networks film with better optoelectronic properties was fabricated by the PS spheres of 670 nm at 300 °C for depositing 15 min, and annealing for 20 min at 300 °C under the nitrogen ambient. The transmittance of which is above 90% after 400 nm and the sheet resistance is ∼200 Ω/□. This kind of ITO NW networks can replace the graphene as conductive layer on some devices with special morphology, which have a strong researching and application value.
Supplementary Material
To view supplementary material for this article, please visit https://doi.org/10.1557/jmr.2017.110.
ACKNOWLEDGMENTS
This work was supported by the grant from the National High Technology Research and Development Program of China (No. 2014AA032608), the National Key R&D Program of China (No. 2016YFB0400801), the National Natural Science Foundation of China (No. 61404101) and the China Postdoctoral Science Foundation (No. 2014M562415). The TEM work was done at International Center for Dielectric Research (ICDR), Xi’an Jiaotong University. The authors also thank Dr. Feng for his help in using TEM.