1. Introduction
In the era of big data, digital technologies are increasingly used in many – if not all – industries, including the provision of digital products and services online, robotized production processes, digital systems to manage back office tasks, the Internet of things (IoT), big data, and artificial intelligence (AI). Advanced technology adoption has been widely studied in the literature (e.g., Erat and Kavadias, Reference Erat and Kavadias2006; Chronopoulos and Lumbreras, Reference Chronopoulos and Lumbreras2017). The growing corporate digital divide raises the concern that frontier firms will take all, while laggard firms will be crowded out (Autor et al., Reference Autor, Dorn, Katz, Patterson and Van Reenen2020). For example, companies such as Kodak, Blockbuster, and Research in Motion (RIM) were late in recognizing and applying new technology, thus witnessing their rapidly decreasing market share and profits.
The insurance industry, without exception, is also experiencing a digital transformation. Tech giants, like Apple, Google, and Alibaba, are getting involved in the insurance markets. 64% of the world’s 25 largest insurers have already invested directly or indirectly via their venture capital arms in InsurTech startups (Gartner, 2006). However, there is limited evidence for the winner-takes-all phenomenon in the insurance industry or even a positive correlation between new technology adoption and the market share for insurers.
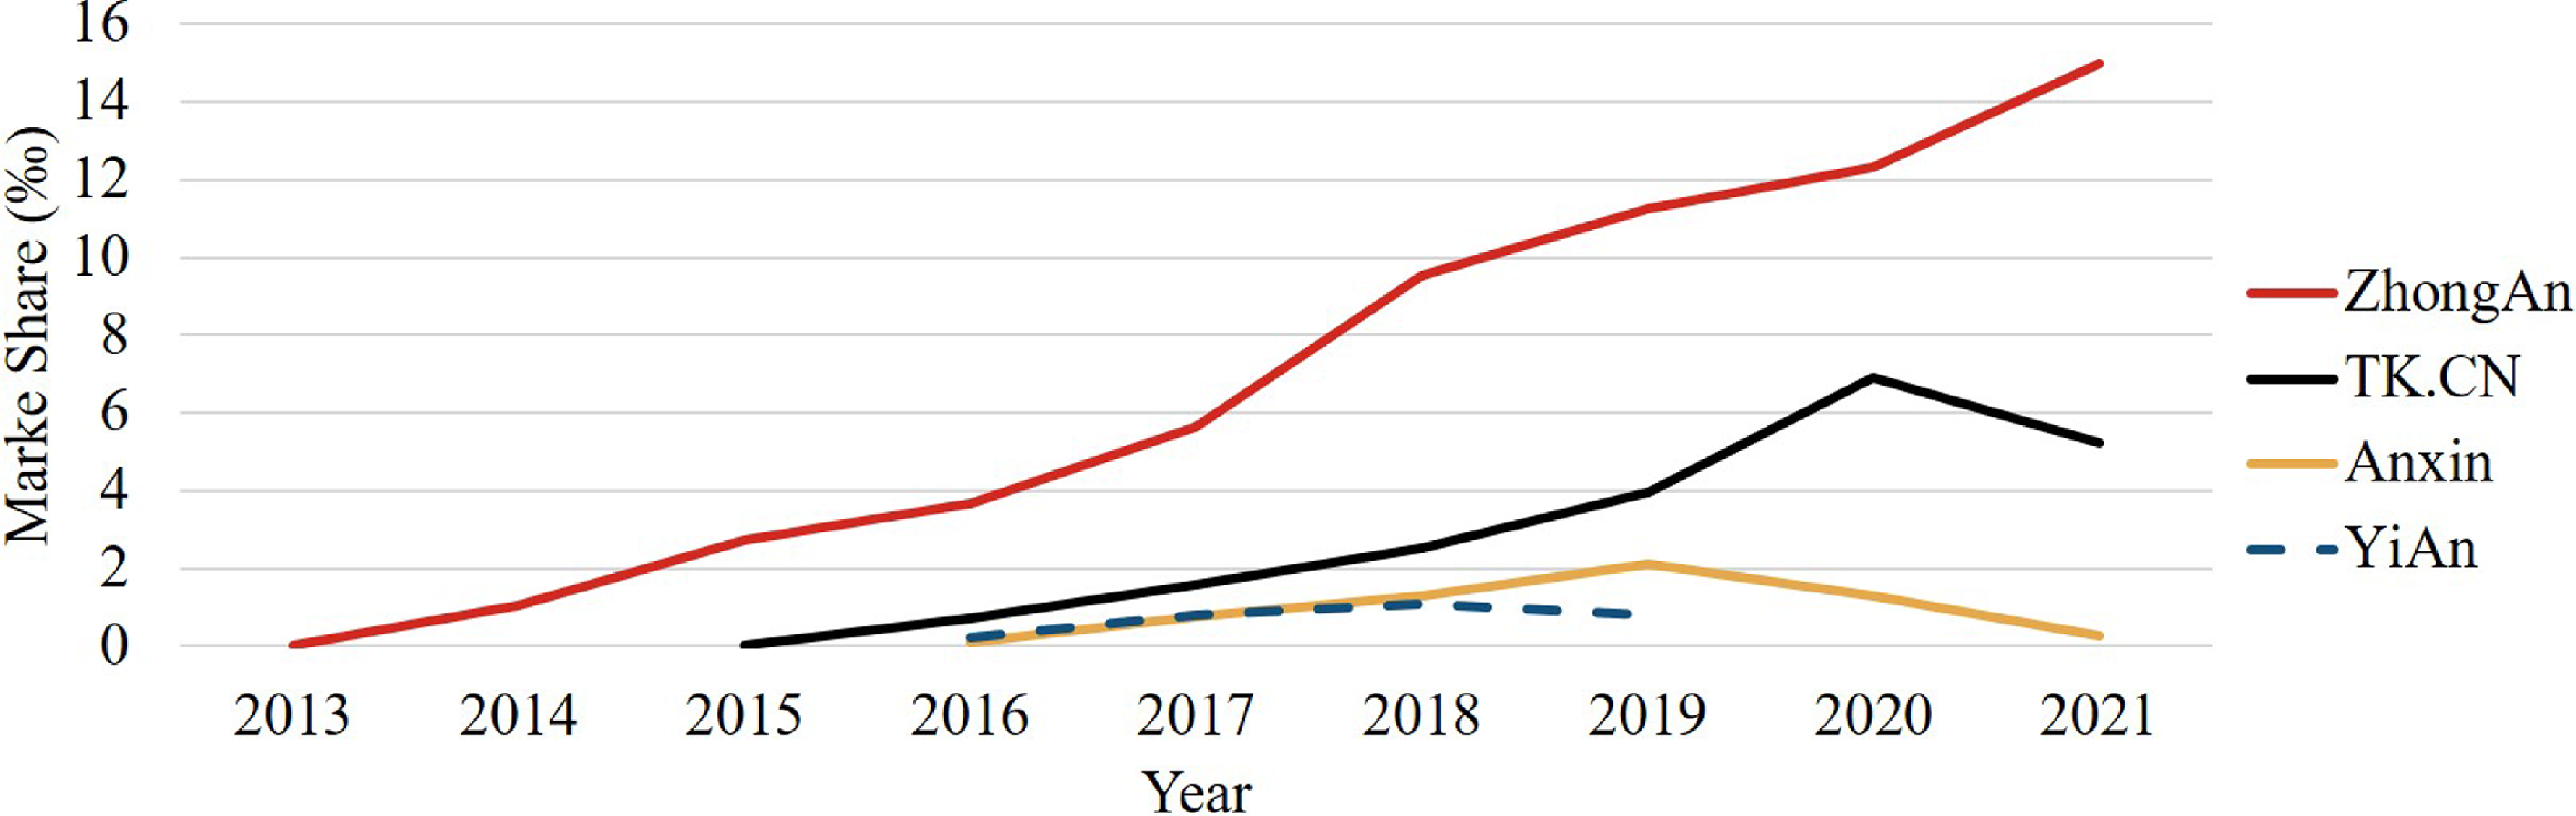
Take the entrance of Internet-based insurance companies in China as an example. Four Internet-based property and casualty (P&C) insurance companies in China have been approved by the China Banking and Insurance Regulatory Commission (CBIRC). They can price, quote, and issue digital policies in rapid manner to a market of over 1 billion people. As shown in Figure 1, only the market share of ZhongAn kept increasing since its market entry, reaching 16‰ in 2021. In contrast, both TK.CN and Anxin have experienced decreasing market share in recent years. YiAn announced bankruptcy in 2019 and is currently under reorganization.
Market share of internet-based insurers in China. Notes: The market share is calculated by the ratio of the annual premium income of an insurance company to the national premium income. Data on the national premium income and the premium income of the four insurance companies are collected from the China Banking and Insurance Regulatory Commission.

Motivated by recent academic and industrial studies on technology adoption, we focus on the impact of new technology on the operational costs of insurers and the search costs of customers. Our aim is to clarify the unclear relationship between new technology adoption and market share for insurers. Specifically, for insurance companies, the application of new technology entails additional costs (Eling and Lehmann, Reference Eling and Lehmann2018), but provides ample opportunities to improve efficiency and cut expense ratios, including automating claims processing, underwriting decisions, subrogation decisions, and others (Yang et al., Reference Yang, Ng, Cheng, Sun, Shao and Li2024). During the insurance purchasing process, customers may encounter various search costs related to understanding premiums, terms and conditions, and any additional features or benefits. New technologies, like applications with clear guidance on mobile phones and automated advice via chatbots, greatly improve their shopping experience (Albrecher et al., Reference Albrecher, Bommier, Filipović, Koch-Medina, Loisel and Schmeiser2019). These technologies enable customers to easily access product information, conveniently compare different products, and quickly get answers to simple questions.
This paper proposes a theoretical framework featuring a continuum of customers who differ in their original search costs and two insurers with their operational costs as private information: One insurer has access to a new technology, while the other does not. We feature the tradeoff an insurer faces when deciding on whether to apply the new technology: while applying the technology brings additional costs, the technology reduces its original costs and lowers customers’ search costs to learn its product. Customers observe insurers’ decisions on technology adoption, update their beliefs on insurers’ premiums, and make sequential searching and purchasing decisions. By examining the competition between the two insurers, we find that insurers’ technology accessibility helps explain the relationship between technology adoption and market share when it is unobservable to customers.
Unobservable technology accessibility is an important assumption in our model. Intuitively, customers can observe whether a new technology is applied and know that an insurer has access to that technology once it is implemented. However, when the technology has not been applied, customers may not be able to observe insurers’ technology accessibility. Various factors can influence a company’s decision not to apply new technology (Forman, Reference Forman2005; Galliano and Roux, Reference Galliano and Roux2008; El-Gohary, Reference El-Gohary2012), which can be categorized into two types – no/limited access to the technology and no incentive to apply the technology despite having access. Insurers may lack access to a new technology due to their lack of necessary capabilities (Swiss Re, 2020; Shakina et al., Reference Shakina, Parshakov and Alsufiev2021), like cooperation with technology firms, technicians, and relevant data, all of which may not be observable to customers. For example, it is not difficult for an insurance company to launch a mobile App. However, a professional IT team and considerable computing ability are important to enable a pleasant experience for users, by offering AI custom service, personalized advertisement, and so on. Some insurance companies may rely on their mature old-fashioned underwriting system, expect limited customers from the online channel, and thus have no incentive to upgrade their Apps even though they have or can build a professional IT team. Others may simply lack the ability to hire or build such a professional IT team. It is difficult for customers to distinguish these two kinds of companies. Therefore, we assume that insurers’ technology accessibility is unobservable to customers.
In this paper, we explore the positive and negative impact of insurers’ technology accessibility on their market share. First, when technology accessibility is observable, an insurer can always increase its market share by acquiring access to a new technology, no matter whether it applies the technology or not. However, when technology accessibility is unobservable, an insurer may not always benefit from its access to a new technology. When it does not apply the technology, it becomes indistinguishable to customers from its competitor who lacks access to the technology. Additionally, unobservable technology accessibility leads customers to assume that the competitor may also have access to the technology, resulting in an underestimation of the competitor’s costs. In such cases, the insurer may earn a lower market share due to its access to the new technology. Even when the insurer applies its available technology, it may still earn a lower market share because of the negative premium effect and customer-belief effect.
These results help to explain insurers’ technology adoption decisions and market share in practice. First, our findings indicate that an immature technology (i.e., a technology that is not cost-saving enough and/or requires significant additional investment) can also be optimally applied when insurers’ technology accessibility is unobservable. Although a new technology is more likely to be applied with unobservable technology accessibility, this does not necessarily lead to an increase in market share for the insurer. This observation aligns with the relationship between insurers’ technology adoptions and market share in practice. Moreover, a comparison between our main model, the no-technology case, and the observable-accessibility case suggests that making information about technology accessibility public increases both the market share of the insurer with technology access and customers' welfare.
Our paper also contributes to the literature in the following ways. First, it contributes to the ongoing discussion on the impact of digital technology in the insurance markets from the perspective of operational costs of insurers and search costs of customers. A growing body of literature (see e.g., Eling and Lehmann, Reference Eling and Lehmann2018; Albrecher et al., Reference Albrecher, Bommier, Filipović, Koch-Medina, Loisel and Schmeiser2019; Fritzsch et al., Reference Fritzsch, Scharner and Weiß2021) and numerous industry reports (see e.g., McKinsey, 2015; Kearney, 2020) have analyzed the impact of digital technology with qualitative analysis. However, limited theoretical studies have revealed how digital technology changes the insurance market equilibrium. Filipova-Neumann and Welzel (Reference Filipova-Neumann and Welzel2010) and Eling et al. (Reference Eling, Jia, Lin and Rothschild2022) employ a theoretical framework to analyze the impact of insurers’ improving risk assessment with digital technology. Bardey et al. (Reference Bardey, De Donder and Mantilla2019) and Gemmo et al. (Reference Gemmo, Browne and Gründl2019) analyze from the perspective of privacy concerns and regulation. However, the literature still lacks a theoretical framework to analyze the impact of digital technology in terms of insurers’ operational costs and customers’ search costs, whose importance has been documented (see, e.g., Bauer et al., Reference Bauer, Leverty, Schmit and Sydnor2021). To the best of our knowledge, we are the first to develop a model to analyze the impact of changing costs of both insurers and customers due to technology on the market equilibrium.
Second, our work also complements the literature on asymmetric information in insurance markets by presenting the impact of insurers’ technology accessibility, considered as private information, on the insurance market structure. Asymmetric information on individuals’ risk types is a domain topic in the literature (see e.g., Rothschild and Stiglitz, Reference Rothschild and Stiglitz1976; Kunreuther and Pauly, Reference Kunreuther and Pauly1985; Hau, Reference Hau2008). Cooper and Hayes (Reference Cooper and Hayes1987), Nilssen (Reference Nilssen2000), and de Garidel-Thoron (Reference de Garidel-Thoron2005) analyze the asymmetric information among insurers due to asymmetric learning. That is, incumbent insurers know the risk types of their customers by learning, but do not share with other insurers. All studies above consider that individuals have a better understanding of their potential loss; however, Villeneuve (Reference Villeneuve2005) argues that insurance companies may be better able to assess the risk type of individuals than individuals themselves. Seog (Reference Seog2009) considers a model with double-sided asymmetric information on two types of risks. In this paper, we consider a different type of asymmetric information – insurers’ technology accessibility. Insurers know exactly whether they have access to a new technology or not, while customers may not know. Our results show that the asymmetric information of technology accessibility helps explain the relationship between technology adoption and market share in practice.
The rest of the paper is organized as follows. In Section 2, we set up our model. In Section 3, we describe the resulting equilibria in our model and two benchmark cases – the no-technology case and the observable-accessibility case. We analyze the comparison among these three equilibria in Section 4 and offer numerical examples in Section 5. Then we conclude in Section 6. All proofs are provided in appendices.
2. Model
2.1 Basic setup
We consider an insurance market with one unit mass of customers, each facing an independent probability
 $\theta$
of incurring a loss of size L out of their initial wealth W. Since customers have the same probability of loss and loss size, insurers have no incentive to offer different premiums. Thus, the operational costs of insurers are equally shared among their customers and modeled on a per-contract basis. There are two types of insurers, a and b, who offer full coverage insurance to compete for the unit mass of customers with premiums
 $P_a$
and
 $P_b$
, respectively. The setting that insurers compete over prices for a fixed product is widely used in literature (see e.g., Einav et al., Reference Einav, Finkelstein and Cullen2010; Eling et al., Reference Eling, Jia, Lin and Rothschild2022). As we focus on the difference between the two types of insurers, for simplicity, two representative insurers a and b are considered for the following analysis. Insurers a and b differ in their per-contract costs, denoted by
 $c_a$
and
 $c_b$
, which are their private information (see, e.g., Chiang et al., Reference Chiang, Chhajed and Hess2003). Thus, for the costs of insurer i (
 $i=a,b$
), the other insurer and customers expect that it is distributed over the interval
 $[0, c_{max}]$
with a cumulative distribution function F(c) and a continuous probability density function f(c).
Customers are assumed to be risk averse, all sharing the same utility function
 $u(\!\cdot\!)$
. This utility function is twice differentiable, strictly increasing, and concave, that is,
 \begin{equation} u'(\!\cdot\!) \gt 0 \ \textrm{ and} \ u''(\!\cdot\!) \lt 0.\end{equation}
Customers do not know the premiums of either insurer before their search and vary in their search costs to learn about them. The search cost includes the time and money spent to acquire information about the products before purchasing and is considered in utility units (Posey and Yavaş, Reference Posey and Yavaş1995; He et al., Reference He, Li, Li, Li and Hu2024). We index customers by their search costs, denoted by
 $\phi$
, and assume that it is uniformly distributed over the interval
 $[0,\Phi]$
(Posey and Tennyson, Reference Posey and Tennyson1998). For the customer
 $\phi$
, it cost
 $\phi$
to learn the premium of either insurer a or b, and a double search cost
 $2\phi$
to learn the premium of both (Robert and Stahl, Reference Robert and Stahl1993). We consider a sequential search process, in which customers first choose one insurer to learn about and then decide whether to search again based on the learned premium (Stahl, Reference Stahl1989; Ellison and Wolitzky, Reference Ellison and Wolitzky2012). Besides, we assume free recall, meaning customers can return to previously visited insurers without any additional costs (Tse, Reference Tse2006; Janssen et al., Reference Janssen, Pichler and Weidenholzer2011).
We introduce a new technology to the insurance market as follows. We consider that only insurer a has access to the new technology, which is unknown by all customers. Moreover, customers are assumed to expect both insurers to have access to the new technology, and thus believe that insurer b has access to it but has not applied it. This assumption can be generalized by considering that customers expect each insurer to have access to the new technology with a probability q. Our assumption is equivalent to setting
 $q=1$
. Allowing for this generalized assumption does not affect our results, as it does not change the situation where insurer a cannot distinguish itself from insurer b when it does not apply the new technology. Thus, we assume
 $q=1$
for simplicity. In Appendix G.1, we show the robustness of our results when this assumption is relaxed.
If insurer a decides to apply the technology, we denote this by
 $I_a=1$
, otherwise,
 $I_a=0$
. When the technology is applied, it lowers customers’ search costs to learn insurer a’s premium to zero and optimizes insurer a’s operation by lowering the costs
 $c_a$
to
 $tc_a$
(
 $t\in[0,1]$
), but it incurs an additional cost
 $\underline c\gt 0$
. In Appendix G.2, we discuss an alternative assumption regarding the additional cost by considering
 $t\geq 1$
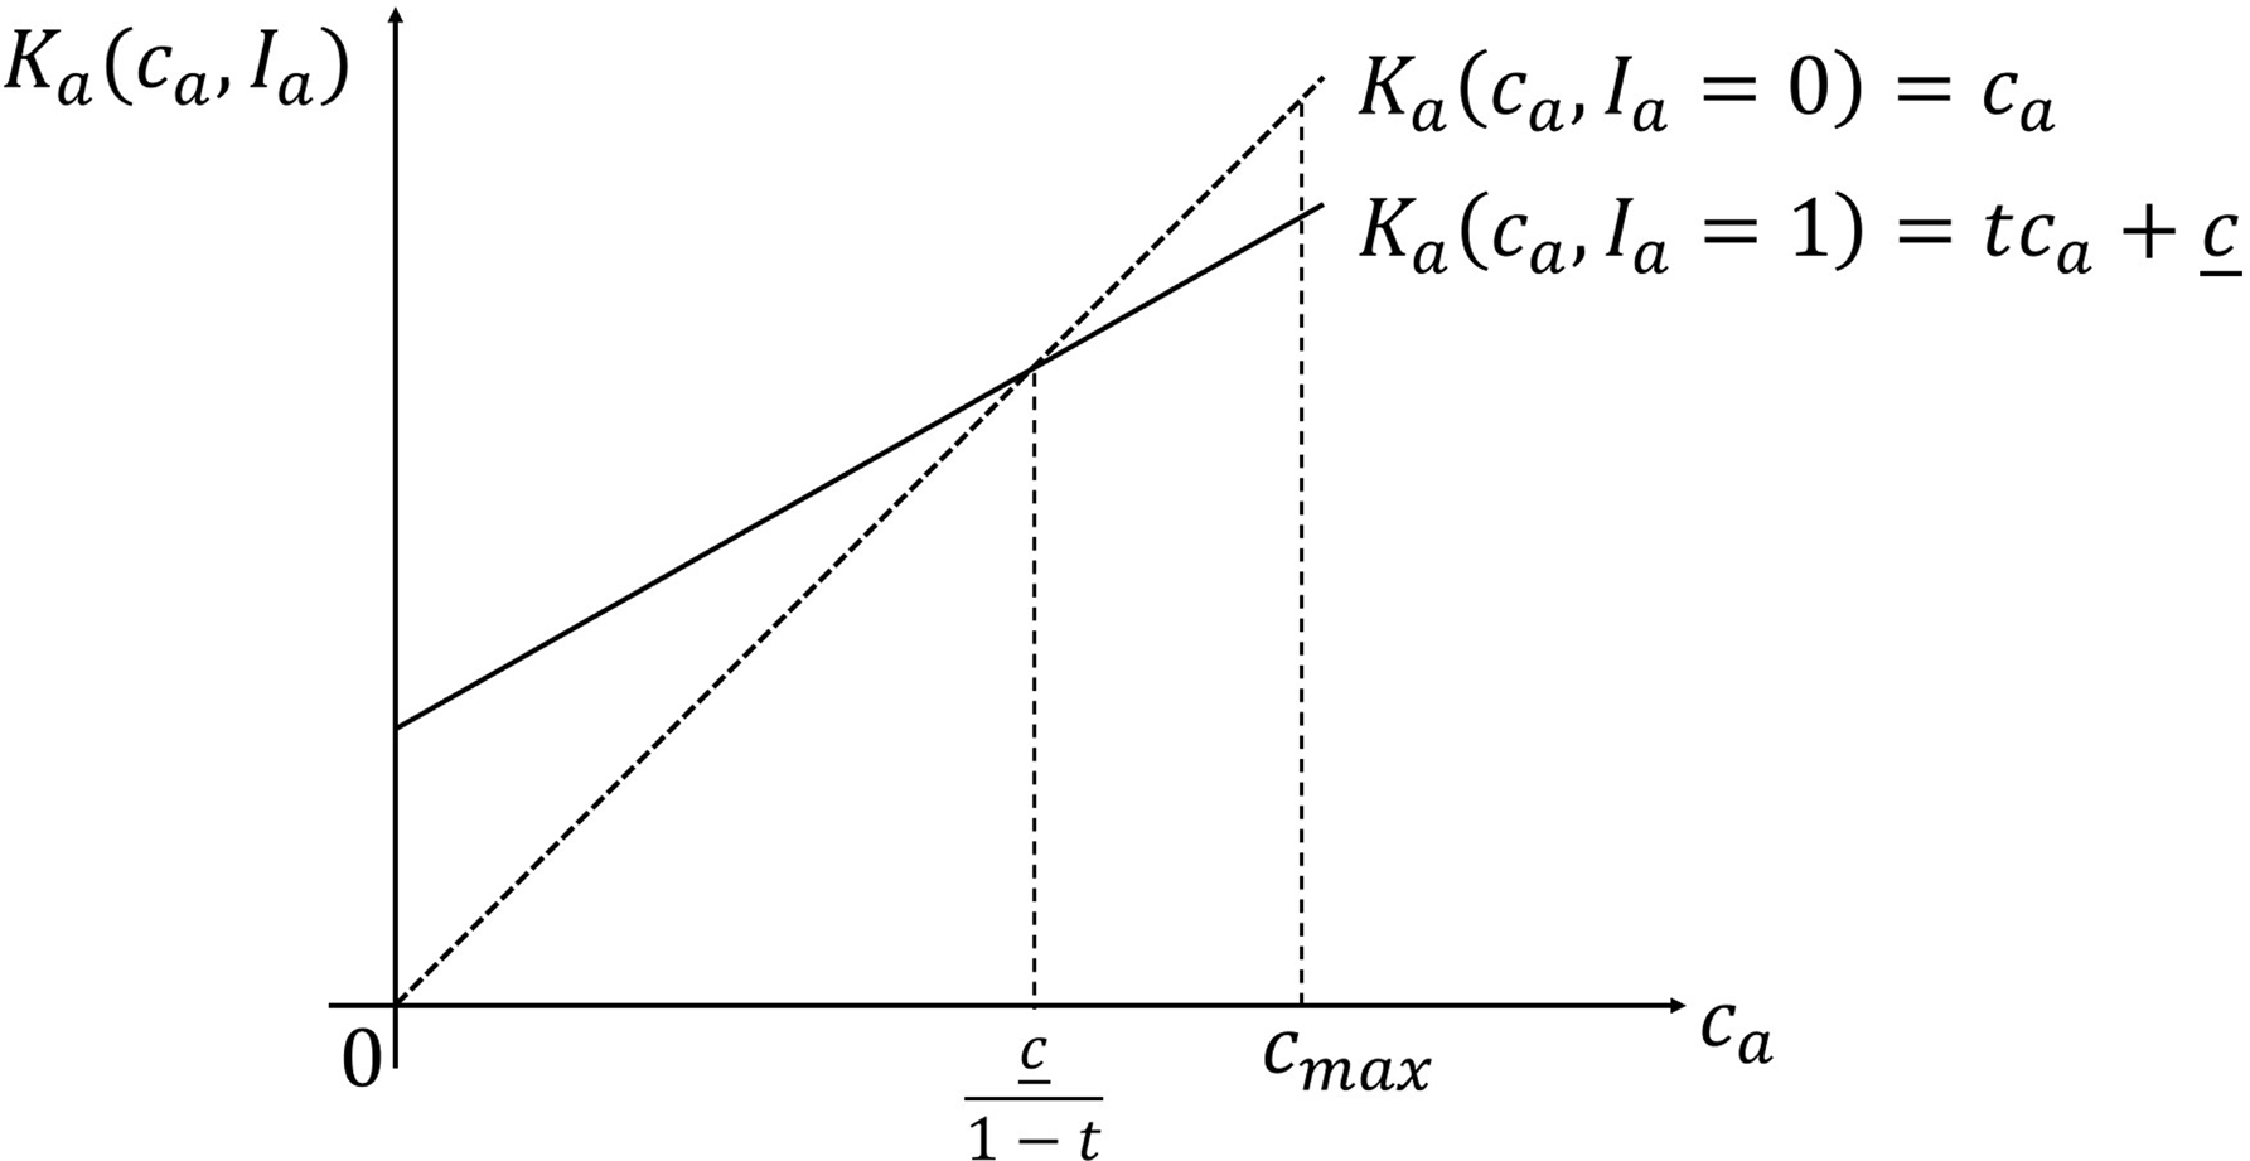
. Besides, in Appendix G.3, we discuss the case when the technology has no impact on customers’ search costs. As illustrated in Figure 2, insurer a’s per-contract cost is
 \begin{equation} K_a(c_a,I_a) = (1-I_a)c_a + I_a (tc_a+\underline c).\end{equation}
Per-contract cost of insurer a.

We assume that
 $tc_{max}+\underline{c}\leq c_{max}$
. As shown in Figure 2, applying the new technology lowers (raises) insurer a’s cost, that is,
 $tc_a+\underline{c} \lt c_a$
(
 $tc_a+\underline{c}\geq c_a$
), when
 $c_a$
is higher (lower) than
 $\frac{\underline c}{1-t}$
.
The two insurers and customers make decisions as follows. First, insurers a and b make their decisions simultaneously. Specifically, insurer a decides its premium
 $P_a$
and whether to apply the technology
 $I_a$
. Insurer b sets its premium
 $P_b$
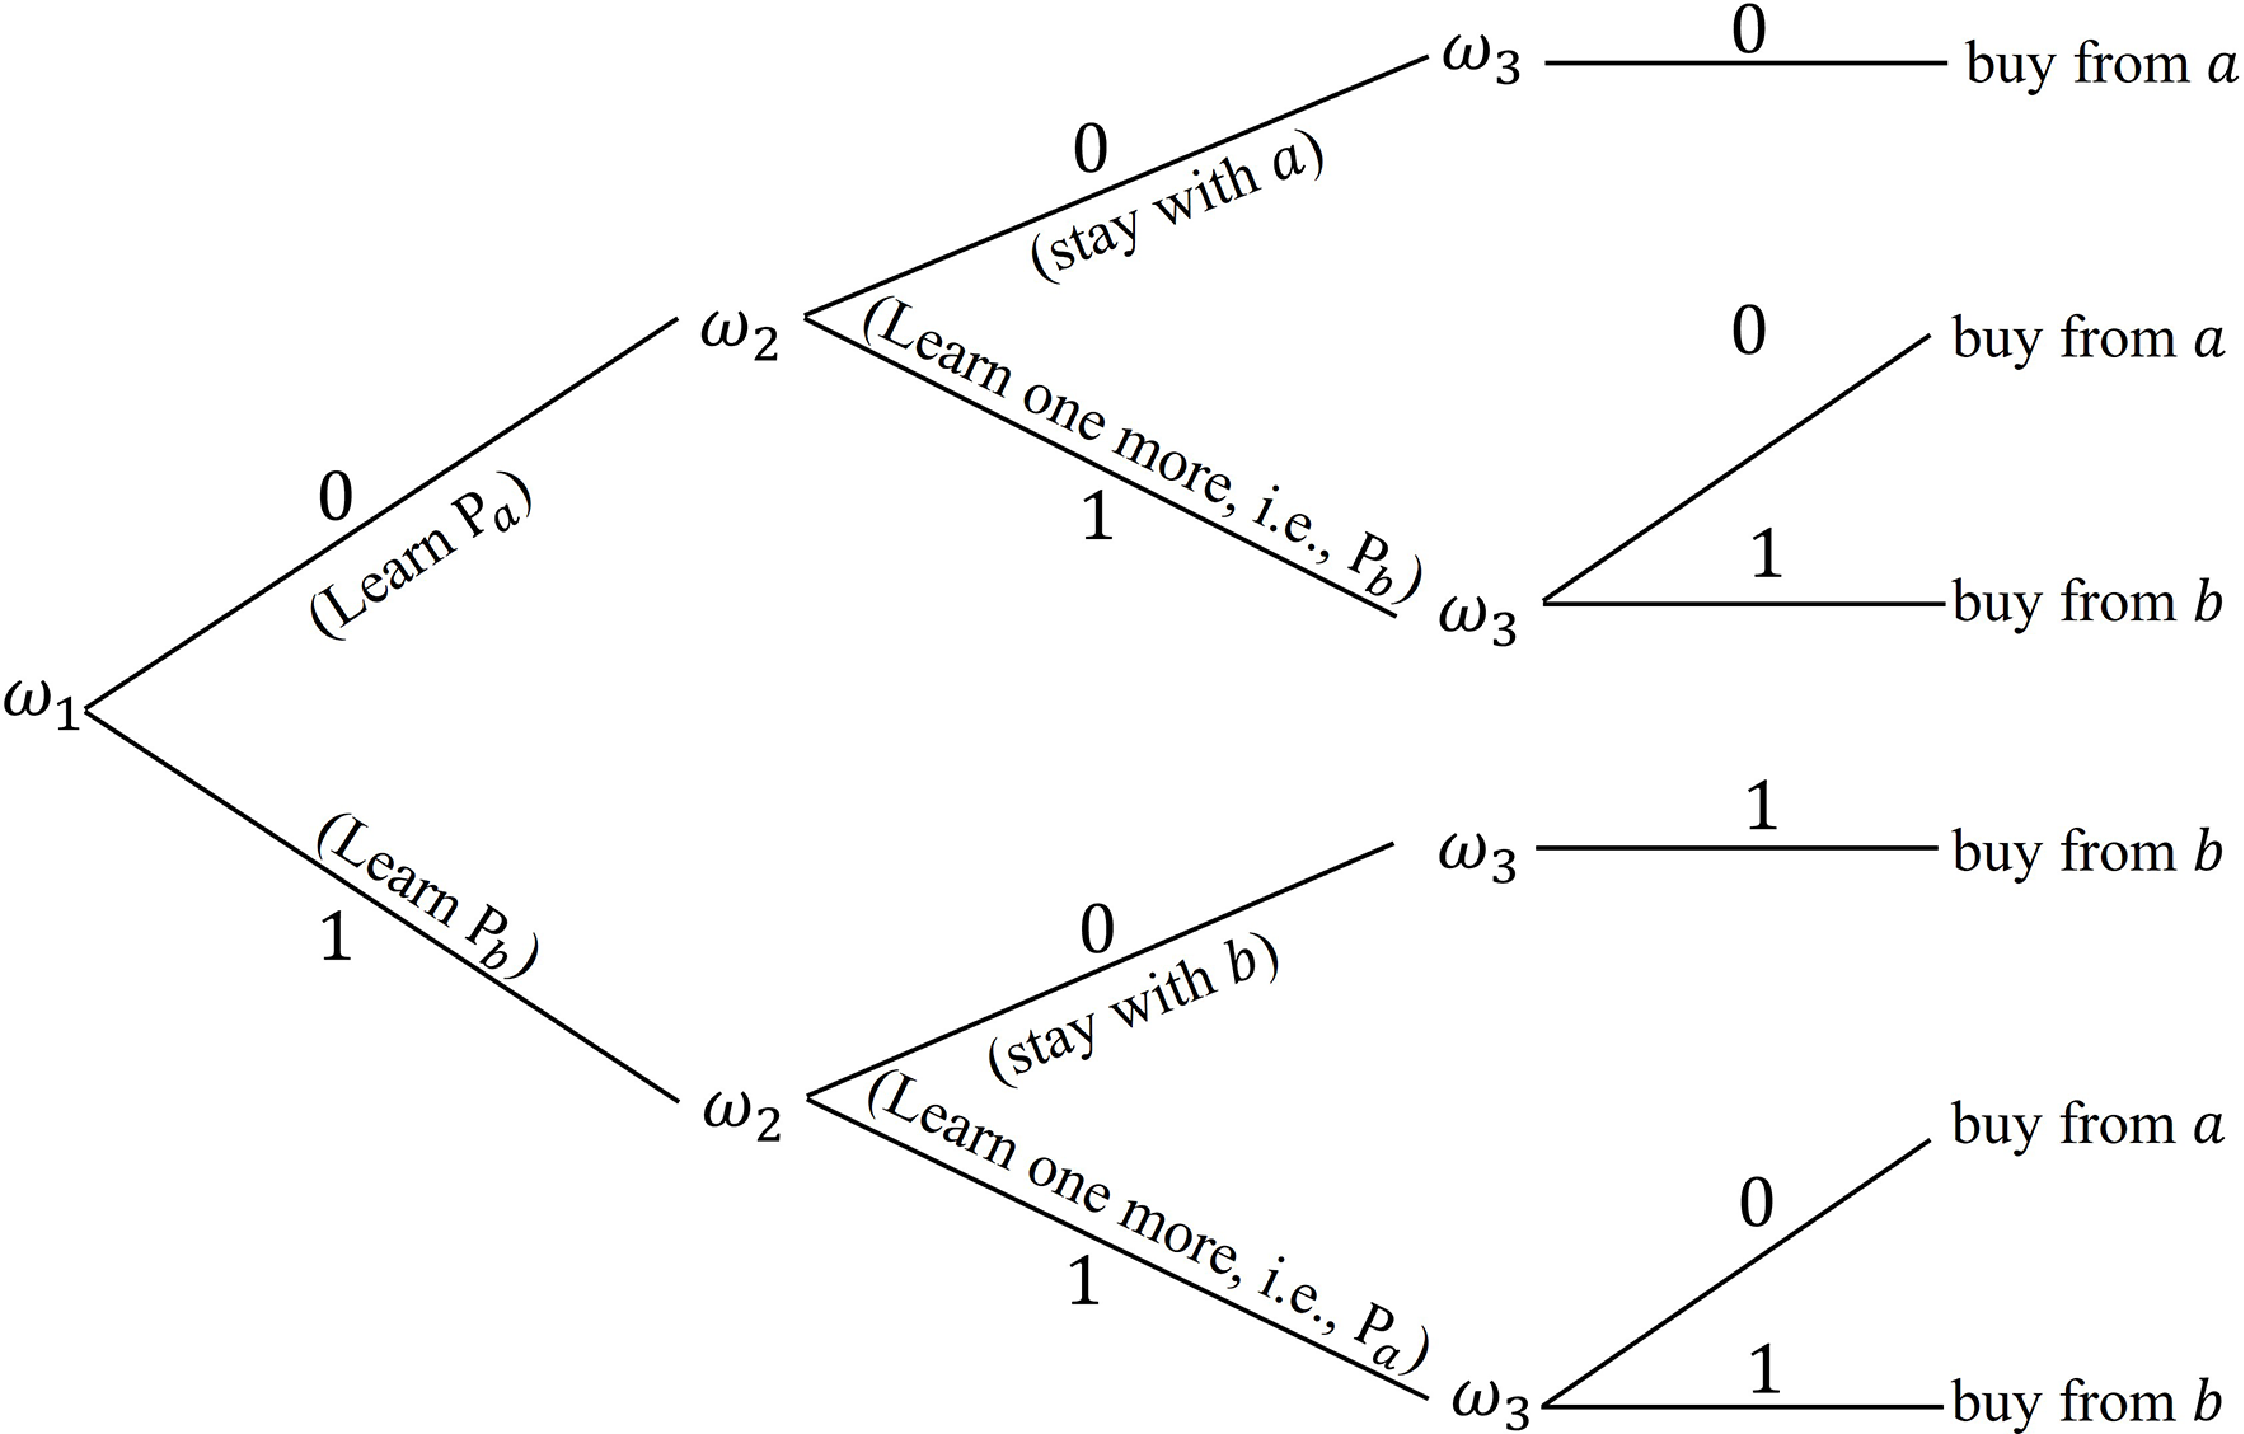
. Second, customers observe whether the new technology is applied by any insurer and make their searching and buying choices. We use notation
 $(\omega_1,\omega_2,\omega_3)$
to describe customers’ choices, as shown in Figure 3.
Customers’ decisions.

 $\omega_1\in\{0,1\}$
represents the customers’ first searching choice. If customers choose to learn about insurer a first,
 $\omega_1=0$
; if they choose insurer b,
 $\omega_1=1$
.
 $\omega_2\in\{0,1\}$
is customers’ second searching choice.This indicates whether to learn the premium of the other insurer after learning the premium of the first insurer. If they learn the premium of the other insurer,
 $\omega_2=1$
; otherwise,
 $\omega_2=0$
.
 $\omega_3\in\{0,1\}$
represents customers’ final buying choice. If they buy from insurer a,
 $\omega_3=0$
; otherwise,
 $\omega_3=1$
. We assume that when insurers a and b are indifferent to customers when they make any decisions, they will randomly choose one insurer.
We make several auxiliary assumptions that greatly reduce notational and expositional cumbersomeness, but which are not substantively important for our results. First, we assume that
 \begin{equation} u(W-\theta L - c_{max}) \gt \theta u(W-L)+(1-\theta) u(W),\end{equation}
which is reasonable since it is meaningless to consider insurers with prohibitively high costs to offer acceptable premiums for consumers. Second, we only consider customers who are willing to buy insurance (Eling et al., Reference Eling, Jia, Lin and Rothschild2022). Specifically, we assume that for the customer with the highest search cost
 $\Phi$
, it is still better to search at least once and buy insurance, that is,
 \begin{equation} \int_0^{c_{max}}u(W-\theta L- c)f(c)dc - \Phi \gt \theta u(W-L)+(1-\theta) u(W).\end{equation}
2.2 Equilibrium definition
We consider a perfectly competitive market equilibrium. In summary, an equilibrium consists of a set of decisions,
 $I_a,P_a,P_b,\omega_1,\omega_2,\omega_3$
, and customers’ beliefs about both insurers’ per-contact costs
 $B_a(c,I_a = 0)$
and
 $B_b(c)$
such that: (1) customers maximize their expected utilities; (2) their beliefs are consistent with the structure of the game and insurer behavior; and (3) insurers optimize their expected market shares. The assumption of perfect competition and constant marginal costs (i.e., the same expected losses among customers) implies a constant profit margin for insurers so that sales maximization and profit maximization are equivalent. Since the price is set at the zero-profit level, following Posey and Yavaş (Reference Posey and Yavaş1995), we consider that insurers aim for sales maximization. Based on these conditions, we show the equilibrium in detail as follows.
The zero expected profit condition implies that
 \begin{equation} P_a = \theta L + (1-I_a)c_a + I_a (tc_a+\underline{c}) \ \textrm{ and} \ P_b = \theta L + c_b.\end{equation}
Customers’ decisions and beliefs, as well as both insurers’ expected market shares, vary with insurer a’s technology adoption decision
 $I_a$
, and thus we analyze the situations when
 $I_a=0$
and
 $I_a=1$
separately. Generally, we assume that insurers’ expected market shares (or equivalently, customers’ demand for insurers’ insurance contracts) are a concave function of their costs (Klemperer and Meyer, Reference Klemperer and Meyer1989). This assumption implies certain technical requirements on the properties of the distribution F(c), which is presented in Appendix A. At a high level, this assumption allows f
′(c) to be either positive or negative but with a negative floor level.
Denote the technology adoption decision of insurer a as
 $I_a = \unicode{x1D7D9}_{A}(c_a)$
, where
 $A\subset [0,c_{max}]$
remains to solve. Since customers regard insurer b as an insurer who has access to the new technology but has not applied it, their belief about insurer b’s costs is
 \begin{equation} B_b(c) = \textrm{ Prob}\left(c_b\leq c \ | c_b\notin A\right).\end{equation}
Customers’ belief on insurer a’s costs when it does not apply the technology is
 \begin{equation} B_a(c, I_a=0) = \textrm{ Prob}\left(c_a\leq c \ | c_a\notin A\right).\end{equation}
Then we consider customers’ choices when
 $I_a=1$
and
 $I_a=0$
separately. When insurer a applies the new technology (i.e.,
 $I_a=1$
or equivalently,
 $c_a\in A$
), it costs nothing to learn insurer a’s premium. Therefore, all customers will choose insurer a as their first searching choice, that is,
 \begin{equation} \omega_1(I_a=1) = 0.\end{equation}
Based on the learned premium
 $P_a=\theta L + tc_a+\underline{c}$
, customers need to decide whether or not to learn the premium of insurer b to maximize their expected utilities
 $U(\phi,\omega_2,I_a=1)$
, which is
 \begin{equation} U(\phi,\omega_2,I_a=1) = \begin{cases} u(W-\theta L - tc_a-\underline{c}), & \textrm{ when} \ \omega_2 = 0, \\ \int_0^{c_{max}} u(W-\theta L - \min\{tc_a+\underline{c},c_b\})dB_b(c_b) - \phi, & \textrm{ when} \ \omega_2 = 1. \end{cases}\end{equation}
Note that the expected utility when
 $\omega_2=1$
is calculated based on customers’ updated belief,
 $B_b(c_b)$
, about insurer b’s cost, rather than the prior belief,
 $F(c_b)$
. It is straightforward to see that for customers with relatively low search costs, it is worth searching insurer b, while for customers with relatively high search costs, it is not, that is,
 \begin{equation} \omega_2(I_a=1) = \begin{cases} 0, & \textrm{ if} \ \phi \gt g(tc_a+\underline{c}), \\ 1, & \textrm{ if} \ \phi \lt g(tc_a+\underline{c}), \\ (0,1) \ \textrm{ with probability } \ \left(\frac{1}{2},\frac{1}{2}\right), & \textrm{ if} \ \phi = g(tc_a+\underline{c}), \\ \end{cases}\end{equation}
where
 $ g(c) = \int_0^{c_{max}}u\left(W-\theta L - \min\{c,c_b\}\right)dB_b(c_b) - u(W-\theta L - c)$
is the difference in expected utility, exclusive of search cost, between (i) learning insurer b’s premium and buying the cheaper one and (ii) not learning insurer b’s premium and buying from insurer a, whose cost is c.
Then we consider customers’ final buying decisions
 $\omega_3$
when insurer a applies the technology, that is,
 $I_a=1$
. First, customers who do not learn the premium of insurer b (i.e., those with
 $\omega_2(I_a=1) = 0$
) will buy insurance from insurer a at the premium
 $P_a = \theta L+tc_a +\underline{c}$
. Customers who learn the premium of insurer b (i.e., those with
 $\omega_2(I_a=1) = 1$
) will buy from the insurer who offers the lower premium. That is,
 \begin{equation} \omega_3(I_a=1) = \begin{cases} 0, & \textrm{ if}\ \omega_2(I_a=1) = 0 \ \textrm{ or} \ tc_a+\underline{c} \lt c_b, \\ 1, & \textrm{ if} \ \omega_2(I_a=1) = 1 \ \textrm{ and} \ tc_a+\underline{c} \gt c_b,\\ (0,1) \ \textrm{ with probability} \ (\frac{1}{2},\frac{1}{2}), & \textrm{ if} \ \omega_2(I_a=1) = 1 \ \textrm{ and} \ tc_a+\underline{c} = c_b. \end{cases} \end{equation}
Given customers’ choices, the insurer a’s expected market share when
 $I_a=1$
is
 \begin{equation} EM_a(I_a=1) = \int_0^{tc_a+\underline{c}} \left(1-\frac{g(tc_a+\underline{c})}{\Phi}\right)dF(c_b) + \int_{tc_a+\underline{c}}^{c_{max}} 1 dF(c_b).\end{equation}
The first term in Equation (2.12) is insurer a’s expected market share when insurer b’s cost
 $c_b$
is lower. In this case, only customers with search costs
 $\phi\geq g(tc_a+\underline{c})$
remain with insurer a. The second term is insurer a’s expected market share when insurer b’s cost
 $c_b$
is higher, in which case, all customers buy from insurer a.
When the insurer a chooses not to apply the technology (i.e.,
 $I_a=0$
or equivalently,
 $c_a\notin A$
), insurer a and b are indifferent to customers when they make their first searching choices,
 $\omega_1$
. Customers, therefore, randomly choose one of them to learn, that is,
 \begin{equation} \omega_1(I_a=0) = (0,1) \ \textrm{ with probability} \ \left(\frac{1}{2},\frac{1}{2}\right). \end{equation}
For those customers who choose insurer i (
 $i=a,b$
) first, they learn the premium
 $P_i$
and decide whether to learn the other insurer j (
 $j\neq i$
) to maximize their expected utilities, which is
 \begin{equation} U(\phi, \omega_2,I_a=0) \begin{cases} u(W-\theta L - c_i), & \textrm{ when} \ \omega_2 = 0, \\ \int_0^{c_{max}} u(W-\theta L - \min\{c_i,c_j\}) d B_j(c_j) - \phi, & \textrm{ when} \ \omega_2 = 1. \end{cases} \end{equation}
Note that the search costs incurred during the first searching are sunk costs and thus are not considered when making the second searching decision
 $\omega_2$
. Customers with relatively low search costs prefer to learn the insurer j’s premium, while customers with relatively high search costs do not, that is,
 \begin{equation} \omega_2(I_a=0) = \begin{cases} 0, & \textrm{ if} \ \phi \gt g(c_i), \\ 1, & \textrm{ if} \ \phi \lt g(c_i), \\ (0,1) \ \textrm{ with probability} \ \left(\frac{1}{2},\frac{1}{2}\right), & \textrm{ if} \ \phi = g(c_i). \\ \end{cases}\end{equation}
Customers who do not learn insurer j’s premium will buy from insurer i and customers who learn insurer j’s premium will buy from the insurer who offers the lower premium, that is,
 \begin{equation} \omega_3(I_a=0) = \begin{cases} \omega_1(I_a=0), & \textrm{ if} \ \omega_2(I_a=0) = 0, \\ 0, & \textrm{ if} \ \omega_2(I_a=0) = 1 \ \textrm{ and} \ c_a \lt c_b, \\ 1, & \textrm{ if} \ \omega_2(I_a=0) = 1 \ \textrm{ and} \ c_a \gt c_b, \\ (0,1) \ \textrm{ with probability} \ (\frac{1}{2},\frac{1}{2}), & \textrm{ if} \ \omega_2(I_a=0) = 1 \ \textrm{ and} \ c_a = c_b. \end{cases}\end{equation}
Given customers’ choice as above, insurer a’s the expected market share when
 $I_a=0$
is
 \begin{equation} EM_a(I_a=0) = \int_0^{c_a} \frac{1}{2}\left(1-\frac{g(c_a)}{\Phi}\right) dF(c_b)+\int_{c_a}^{c_{max}} \frac{1}{2}\left(1+\frac{g(c_b)}{\Phi}\right) dF(c_b).\end{equation}
As shown in the first term of Equation (2.17), when insurer b’s cost is lower, among the half of customers who pick insurer a as their first searching choice, insurer a only maintains those with search costs
 $\phi\geq g(c_a)$
. When insurer b’s cost is higher, as shown in the second term of Equation (2.17), insurer a maintains half of customers who pick it as their first searching choice and also attracts those who search insurer b first and whose search costs are lower than
 $g(c_b)$
.
Definition 1: An equilibrium is a set of decisions of insurers and customers, (
 $I_a^{*},P_a^{*},P_b^{*},\omega_1^{*},\omega_2^{*},\omega_3^{*}$
), as well as customers’ beliefs, (
 $B_a^{*}(c,I_a=0)$
,
 $B_b^{*}(c)$
), such that
-
•
 $I_a^* = \textrm{ argmax}_{I_a\in\{0,1\}} \ EM_a(I_a)$
, where
$EM_a(I_a)$
is given by Equations (2.12) and (2.17) (Expected market share maximization by insurer a);
-
•
$P_a^* = \theta L + (1-I_a^*)c_a + I_a^* (tc_a+\underline c)$
(Zero expected profit of insurer a); -
•
$P_b^* = \theta L + c_b$
(Zero expected profit of insurer b); -
•
$\omega_k^{*} = \omega_k(I_a^*)$
(
$k=1,2,3$
), where
$\omega_1(I_a)$
is given by Equations (2.8) and (2.13),
$\omega_2(I_a)$
is given by Equations (2.10) and (2.15), and
$\omega_3(I_a)$
is given by Equations (2.11) and (2.16) (Expected utility maximization by customers); -
•
$B_a^*(c,I_a=0)$
and
$B_b^*(c)$
are given by Equations (2.6) and (2.7) (Consistent beliefs of customers).


3. Equilibrium
In this section, following the equilibrium definition, we analyze the optimal technology adoption decision of insurer a and the market shares of both insurers in equilibrium. Besides, to analyze the impact of insurers’ technology accessibility as private information on the market equilibrium, we consider two benchmark cases – no-technology case and observable-accessibility case – for comparison and present the corresponding equilibria.
3.1 Equilibrium of the main model
Proposition 1. In equilibrium, there exists cutoffs,
 $c^*_1 \lt c^*_2 \lt \frac{\underline c}{1-t}$
, such that
 \begin{equation} I_a^* = \unicode{x1D7D9}_{[0,c_1^*)\bigcup (c_2^*, c_{max}]}(c_a).\end{equation}
Proof: See Appendix A .
When insurer a’s original cost
 $c_a$
is relatively high (i.e.,
 $c_a \gt c_2^*$
), applying the new technology lowers (or just slightly raises) its cost, and thus allows it to offer a lower or comparable premium. Moreover, the new technology thus makes insurer a the first searching choice for all customers by eliminating their costs to search insurer a. When insurer a’s original cost
 $c_a$
is relatively low (i.e.,
 $c_a \lt c_1^*$
), applying the new technology raises its cost; however, insurer a is still very likely to maintain its cost advantage. Thus, it is worthwhile for insurer a to apply the new technology and become the first searching choice for all customers. When insurer a has a medium cost (i.e.,
 $c_1^*\leq c_a\leq c_2^*$
), it is no longer worth applying the technology to become customers’ first searching choice because a high premium resulting from the high cost would lead a considerable number of customers to switch to insurer b after learning the premium of insurer a.
Given the equilibrium set of decisions of all players,
 $(I_a^{*},P_a^{*},P_b^{*},\omega_1^{*},\omega_2^{*},\omega_3^{*})$
, both insurers’ market shares in equilibrium, denoted by
 $M_a^*$
and
 $M_b^*$
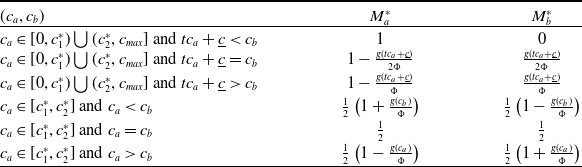
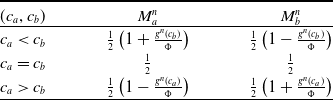
, are summarized in Table 1. Specifically, when
 $c_a\in [0,c_1^*)\bigcup (c_2^*, c_{max}]$
, insurer a applies the technology and becomes the first searching choice for all customers. When
 $tc_a+\underline{c} \lt c_b$
, no matter whether a customer performs a second searching or not, she buys from insurer a finally, that is,
 $M_a^* = 1$
and
 $M_b^*=0$
. When
 $tc_a+\underline{c}=c_b$
,
 $1-\frac{g(tc_a+\underline{c})}{\Phi}$
fraction of customers stop searching and buy from insurer a, while
 $\frac{g(tc_a+\underline{c})}{\Phi}$
fraction of customers perform a second searching, find that both insurers offer the same premium, and thus make a random final buying choice, that is,
 $M_a^* = 1- \frac{g(tc_a+\underline{c})}{2\Phi}$
and
 $M_b^* = \frac{g(tc_a+\underline{c})}{2\Phi}$
. When
 $tc_a+\underline{c} \gt c_b$
, the
 $\frac{g(tc_a+\underline{c})}{\Phi}$
fraction of customers, who perform a second searching, will find a lower premium from insurer b and accept it, that is,
 $M_a^* = 1- \frac{g(tc_a+\underline{c})}{\Phi}$
and
 $M_b^* = \frac{g(tc_a+\underline{c})}{\Phi}$
. When
 $c_a\in[c_1^*,c_2^*]$
, insurer a does not apply the new technology and customers make random first searching. When
 $c_a \lt c_b$
,
 $\frac{g(c_b)}{2\Phi}$
fraction of customers first search insurer b, perform a second searching, and buy from insurer a, that is,
 $M_a^* = \frac{1}{2}\left(1+\frac{g(c_b)}{\Phi}\right)$
and
 $M_b^* = \frac{1}{2}\left(1-\frac{g(c_b)}{\Phi}\right)$
. Symmetric results hold when
 $c_a \gt c_b$
. When
 $c_a=c_b$
, random final buying choices are made, and thus
 $M_a^*=\frac{1}{2}$
and
 $M_b^* = \frac{1}{2}$
.
Insurers’ market share in the equilibrium of the main model.

Proposition 2. There exists two equilibria, denoted as Equilibrium
 $\alpha$
and Equilibrium
 $\beta$
, with subscript
 $\alpha$
and
 $\beta$
indicating the cutoffs in these two equilibria, respectively. Then, in Equilibrium
 $\alpha$
,
 \begin{equation} c_{1\alpha}^{*} = 0 \ \textrm{ and} \ c_{2\alpha}^{*}\in\left(0,\frac{\underline c}{1-t}\right), \end{equation}
and in Equilibrium
 $\beta$
,
 \begin{equation} c_{1\beta}^{*} \gt 0 \ \textrm{ and} \ c_{2\beta}^{*}\in(0,c_{2\alpha}^{*}).\end{equation}
Proof: See Appendix B.
Note that in an equilibrium, insurer a’s technology adoption decision is consistent with customers’ belief on insurers’ costs, given technology adoption results are observed. The existence of two different equilibria implies that customers’ different beliefs on insurers’ costs lead to different optimal technology adoption decision of insurer a. Specifically, if insurers that do not apply new technology are expected to have relatively low costs (i.e.,
 $c\leq c_{2\alpha}^*$
), it is then optimal for insurer a to apply the technology when
 $c_a \gt c_{2\alpha}^*$
, which we refer to as Equilibrium
 $\alpha$
. The cost of insurer b is believed to be lower than
 $c_{2\alpha}^*$
since it does not apply the new technology. Therefore, compared to customers’ original belief on insurer b’s costs (i.e., lower than
 $c_{max}$
), the unobservable technology accessibility leads customers to underestimate the cost of insurer b.
If insurers that do not apply the new technology are expected to have medium costs (i.e.,
 $c_{1\beta}^*\leq c\leq c_{2\beta}^*$
), it is optimal for insurer a to apply the technology when
 $c_a \lt c_{1\beta}^*$
or
 $c_a \gt c_{2\beta}^*$
, which we refer to as Equilibrium
 $\beta$
. The cost of insurer b is believed to be higher than
 $c_{1\beta}^*$
and lower than
 $c_{2\beta}^*$
. Therefore, compared to customers’ original belief on insurer b’s cost (i.e., lower than
 $c_{max}$
), insurer b’s cost is not necessarily underestimated in Equilibrium
 $\beta$
. Moreover, the result
 $0=c_{1\alpha}^* \lt c_{1\beta}^* \lt c_{2\beta}^* \lt c_{2\alpha}^*$
implies that the insurer a is more likely to apply the technology in Equilibrium
 $\beta$
when customers expect an insurer without applying the technology to have medium costs.
3.2 Equilibrium of the no-technology case
In the equilibrium of the no-technology case, since both insurers have no access to the new technology, customers always expect insurer i’s cost following the distribution F(c). As a result, the two insurers are indifferent to customers when making the first searching choice, therefore, customers randomly choose between them, that is,
 \begin{equation} \omega_1^n = (0,1) \ \textrm{ with probability} \ \left(\frac{1}{2},\frac{1}{2}\right).\end{equation}
Based on the learned premium
 $P_i^n$
, customers with relatively low search costs will then learn the premium of the other insurer and buy the cheaper one, while customers with relatively high search costs will stop searching and buy from insurer i directly, that is,
 \begin{equation} \omega_2^n = \begin{cases} 0, & \textrm{ if} \ \phi \gt g^n(c_i), \\ 1, & \textrm{ if} \ \phi \lt g^n(c_i), \\ (0,1) \ \textrm{ with probability} \ \left(\frac{1}{2},\frac{1}{2}\right), & \textrm{ if} \ \phi = g^n(c_i), \\ \end{cases}\end{equation}
and
 \begin{equation} \omega_3^n = \begin{cases} \omega_1^n, & \textrm{ if} \ \omega_2^n = 0, \\ 0, & \textrm{ if} \ \omega_2^n = 1 \ \textrm{ and} \ c_a \lt c_b, \\ 1, & \textrm{ if} \ \omega_2^n = 1 \ \textrm{ and} \ c_a \geq c_b,\\ (0,1) \ \textrm{ with probability} \ \left(\frac{1}{2},\frac{1}{2}\right), & \textrm{ if} \ \omega_2^n = 1 \ \textrm{ and} \ c_a = c_b, \end{cases}\end{equation}
where
 $g^n(c) = \int_0^{c_{max}}u\left(W-\theta L - \min\{c,c_b\}\right)dF(c_b) - u(W-\theta L - c)$
.
Based on the insurers’ pricing as well as customers’ searching and buying choices described above, the two insurers’ market shares in the equilibrium are summarized in Table 2. Specifically, when
 $c_a=c_b$
, insurer a and b offer the same premium, and thus those who make a second searching choice will make a random final buying choice. Thus, both insurers earn half of the whole market share, that is,
 $M_a^n=M_b^n = \frac{1}{2}$
. When
 $c_a \lt c_b$
,
 $\frac{g^n(c_b)}{2\Phi}$
fraction of customers who learn the premium of insurer b first and make a second searching, will finally switch to insurer a. As a result,
 $M_a^n = \frac{1}{2}\left(1+\frac{g^n(c_b)}{\Phi}\right)$
and
 $M_b^n = \frac{1}{2}\left(1-\frac{g^n(c_b)}{\Phi}\right)$
. We have symmetric results when
 $c_a \gt c_b$
.
Insurers’ market share in the equilibrium of no-technology case.

3.3 Equilibrium of the observable-accessibility case
In the equilibrium of the observable-accessibility case, insurer a applies the new technology only when the technology lowers its cost in total, that is, when
 $tc_a+\underline{c} \lt c_a$
. In other words,
 \begin{equation} I_a^o = \unicode{x1D7D9}_{(c_2^o,c_{max}]}(c_a), \ \textrm{ where} \ c_2^o =\frac{\underline{c}}{1-t}.\end{equation}
Therefore, if insurer a does not apply the new technology, customers know that its cost
 $c_a$
is lower than
 $\frac{\underline{c}}{1-t}$
, that is, their belief on insurer a’s cost is
 $B_a^o(c, I_a = 0) = \frac{F(c)}{F(\frac{\underline{c}}{1-t})}, \ \textrm{ for} \ \forall c\leq \frac{\underline{c}}{1-t}$
. Insurer b’s cost is expected to follow the distribution F(c) when it is unlearned, that is,
 $B^o_b(c) = F(c)$
.
 $B_a^o(c, I_a = 0)$
and
 $B^o_b(c)$
imply that insurer a is always the first searching choice for all customers regardless of whether it applies the new technology. Therefore, we have
 $\omega^o_1 = 1$
. After learning the insurer a’s premium
 $P_a^o = \theta L + \min\{tc_a+\underline{c}, c_a\}$
, customers with relatively low search costs will then learn the premium of insurer b and buy the cheaper one, while customers with relatively high search costs will stop searching and buy from insurer a directly, that is,
 \begin{equation} \omega_2^o = \begin{cases} 0, & \textrm{ if} \ \phi \gt g^n(\min\{tc_a+\underline{c}, c_a\}), \\ 1, & \textrm{ if} \ \phi \lt g^n(\min\{tc_a+\underline{c}, c_a\}), \\ (0,1) \ \textrm{ with probability} \ \left(\frac{1}{2},\frac{1}{2}\right), & \textrm{ if} \ \phi = g^n(\min\{tc_a+\underline{c}, c_a\}), \end{cases}\end{equation}
and
 \begin{equation} \omega_3^o = \begin{cases} 0, & \textrm{ if} \ \omega_2^o = 0 \ \textrm{ or} \ \min\{tc_a+\underline{c}, c_a\} \lt c_b, \\ 1, & \textrm{ if} \ \omega_2^o = 1 \ \textrm{ and} \ \min\{tc_a+\underline{c}, c_a\} \gt c_b, \\ (0,1) \ \textrm{ with probability} \ \left(\frac{1}{2},\frac{1}{2}\right), & \textrm{ if} \ \omega_2^o = 1 \ \textrm{ and} \ \min\{tc_a+\underline{c}, c_a\} = c_b. \end{cases}\end{equation}
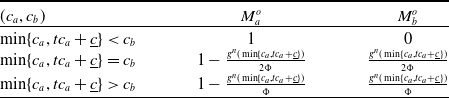
Based on the insurers’ pricing as well as customers’ searching and buying choices described above, the two insurers’ market shares in the equilibrium are shown in Table 3.
Insurers’ market share in the equilibrium of observable-accessibility case.

When
 $\min \{c_a,tc_a+\underline{c}\} \lt c_b$
, insurer a offers a lower premium than that of insurer b. Therefore, all customers will buy from insurer a, that is,
 $M_a^o=1$
and
 $M_b^o=0$
. When
 $\min\{c_a,tc_a+\underline{c}\}=c_b$
,
 $\frac{g^n\left(\min\{c_a,tc_a+\underline{c}\}\right)}{\Phi}$
fraction of customers who perform a second searching will find that insurer a and b offer the same premium and thus make random final buying choices. As a result, we have
 $M_a^o = 1- \frac{g^n\left(\min\{c_a,tc_a+\underline{c}\}\right)}{2\Phi}$
and
 $M_b^o=\frac{g^n\left(\min\{c_a,tc_a+\underline{c}\}\right)}{2\Phi}$
. When
 $\min\{c_a,tc_a+\underline{c}\}\gt c_b$
, those who perform a second searching will find a lower premium offered by insurer b and thus buy from it. As a result, we have
 $M_a^o = 1- \frac{g^n\left(\min\{c_a,tc_a+\underline{c}\}\right)}{\Phi}$
and
 $M_b^o=\frac{g^n\left(\min\{c_a,tc_a+\underline{c}\}\right)}{\Phi}$
.
4. Equilibrium comparison
In this section, we compare the equilibria in the main model with the no-technology case and the observable-accessibility case.
Proposition 3. (Technology Adoption) In equilibrium, we have
 $\textrm{ Prob}(I_a^* = 1) \gt \textrm{ Prob}(I_a^o = 1) \gt 0$
, which results from
 $0\leq c_1^*\leq c_2^* \lt c_2^o$
.
Proof: See Appendix D.
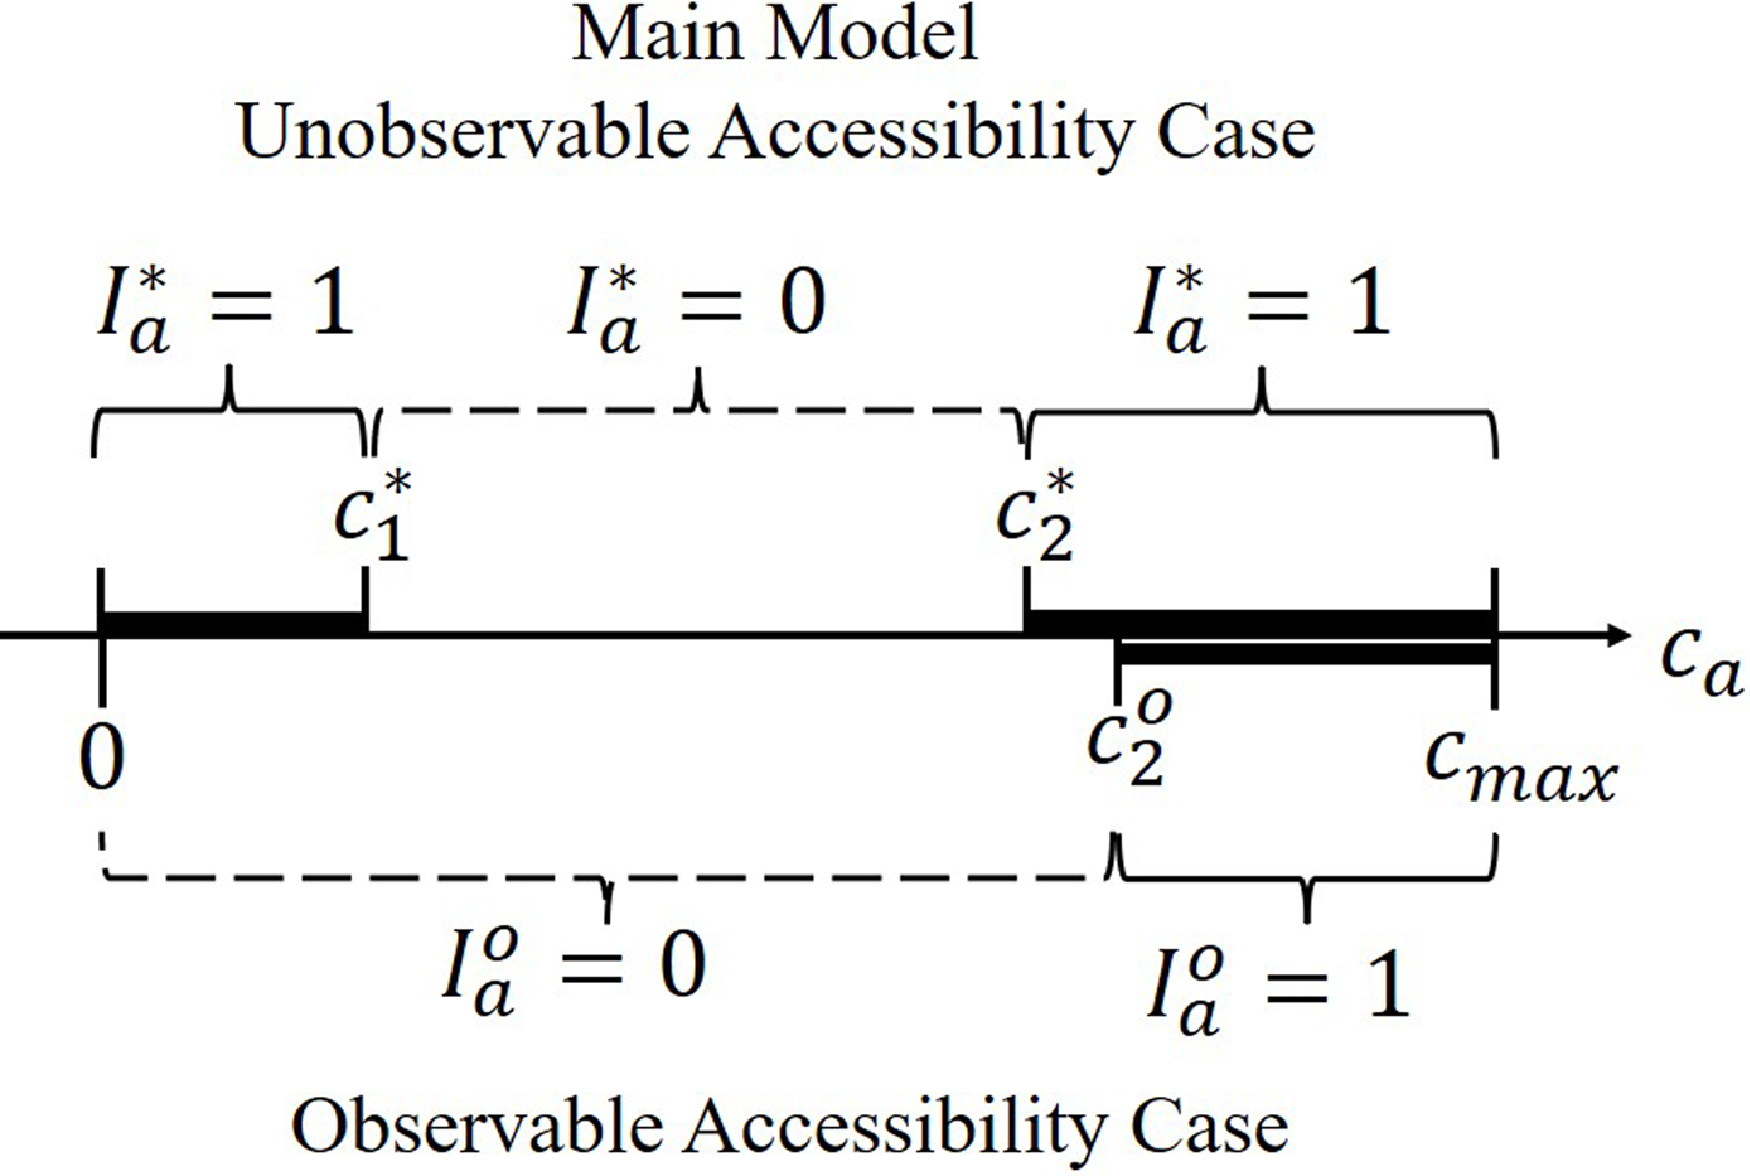
Proposition 3 implies that (i) the technology accessibility divide between the two insurers leads to a technology usage divide with a positive probability, which is intuitive and (ii) the insurer a is more likely to apply the technology when the technology accessibility is unobservable. When insurers’ technology accessibility is observable, as we have shown in Section 3.3, insurer a’s decision to not adopt the technology acts as a positive and clear signal to customers that insurer a is more likely to offer a lower premium than insurer b. As a result, insurer a is always the first searching choice for all customers and then the final buying choice for high-search-cost customers, regardless of whether it applies the new technology. Thus, it applies the technology only when the technology lowers its cost in total, that is,
 $c_a \gt c_2^o = \frac{\underline{c}}{1-t}$
, as shown in Figure 4.
Technology adoption decision of insurer a.

However, when customers cannot observe insurers’ technology accessibility, insurer a cannot send such a positive signal by technology rejection. A tradeoff arises when insurer a with
 $c_a \leq c_2^o$
makes the technology adoption decision: applying the technology leads it to be customers’ first searching choice but increases its cost and premium. It is worth applying the technology (i) when insurer a has a low original cost (
 $c_a \lt c_1^*$
), in which case its cost advantage over insurer b is likely to remain and (ii) when insurer a has a high original cost (
 $c_2^* \lt c_a\leq c_2^o$
), in which case applying the technology slightly increases its cost. Therefore, with unobservable technology accessibility, insurer a is more likely to apply the technology, as shown in Figure 4.
Proposition 4. (Winner takes all) In equilibrium with
 $0\leq c_1^* \lt c_2^* \lt c_{max}$
, we have
-
1.
$\textrm{ Prob}(M_a^o = 1|c_a \lt c_b) \gt \textrm{ Prob}(M_a^* = 1|c_a \lt c_b) \gt \textrm{ Prob}(M_a^n = 1|c_a \lt c_b) = 0$
; -
2.
$\textrm{ Prob}(M_a^* = 1|c_a \geq c_b)\geq \textrm{ Prob}(M_a^o = 1|c_a \geq c_b) \gt \textrm{ Prob}(M_a^n = 1|c_a \geq c_b) = 0$
.


Proof: See Appendix D.
Proposition 4 implies that the unobservable technology accessibility makes it more likely for the insurer a to crowd out a competitor with lower cost (i.e.,
 $c_a \geq c_b$
), but makes it less likely if the competitor has a higher cost than insurer a (i.e.,
 $c_a \lt c_b$
). The intuition is as follows: in the no-technology case, no insurer is crowded out of the market (i.e.,
 $\textrm{ Prob}(M_a^n = 1|c_a \lt c_b)=\textrm{ Prob}(M_a^n = 1|c_a \geq c_b) = 0$
), because all customers make a random first searching choice and high-search-cost customers will stay with their first searching choice without second searching.
Becoming the first searching choice for all customers is the necessary condition for insurer a to take over the whole market, which always holds in the observable-accessibility case. When
 $c_a \lt c_b$
, in the observable-accessibility case, insurer a always offers a lower premium than insurer b and thus is the final buying choice for all customers (i.e.,
 $\textrm{ Prob}(M_a^o = 1|c_a \lt c_b)=1$
). Similar thing happens in the main model only when insurer a applies the technology and does offer a lower premium (i.e.,
 $c_a^*\in[0,c_1^*)\cup(c_2^*,c_{max}]$
and
 $tc_a+\underline{c} \lt c_b$
). When insurer a does not apply the technology (i.e.,
 $c_a\in[c_1^*,c_2^*]$
) in the main model, all customers make a random first searching choice and thus insurer a cannot crowd insurer b out of the market (i.e.,
 $0 \lt \textrm{ Prob}(M_a^* = 1|c_a \lt c_b) \lt \textrm{ Prob}(M_a^o = 1|c_a \lt c_b)$
).
When
 $c_a\geq c_b$
, in the observable-accessibility case, insurer a takes over the whole market only when its premium is lower than that of insurer b after it applies the technology (i.e., when
 $c_a\gt \frac{\underline{c}}{1-t}$
and
 $tc_a+\underline{c} \lt c_b$
). Similar thing happens in the main model when
 $c_a\gt \frac{\underline{c}}{1-t}$
and
 $tc_a+\underline{c} \lt c_b$
. In the main model, moreover, the insurer b is also crowded out of the market when
 $c_a\lt \frac{c^*_1-\underline{c}}{t}$
, in which case the cost of insurer a after applying the new technology (i.e.,
 $tc_a+\underline{c}$
), is lower than the minimum cost that customers expect insurer b to have, that is,
 $c_1^*$
. As a result, no customer will perform a second searching. Although the insurer b may offer a lower premium than insurer a, it will leave the market without being searched by any customers. Thus,
 $\textrm{ Prob}(M_a^* = 1|c_a\geq c_b)\geq \textrm{ Prob}(M_a^o = 1|c_a\geq c_b)\gt \textrm{ Prob}(M_a^n = 1|c_a\geq c_b) = 0$
.
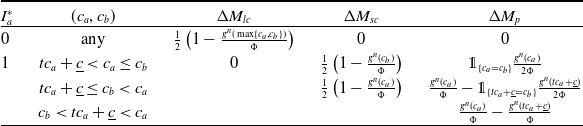
In the observable-accessibility case, insurer a always earns a market share higher than that in the no-technology case, which can be decomposed as follows:
 \begin{equation} M_a^o - M_a^n = \begin{cases} \Delta M_{lc}, & if \ c_a \leq c_2^o,\\ \Delta M_{sc} + \Delta M_p, & if \ c_a \gt c_2^o,\\ \end{cases} \end{equation}
where
 $\Delta M_{lc}$
,
 $\Delta M_{sc} $
,
 $\Delta M_p\geq 0$
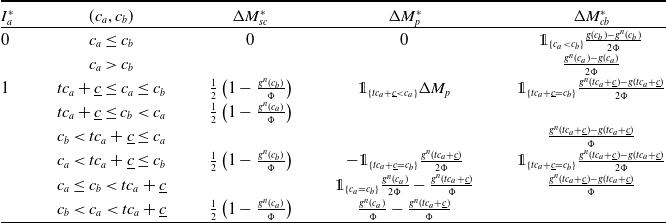
, and their expression are summarized in Table 4.
The expression of
 $\Delta M_{lc}$
,
 $\Delta M_{sc}$
, and
 $\Delta M_p$
can be straightforwardly derived following the expression of
 $M_a^o$
and
 $M_a^n$
in Tables 2 and 3. The intuition is as follows. In the observable-accessibility case, insurer a eliminate customers’ search costs when it applies the technology, which is called search-cost effect (i.e.,
 $\Delta M_{sc}$
) or hints that its cost is lower than
 $\frac{\underline c}{1-t}$
when it does not apply, which is called low-cost signal effect (i.e.,
 $\Delta M_{lc}$
). Since both the low-cost signal effect and the search-cost effect increase the market share of insurer a by making it the first searching choice for all customers,
 $\Delta M_{lc}$
and
 $\Delta M_{sc}$
share the same expression. Besides, in the observable-accessibility case, when
 $c\gt c_2^o$
, insurer a applies the technology, which lowers its costs and premiums, and thus increases its market share, which is called premium effect (i.e.,
 $\Delta M_p$
). Note that the low-cost signal effect does not coexist with the search-cost effect or the premium effect. Intuitively, customers are better off in the observable-accessibility case, since they can save search costs due to the low-cost signal effects and search-cost effect and/or pay lower premium due to the premium effect.
The difference in the market share of insurer a between the main model and the no-technology case can also be decomposed as follows:
 \begin{equation} M_a^* - M_a^n = \begin{cases} \Delta M^*_{sc} + \Delta M^*_p + \Delta M_{cb}^*, & if \ c_a\lt c_1^* \ or \ c_a\gt c_2^*,\\ \Delta M_{cb}^*, & if \ c_1^* \leq c_a \leq c_2^*, \end{cases} \end{equation}
where the expressions of
 $M^*_{sc}$
,
 $\Delta M^*_p $
, are
 $\Delta M_{cb}^*$
are summarized in Table 5.
Three effects in the equilibrium of observable-accessibility case.

Three effects in the equilibrium of main model.

The expression of
 $\Delta M_{sc}^*$
,
 $\Delta M_p^*$
, and
 $\Delta M_{cb}^*$
can be straightforwardly derived following the expression of
 $M_a^*$
and
 $M_a^n$
in Tables 1 and 2. Some comments and intuition are as follows. In the main model, when insurer a applies the technology, it becomes the first searching choice for all customers by eliminating the customers’ search costs. As a result,
 $\Delta M^*_{sc} = \Delta M_{sc}$
. When the technology is applied, the cost of insurer a is changed from
 $c_a$
to
 $tc_a+\underline c$
, which will affect its premium and, consequently, its market share.
 $\Delta M_{cb}^*$
stands for the customer-belief effect. In the observable-accessibility case, the cost of insurer b is expected to follow the distribution F(c) over the interval
 $[0,c_{max}]$
before being searched. However, in the main model, it is expected to follow the posterior distribution
 $B_b(c) = \frac{F(c) - F(c_1^*)}{F(c_2^*)-F(c_1^*)}$
over the interval
 $[c_1^*,c_2^*]$
. Moreover, insurer a’s cost is always expected to follow the distribution
 $B_a(c,I_a=0) = B_b(c)$
when it does not apply the technology. For comparison, in the observable-accessibility case, insurer a is always the first searching choice for all customers.
It is intuitive that the search-cost effect is positive when insurer a applies the technology. The following propositions analyze the premium effect and the customer-belief effect.
Proposition 5. (Premium Effect) In equilibrium with
 $0 \leq c_1^* \lt c_2^* \lt c_{max}$
, when
 $I_a^*=1$
, we have
 \begin{equation} \Delta M_p^* \begin{cases} \geq 0, & \ if \ c_a \geq c_2^o, \\ \leq 0, & \ if \ c_a \lt c_1^* \ or \ c_2^* \lt c_a \lt c_2^o. \end{cases}\end{equation}
Proof: See Appendix E.
Proposition 5 is as expected: When the technology lowers the cost of insurer a in total, it lowers its premium and increases its market share (i.e.,
 $\Delta M_p^* \geq 0$
if
 $ c_a \geq c_2^o$
). As we have shown in Proposition 1, when technology accessibility is unobservable, insurer a still applies the technology that raises its cost when
 $c_a \lt c_1^*$
or
 $ c_2^*\lt c_a\lt c_2^o$
. In this instance, the premium effect is non-positive. The premium effect is negative when insurer a has a higher cost (i.e.,
 $ \max\{c_a,tc_a+\underline c\}\gt c_b$
) and does not play a role when the cost of insurer a has a lower cost (i.e.,
 $ \max\{c_a,tc_a+\underline c\}=c_b$
).
Proposition 6. (Customer-Belief Effect in Equilibrium
 $\alpha$
) In Equilibrium
 $\alpha$
with
 $0 = c_{1\alpha}^* \lt c_{2\alpha}^* \lt c_{max}$
, when
 $I_a^* = 1$
,
 \begin{equation} \Delta M_{cb}^* \begin{cases} = 0, & \textrm{ if } \ tc_a+\underline c \lt c_b, \\ \lt 0, & \textrm{ if } \ tc_a+\underline c \geq c_b. \end{cases} \end{equation}
When
 $I_a^* = 0$
,
 \begin{equation} \Delta M_{cb}^* \begin{cases} \gt 0, & \textrm{ if } \ c_a \lt c_b, \\ = 0, & \textrm{ if } \ c_a = c_b, \\ \lt 0, & \textrm{ if } \ c_a \gt c_b. \end{cases} \end{equation}
Proof: See Appendix F.
In Equilibrium
 $\alpha$
, when insurer a applies the technology, it faces a negative customer-belief effect when its cost is not lower than the cost of insurer b. The intuition is as follows. When insurer a applies the technology, it becomes the first searching choice for all customers. The share of customers who perform second searching matters only when insurer b offers a lower premium (i.e.,
 $tc_a+\underline c\geq c_b$
). Otherwise, insurer a takes over the whole market no matter how many customers perform a second searching. When making the second searching decision, customers expect the cost of insurer b to follow the posterior distribution
 $B_b(c) = \frac{F(c)}{F(c_{2\alpha}^*)}$
in the interval
 $[0,c_{2\alpha}^*]$
, which is first-order stochastic dominated by that in the no-technology case (i.e., F(c) in the interval
 $[0,c_{max}]$
). Thus, compared to the no-technology case, more customers perform second searching and buy from insurer b when insurer b offers a lower premium (i.e., when
 $tc_a +\underline c \geq c_b$
).
When insurer a does not apply the technology, it faces a negative (resp. positive) customer-belief effect when its cost is higher (resp. lower) than the cost of insurer b. The intuition is as follows. When insurer a does not apply the technology, customers make random first searching. Following the same idea that the posterior distribution
 $B_b(c) = \frac{F(c)}{F(c_{2\alpha}^*)}$
over the interval
 $[0,c_{2\alpha}^*]$
is first-order stochastic dominated by that in the no-technology case, more customers perform second searching in the main model. When
 $c_a\lt c_b$
, among those who perform a second searching, only the number of customers who search insurer b first matters for insurers’ market share since these customers will switch to buy from insurer a. Thus, insurer a faces positive customer-belief effect when
 $I_a^* = 0$
and
 $c_a\lt c_b$
. When
 $c_a\gt c_b$
, symmetric results can be found.
Proposition 7. (Customer-Belief Effect in Equilibrium
 $\beta$
)
In Equilibrium
 $\beta$
with
 $0 \lt c_{1\beta}^* \lt c_{2\beta}^* \lt c_{max}$
, there exists a constant
 $\hat c\in[0,c_{max}]$
such that when
 $I_a^* = 1$
and
 $tc_a+\underline c\geq c_b$
,
 \begin{equation} \Delta M_{cb}^* \begin{cases} \geq 0, & \ if \ tc_a +\underline c \leq \hat c, \\ \lt 0, & \ if \ tc_a +\underline c \gt \hat c. \\ \end{cases} \end{equation}
When
 $I_a^* = 0$
and
 $c_a\neq c_b$
,
 \begin{align} \Delta M_{cb}^* \begin{cases} \geq 0, & \ if \ (c_b \geq \hat c \ and \ c_b \gt c_a) \ or \ (c_a \leq \hat c \ and \ c_b \lt c_a), \\ \lt 0, & \ if \ (c_b \lt \hat c \ and \ c_b \gt c_a) \ or \ (c_a \gt \hat c \ and \ c_b \lt c_a).\end{cases}\end{align}
Proof: See Appendix F.
Proposition 7 establishes that in Equilibrium
 $\beta$
, the customer-belief effect is positive if either insurer a’s cost (i.e.,
 $tc_a+\underline c$
if it applies the technology and
 $c_a$
if it does not) is lower than a certain threshold
 $\hat c$
when it is competing with a more cost-efficient insurer or if its competitor is less cost-efficient with cost higher than the threshold
 $\hat c$
. Otherwise, the customer-belief effect is negative. The intuition for the result is as follows.
When insurer a applies the technology, it becomes the first searching choice for all customers and the share of customers who perform second searching matters only when insurer b offers a lower premium (i.e.,
 $tc_a+\underline c\geq c_b$
). When the cost of insurer a is sufficiently low, although its cost is raised from
 $c_a$
to
 $tc_a+\underline c$
,
 $tc_a+\underline c$
may be still lower than
 $c_1^*$
or thereabouts. Due to the unobservable technology accessibility, insurer b’s cost is expected to range from
 $c_1^*$
to
 $c_2^*$
, which is very likely to be higher than that of insurer a. Therefore, few customers will perform a second searching after figuring out that the cost of insurer a is very low. In this case, the customer-belief effect is positive. As the cost of insurer a increases, the customer-belief effect diminishes. When the cost of insurer a is so high that, for example, when
 $tc_a+\underline c \gt c_2^*$
, most customers will perform a second searching since they expect that insurer b definitely offers a lower premium.
When insurer a does not apply the technology, customers make a random first searching choice. When
 $c_a\geq c_b$
, only
 $c_a$
matters for the market share of both insurers since it determines the share of customers who choose insurers a as their first searching choice and perform second searching. Similar results are found here: The customer-belief effect decreases in
 $c_a$
, changing from positive to negative as
 $c_a$
increases. Symmetric results are found when
 $c_b\gt c_a$
, in which case only the cost of insurer b matters for the market share of both insurers.
5. Simulation results
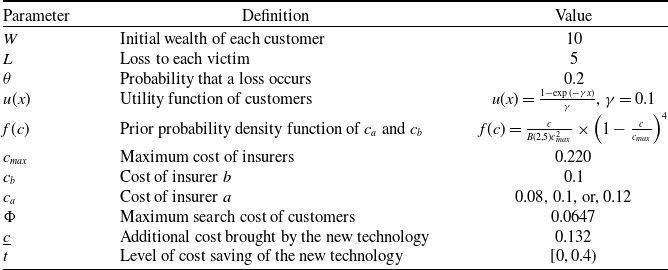
In this section, we illustrate the three effects – search-cost effect, premium effect, and customer-belief effect – and their joint impact on the market share of insurer a with some numerical examples. We also show that the premium effect and customer-belief effect can also be negative for customers’ welfare, which is defined as the sum of all customer’s expected utilities. The model parameters are provided in Table 6, and an explanation for the values of the parameters is discussed as follows.
Calibrated parameters.

Each customer is endowed with initial wealth
 $W=10$
and has a probability
 $\theta = 0.2$
of incurring a loss
 $L=5$
, so that the expected loss is normalized at
 $\theta L =1$
. We consider constant absolute risk aversion (CARA) utility function
 $u(x) = \frac{1-\exp(-\gamma x)}{\gamma}$
with a risk aversion level
 $\gamma = 0.1$
(Haubrich, 1994; Cohen and Einav, 2007). We adopt the Beta distribution for the prior probability density function of outsiders’ expectations regarding
 $c_a$
and
 $c_b$
. The maximum cost
 $c_{max}$
that insurers may have is calculated from the equation:
 $u(W-\theta L - c_{max}) = \theta u(W-L)+(1-\theta) u(W)$
. In other words, for customers, purchasing from an insurer whose cost is
 $c_{max}$
is equivalent to bearing the risk themselves, regardless of their search costs. We consider the cost of insurer b to be
 $c_b = 0.1$
, and select three costs for insurer a, specifically
 $c_a = 0.08$
,
 $0.1$
, or
 $0.12$
, which are lower than, equal to, and higher than
 $c_b$
, respectively. The maximum search cost
 $\Phi$
of customers is calculated from
 $u(W-\theta L - c_{max}) =\int_0^{c_{max}}u(W-\theta L -c)f(c)dc - \Phi$
. This means that for the customer
 $\Phi$
, it is indifferent between staying with an insurer whose cost is learned to be
 $c_{max}$
and searching the other insurer. For the new technology, we consider
 $\underline c = 0.6c_{max}$
. Note that we assume that
 $tc_{max}+\underline c \lt c_{max}$
. Thus, given
 $\underline c = 0.6c_{max}$
, we have
 $t\in[0,0.4)$
.
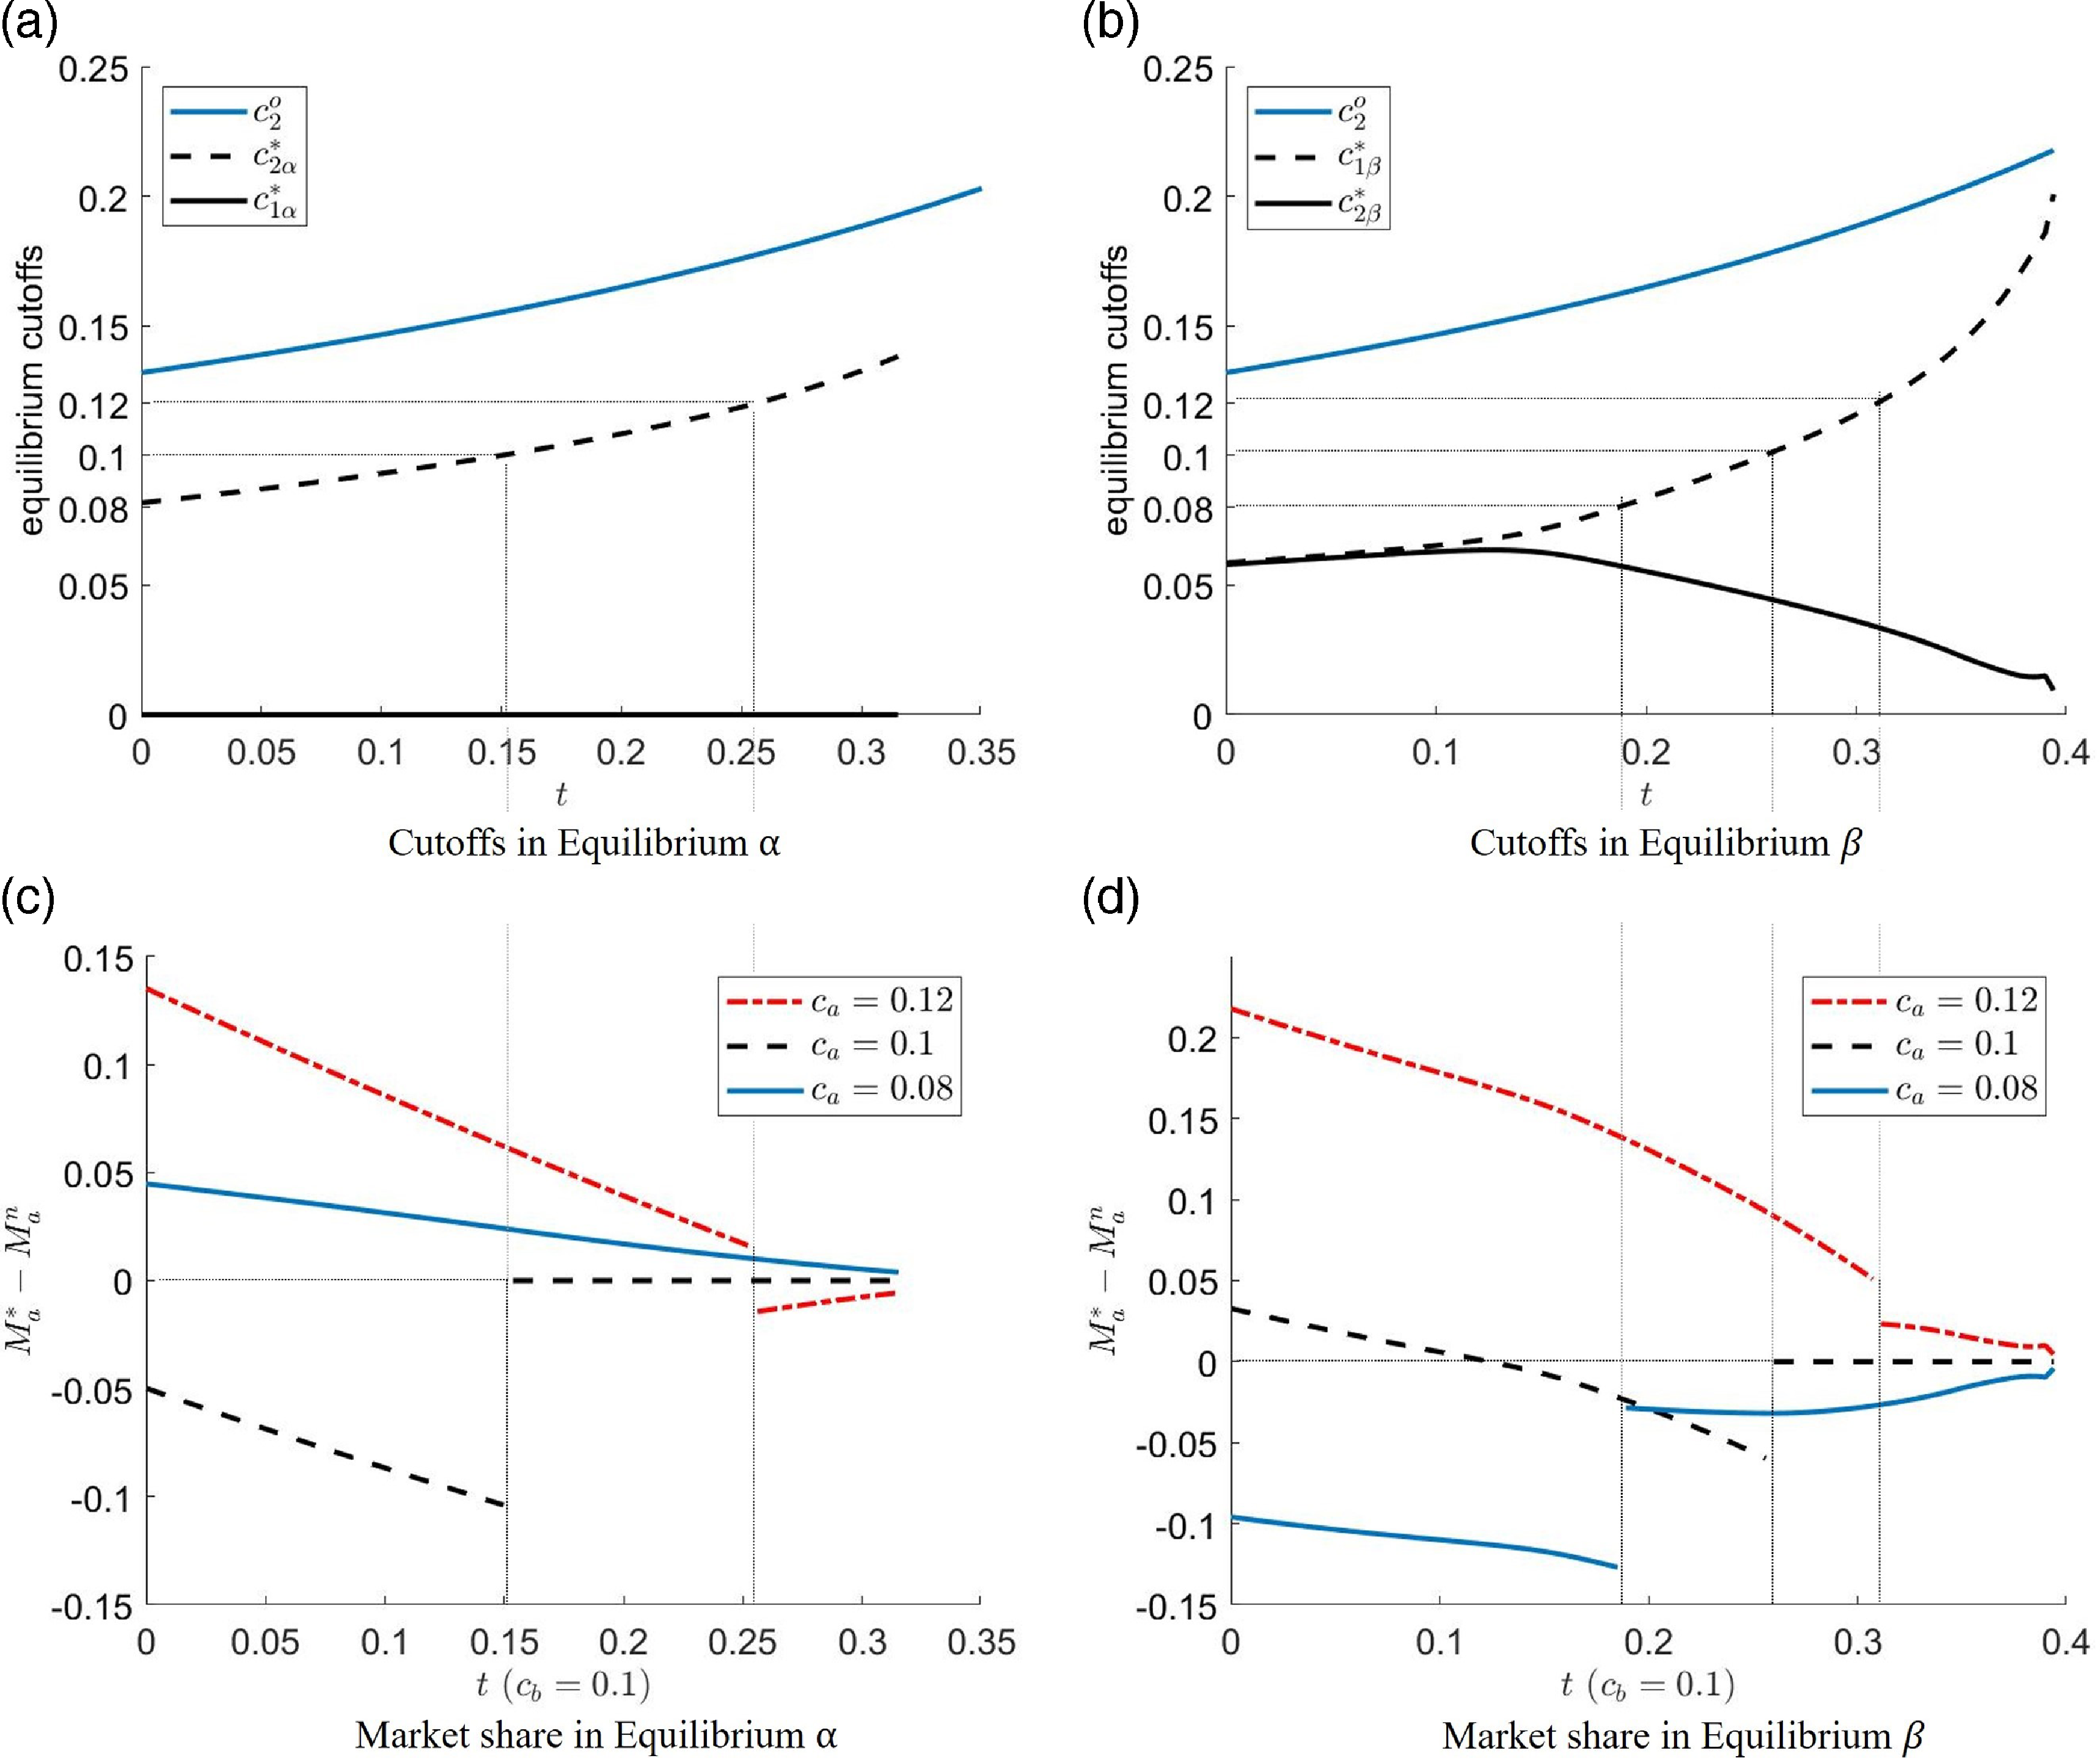
The two figures in Figure 5 on the left (resp. right) show the cutoffs and joint effect on the market share of insurer a in Equilibrium
 $\alpha$
(resp.
 $\beta$
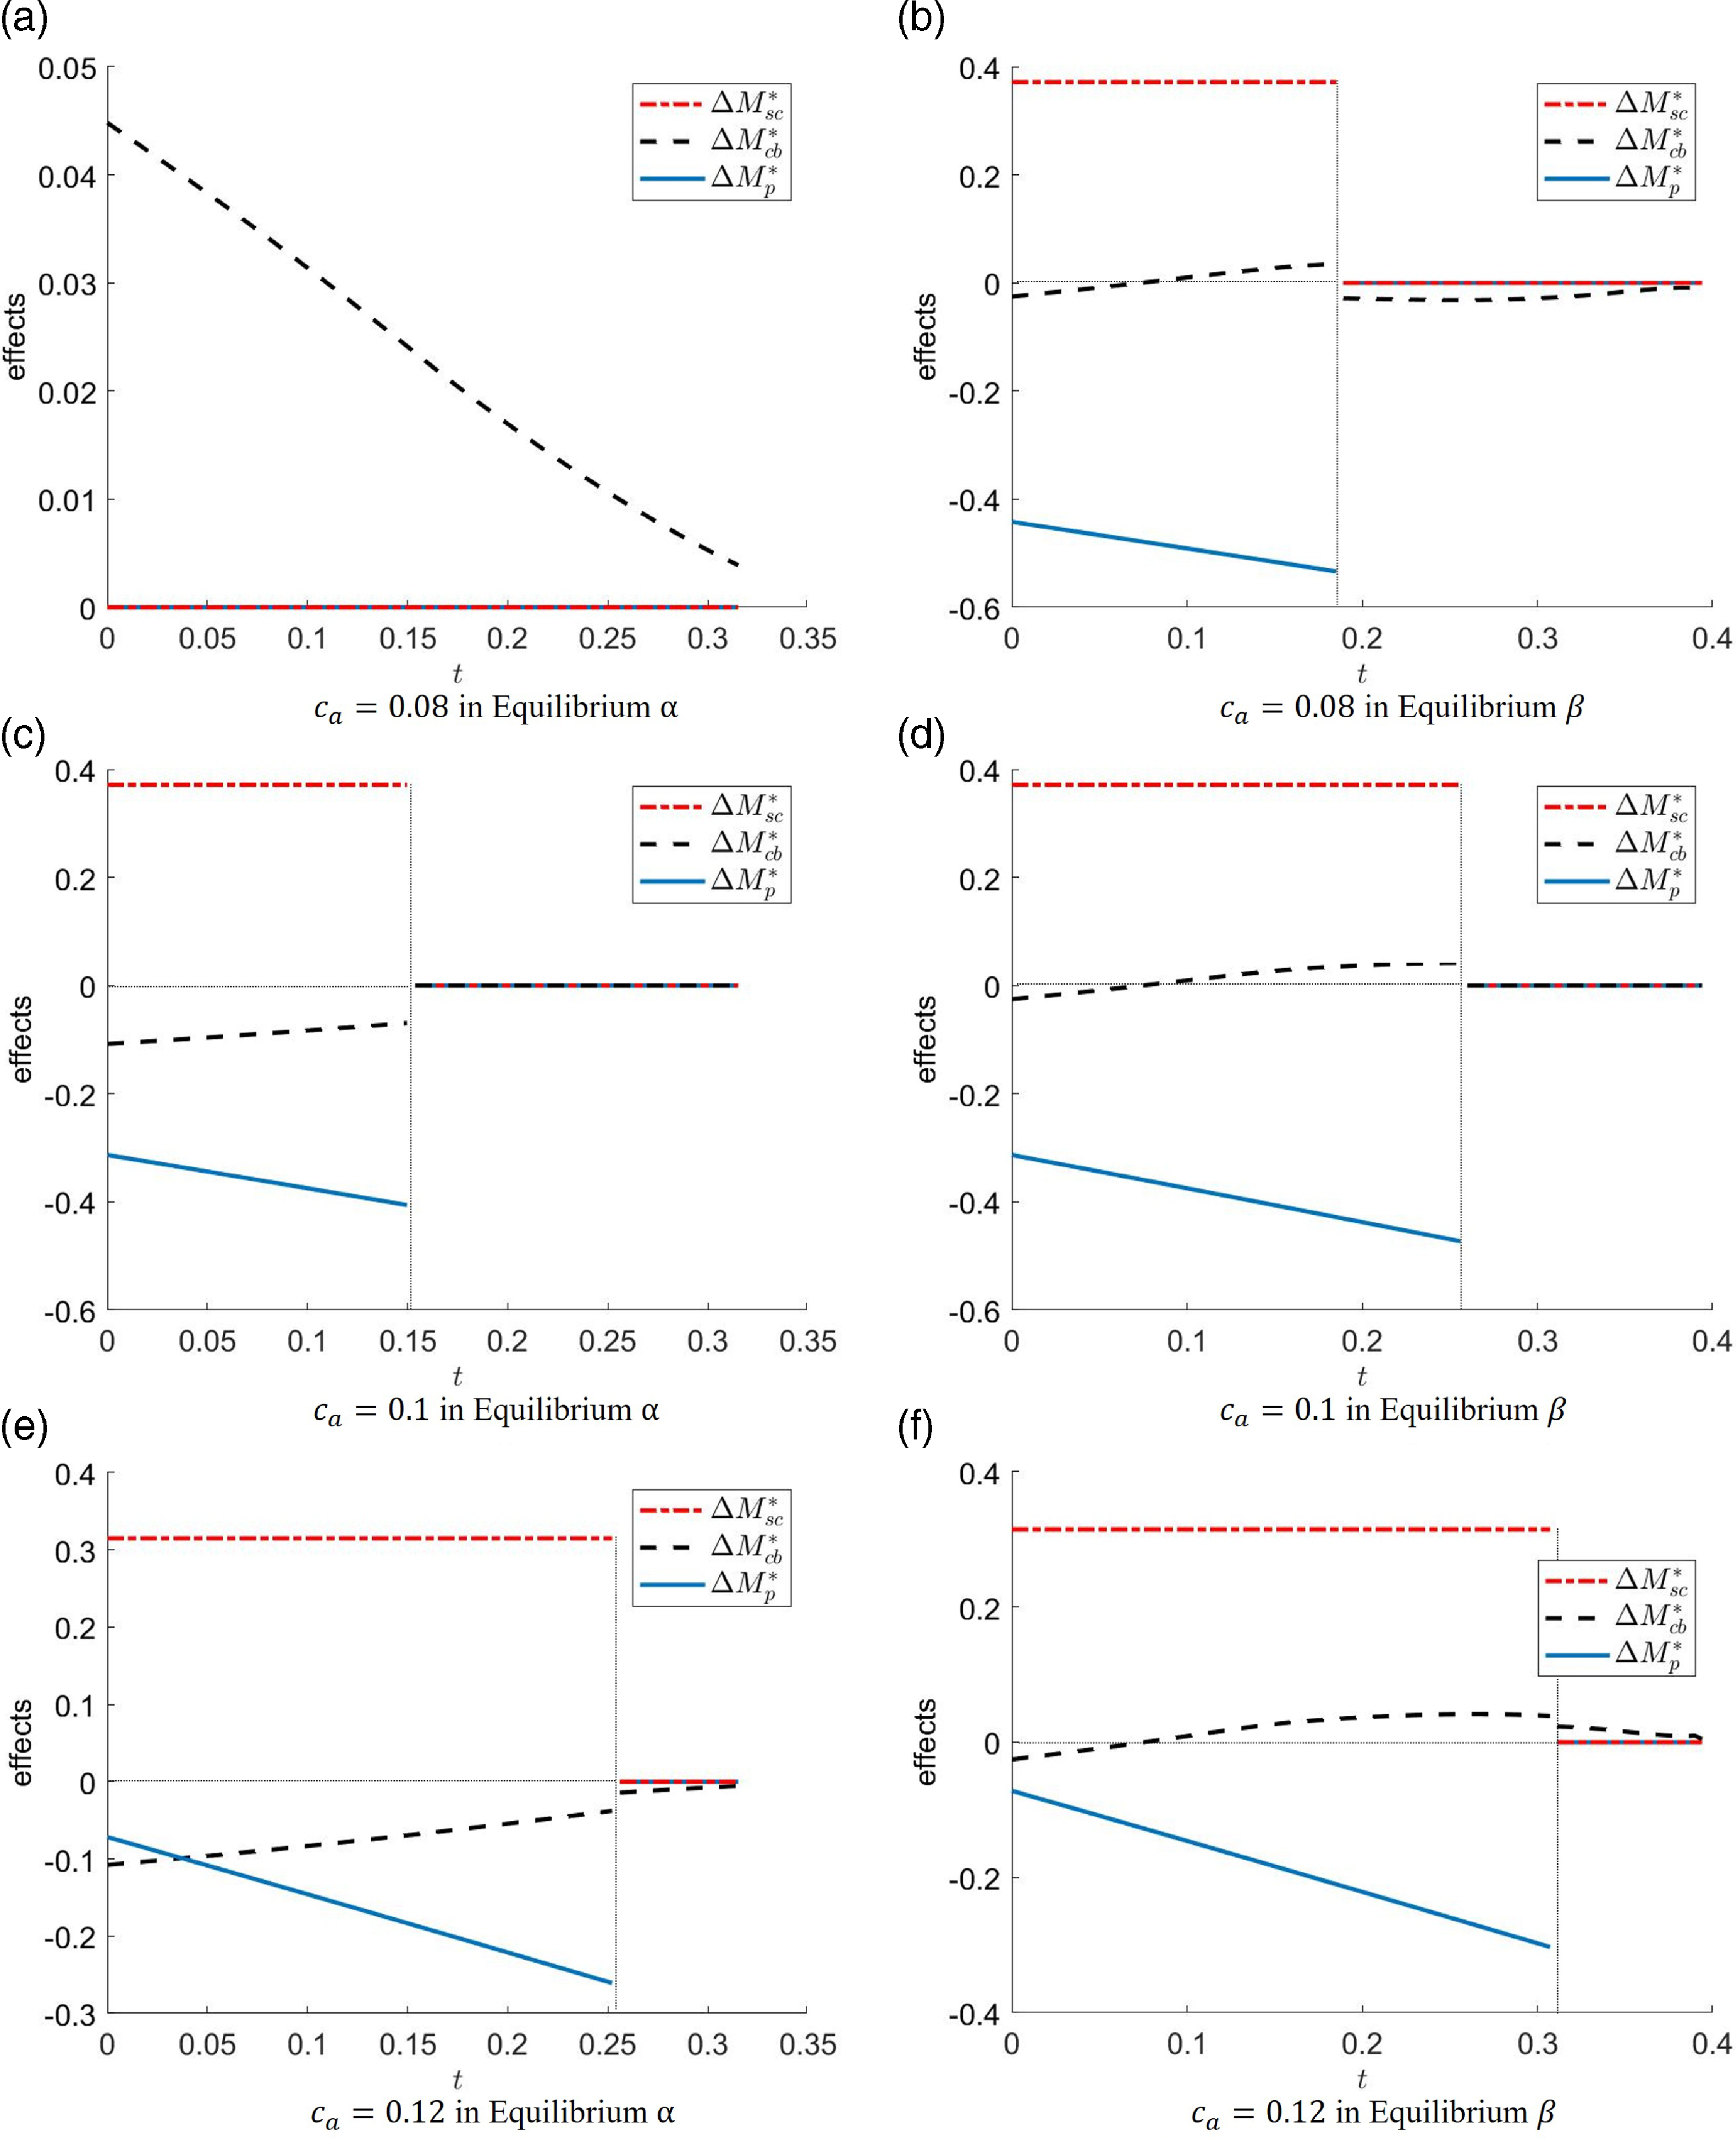
). In Figure 6, the joint effect is decomposed into the search-cost effect, the premium effect, and the customer-belief effect, case by case.
Equilibrium market share of insurer a.

Search-cost, customer-belief, and premium effects.

In Equilibrium
 $\alpha$
when
 $c_a = 0.08$
,
 $c_a$
is always lower than
 $c_{2\alpha}^*$
, as shown in Figure 5(a). This means insurer a never applies the technology. Thus, both the search-cost effect and the premium effect are zero, as shown in Figure 6(a). Customers make a random first searching choice. Since insurer a has a lower cost than insurer b (i.e.,
 $c_a\lt 0.1=c_b$
), compared to the observable-accessibility case, more customers will perform a second searching and end up buying from insurer a after learning the premium of insurer b due to the customer-belief effect, as shown in Figure 6(a). As a result, insurer a gains a higher market share in the main model, compared to the no-technology case, as shown by the blue line in Figure 5(c).
In Equilibrium
 $\alpha$
when
 $c_a=0.1$
, insurer a applies the technology if
 $t\lt 0.151$
, and does not apply it if
 $t\geq 0.151$
, as shown in Figure 5(a). When it applies the technology, the search-cost effect is always positive, while both the premium effect and the customer-belief effect are negative, as shown in Figure 6(c). The aggregate negative impact of the premium effect and the customer-belief effect dominates, leading insurer a to earn a lower market share, compared to the no-technology case, as shown by the black line in Figure 5(c). When insurer a does not apply the technology, the search-cost effect and premium effect are zero, as shown in Figure 6(c). Moreover, since
 $c_a=c_b = 0.1$
, customers make random final buying choices after second searching. Thus, the customer-belief effect does not play a role either. In this case, insurer a does not benefit from having access to the new technology, as shown by the black line in Figure 5(c).
In Equilibrium
 $\alpha$
when
 $c_a=0.12$
, insurer a applies the technology if
 $t\lt 0.252$
and does not apply it if
 $t\geq 0.252$
, as shown in Figure 5(a). When insurer a applies the technology, the search-cost effect is positive, while both the premium effect and the customer-belief effect are negative, similar to the case when
 $c_a=0.1$
in Equilibrium
 $\alpha$
. However, different from the case when
 $c_a=0.1$
in Equilibrium
 $\alpha$
, when
 $c_a=0.12$
, the search-cost effect dominates, leading insurer a to earn a market share higher than that in the no-technology case, as shown by the red line in Figure 5(c). When insurer a does not apply the technology, both the search-cost effect and the premium effect are zero. After the random first searching, more customers perform second searching, find the lower premium offered by insurer b, and buy from insurer b due to the negative customer-belief effect. In this case, having access to the new technology lowers the market share of insurer a when it does not apply it, as shown by the red line in Figure 5(c).
In Equilibrium
 $\beta$
, the sign of the search-cost effect and premium effect are the same as that in Equilibrium
 $\alpha$
, as shown in Figure 6(b), (d), and (f). But the customer-belief effect varies between Equilibrium
 $\alpha$
and
 $\beta$
since the equilibrium cutoffs and corresponding beliefs of customers change. When insurer a applies the technology (i.e., when
 $c_a=0.08$
and
 $t\lt 0.185$
, when
 $c_a = 0.1$
and
 $t\lt 0.256$
, or when
 $c_a=0.12$
and
 $t\lt 0.307$
), as the technology becomes more cost-saving (i.e., as t decreases), the customer-belief effect decreases and changes from positive to negative. When insurer a does not apply the technology, insurer a receives a negative customer-belief effect when its cost is lower than that of the insurer b (i.e., when
 $c_a = 0.08 \lt c_b = 0.1$
), but benefits from a positive customer-belief effect when its cost is higher (i.e., when
 $c_a = 0.12 \gt c_b = 0.1$
). The customer-belief effect does not play a role when
 $c_a=c_b = 0.1$
.
For the aggregate effect in Equilibrium
 $\beta$
, (i) when
 $c_a=0.08$
, insurer a earns a lower market share due to having access to a new technology, no matter it applies the technology or not; (ii) when
 $c_a=0.1$
, insurer a increases (resp. decreases) its market share when it applies the technology and when the technology is (resp. is not) cost-saving enough; and (iii) when
 $c_a = 0.12$
, insurer a earns a higher market share due to its access to the new technology regardless of whether it applies the technology or not.
In conclusion, due to the premium effect and the customer-belief effect, which can be both negative, applying the new technology does not necessarily increase the market share of insurer a, compared to the no-technology case. This lack of a positive correlation between technology adoption and market share does not depend on the status of the technology. Moreover, not applying an available technology may also decrease an insurer’s market share.
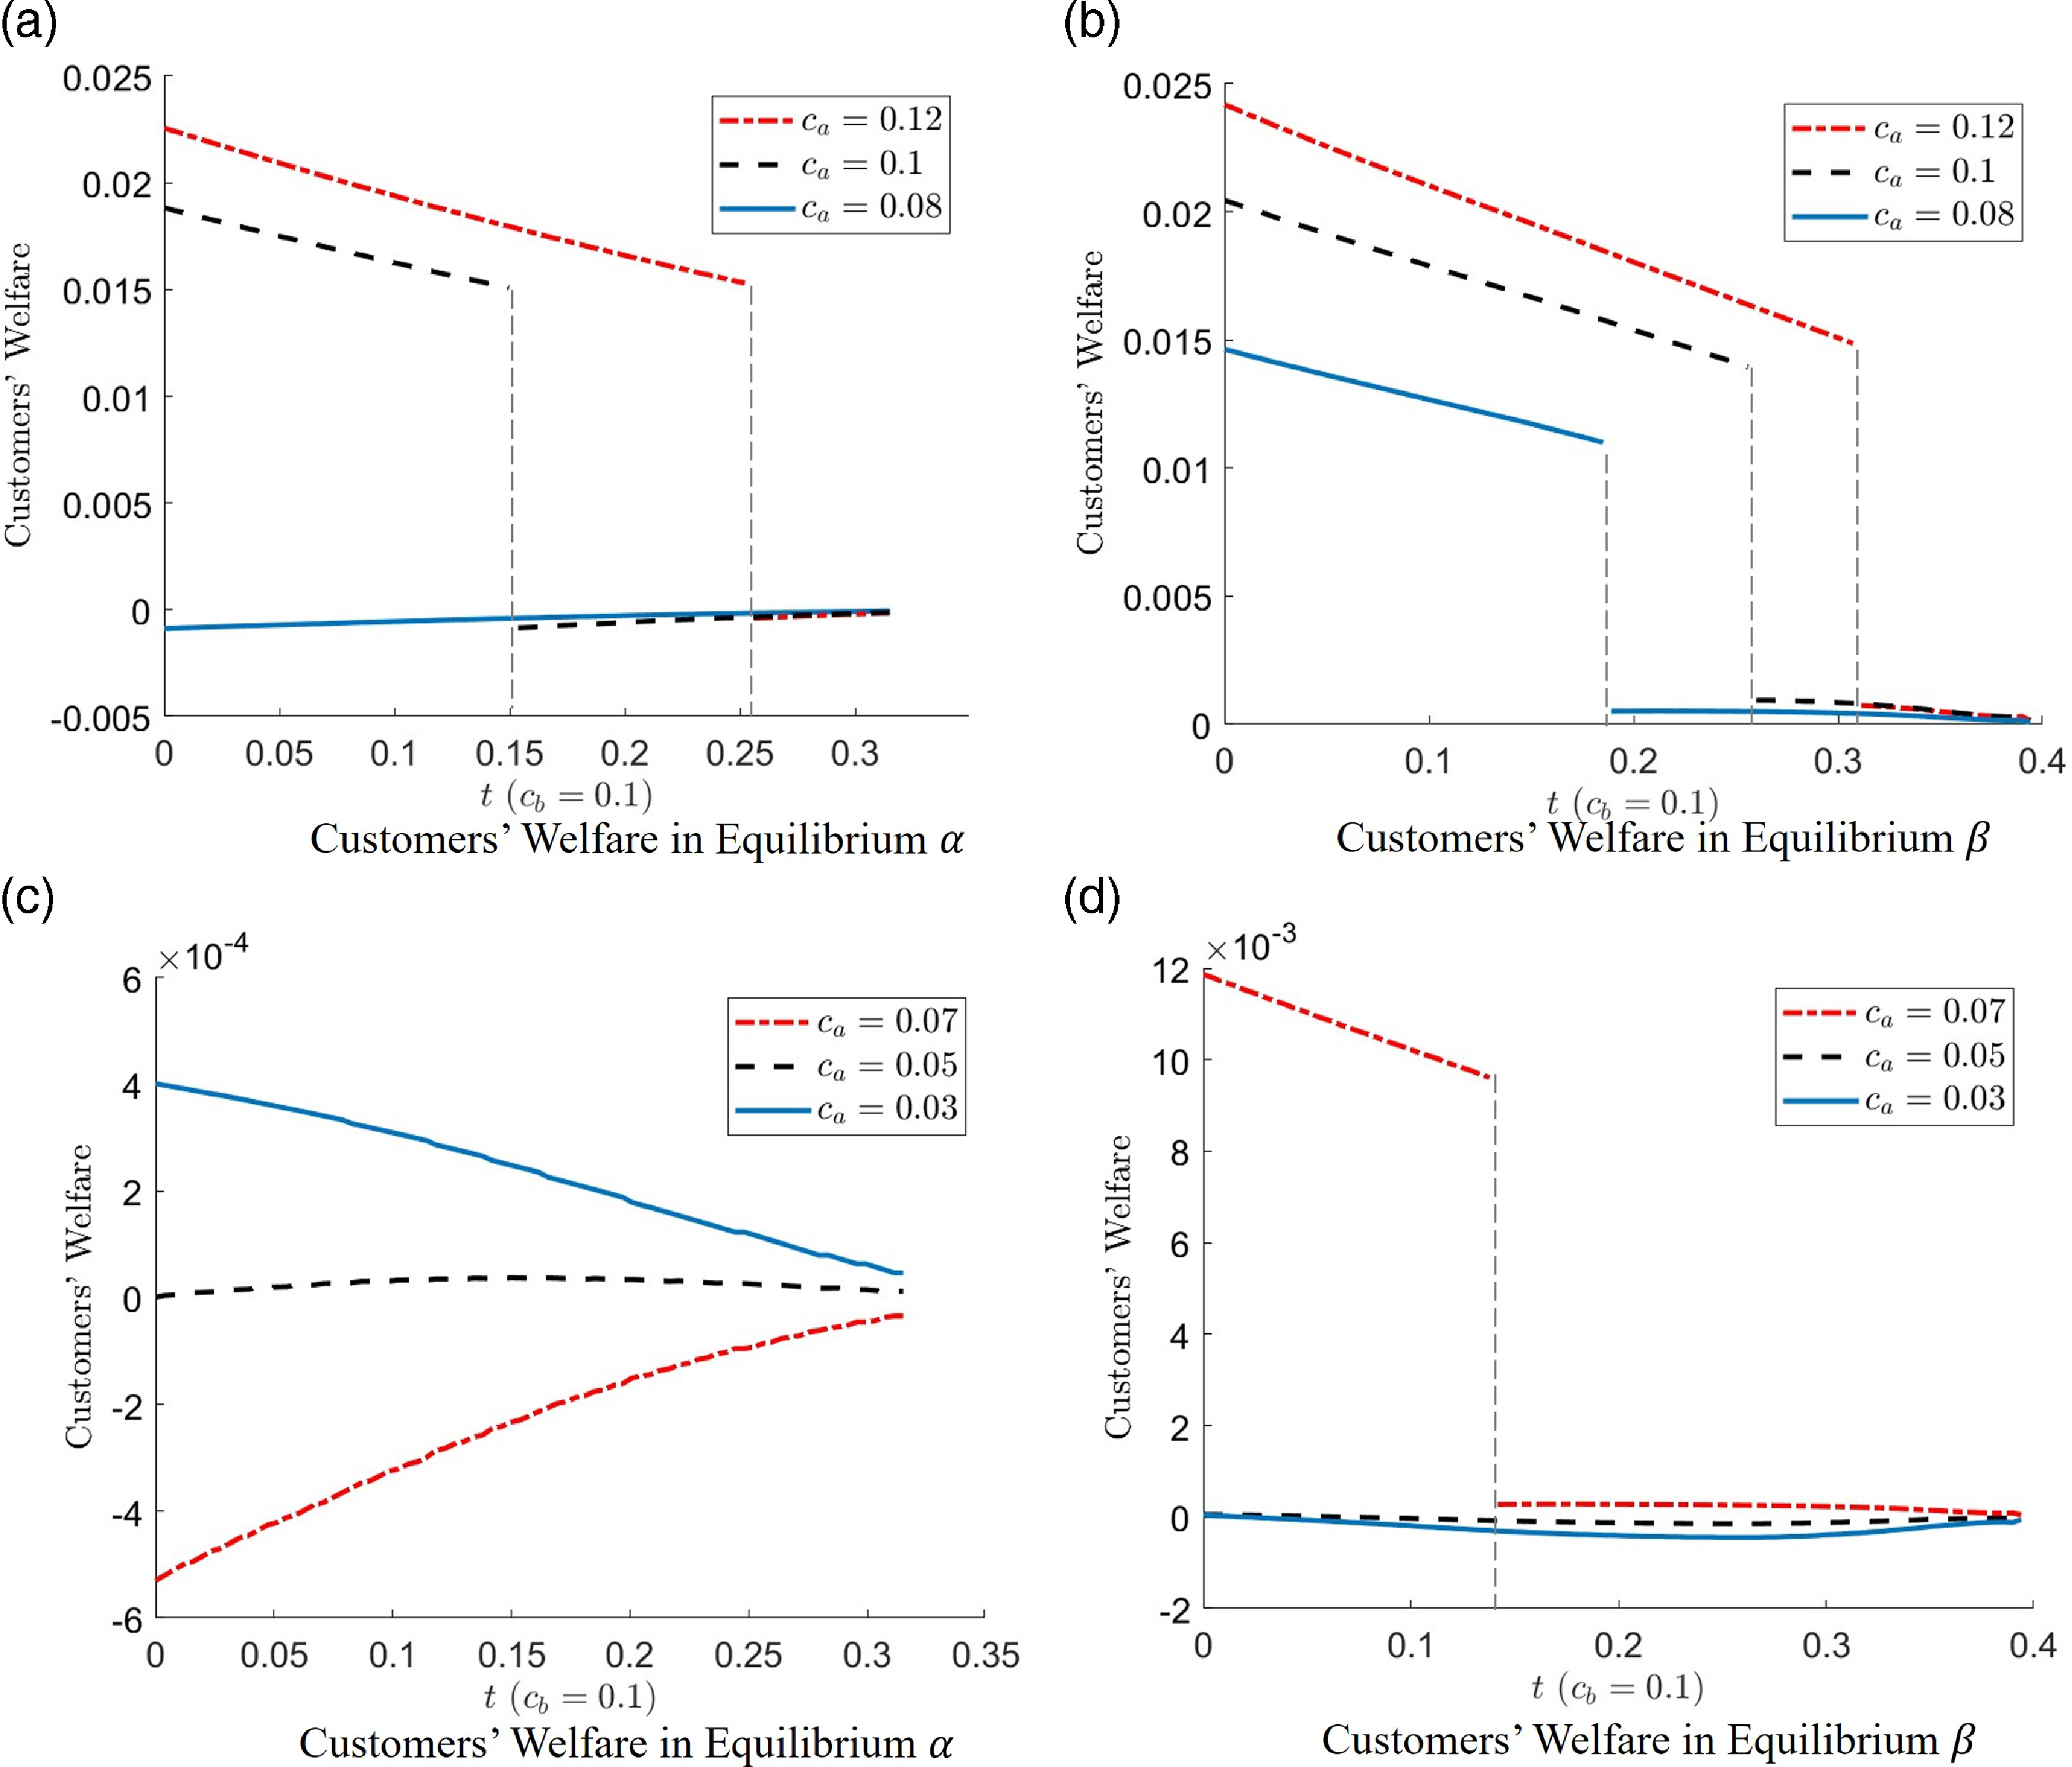
Moreover, the negative premium effect and customer-belief effect can also lead to a decrease in customers’ welfare, which is defined as the sum of customers’ expected utilities. Specifically, Figure 7 shows the difference in customers’ welfare between the main model and no-technology case in the two equilibria when given the cost of insurer b,
 $c_b = 0.1$
, and different values of
 $c_a$
. The new technology may decrease customers’ welfare when insurer a does not adopt it. That is the cases when
 $c_a = 0.08$
(in Figure 7(a)) and
 $c_a = 0.07$
(in Figure 7(c)) in Equilibrium
 $\alpha$
, as well as when
 $c_a = 0.03$
in Equilibrium
 $\beta$
(in Figure 7(d)). Besides, the technology may decrease customers’ welfare when insurer a adopts the new technology, as seen in the cases when
 $c_a = 0.1$
, and
 $0.12$
in Equilibrium
 $\alpha$
(in Figure 7(a)).
Difference in customers’ welfare between the main model and no-technology case.

The undetermined impact of new technology on customers’ welfare results from the three effects. When insurer a adopts the new technology, customers’ search costs are lowered and thus their expected utilities are improved, that is, the positive search-cost effect. When the new technology increases insurer a’s cost (i.e.,
 $tc_a+\underline c \gt c_a$
), insurer a needs to raise its premium, which decreases its customers’ expected utilities, that is, the negative premium effect. The biased belief on insurers’ costs due to the unobservable accessibility of the new technology causes customers to make non-optimal searching choices, and thus decreases their expected utilities, that is, the negative customer-belief effect.
6. Discussion and conclusions
This paper proposes a theoretical framework to explain the unclear relationship between technology adoption and market share for insurers. Specifically, our model features a unit mass of customers who differ in their search costs and two insurers who differ in their technology accessibility and per-contract operational costs, both of which are their private information. The equilibrium in the main model is compared with equilibria in two benchmark cases: a no-technology case, in which both insurers have no access to the new technology, and an observable-accessibility case, in which, insurers’ technology accessibility is observable to customers.
When technology accessibility is unobservable, we find that having access to a new technology does not necessarily increase an insurer’s market share, regardless of whether the insurer applies it. First, the low-cost signal effect becomes invalid because an insurer who has not applied its available technology is no longer distinguishable for customers from insurers without access to the technology. Second, to benefit from being the first searching choice for all customers when the technology accessibility is unobservable, an insurer will apply the technology if the increased cost due to the technology is acceptable (a negative premium effect). Third, due to the unobservable technology accessibility, an insurer without access to the technology will be mistaken for one who has access but has not yet applied it, resulting in a negative customer-belief effect once the cost of its competitor is underestimated. Our numerical examples show that the aggregate negative effect of both the premium effect and the customer-belief effect can dominate and thus lead an insurer with access to the new technology to earn a lower market share, compared to the no-technology case.
The role of technology is considered to lower consumer search costs and change insurers’ operational costs in our model, which is also suitable for analyzing insurance brokers. Thus, our model would be suitable for analyzing insurance brokers by making some alternative assumptions: (i) considering that both insurers have access to using insurance brokers and/or (ii) considering that both insurers and customers can be the decision makers of using brokers. Besides, our model focuses on customers’ heterogeneity in search costs in order to reveal the impact of technology accessibility and adoption from the perspective of cost. We thus get rid of adverse selection and moral hazard problems that are caused by customers’ unobservable and heterogeneous risk types. An interesting extension might be to jointly consider customers’ heterogeneity in search costs and risk types as well as the impact of new technology on the costs and risk assessment ability of insurers. Moreover, since our model features unknown premiums of insurance contracts before searching and customers’ search costs, it may suit to modeling other markets with complicated products that require customers to pay certain search costs, for example, markets of financial products and the labor market.
Supplementary material
The supplementary material for this article can be found at https://doi.org/10.1017/asb.2025.15.
Acknowledgments
We thank the financial support from the National Social Science Foundation of China (Grant No. 24AZD019), National Natural Science Foundation of China (Grant Nos. 71991474 and 72371256), Natural Science Foundation of Guangdong Province of China (Grant Nos. 2023B1515040001 and 2022A1515011472), Early Career Scheme of Hong Kong Research Grants Council (Grant No. 23502724) and Faculty Research Grant of Lingnan University (Grant No. DB24A7).
Competing interests
The authors have no potential competing or conflicting interests to declare.