For mastitis diagnosis, traditional and well-established tests including somatic cell count (SCC) and microbial culture-based methods are standard (Viguier et al. Reference Viguier, Arora, Gilmartin, Welbeck and O'Kennedy2009). According to current definitions of udder health in Germany, SCC ⩽100×103 cells/ml in quarter foremilk samples are in the physiological range (DVG, 2002). It is well known that the crossover of normal cellular defence in the mammary gland into an inflammatory reaction starts at a level of >100×103 cells/ml (Harmon, Reference Harmon1994; DVG, 2002). However, SCC varies with the status of lactation, age, stress of the animals, time and frequency of milking, season, and status of udder infection (Dohoo & Meek, Reference Dohoo and Meek1982; Harmon, Reference Harmon1994). SCC is a robust quantitative estimate, but it does not divide the cells present in milk into different cell types (Kehrli & Shuster, Reference Kehrli and Shuster1994; Rivas et al. Reference Rivas, Quimby, Blue and Coksaygan2001).
In the mammary gland, number and distribution of leucocytes are important for the success of udder defences against invading pathogens (Leitner et al. Reference Leitner, Eligulashvily, Krifucks, Perl and Saran2003). Lymphocytes, macrophages, and polymorphonuclear leucocytes (PMN) play an important role in immune reactions within the mammary gland (Paape et al. Reference Paape, Wergin, Guidry and Pearson1979; Sordillo & Nickerson, Reference Sordillo and Nickerson1988). Induction and suppression of immune responses are regulated by lymphocytes (Nickerson, Reference Nickerson1989). They recognize antigens through membrane receptors specific for invading pathogens (Sordillo et al. Reference Sordillo, Shafer-Weaver and DeRosa1997). Macrophages are active phagocytic cells in the mammary gland and capable of ingesting bacteria, cellular debris and accumulated milk components (Sordillo & Nickerson, Reference Sordillo and Nickerson1988). Milk or tissue macrophages recognize the invading pathogens and initiate an immune response by the release of chemo-attractants inducing the rapid recruitment of PMN into the mammary gland (Paape et al. Reference Paape, Mehrzad, Zhao, Detilleux and Burvenich2002; Oviedo-Boyso et al. Reference Oviedo-Boyso, Valdez-Alarcón, Cajero-Juárez, Ochoa-Zarzosa, López-Meza, Bravo-Patiño and Baizabal-Aguirre2007). The main task of PMN is the defence of invading bacteria at the beginning of an acute inflammatory process (Paape et al. Reference Paape, Wergin, Guidry and Pearson1979; Oviedo-Boyso et al. Reference Oviedo-Boyso, Valdez-Alarcón, Cajero-Juárez, Ochoa-Zarzosa, López-Meza, Bravo-Patiño and Baizabal-Aguirre2007). Not only does the number of PMN increase enormously, but also their level of defence activity (Targowski, Reference Targowski1983; Paape et al. Reference Paape, Bannerman, Zhao and Lee2003).
The distribution of leucocyte types varies in normal milk without any symptoms of mastitis. Some previous studies found lymphocyte proportions between 14 and 80%, macrophage proportions between 12 and 46%, and those of PMN between 6 and 50% (Rivas et al. Reference Rivas, Quimby, Blue and Coksaygan2001; Merle et al. Reference Merle, Schröder and Hamann2007; Koess & Hamann, Reference Koess and Hamann2008). In mastitis milk, PMN proportions of up to 95% have been reported (Paape et al. Reference Paape, Wergin, Guidry and Pearson1979; Kehrli & Shuster, Reference Kehrli and Shuster1994). During various phases of inflammation SCC differs in total numbers, whereas differential cell count (DCC) varies in composition of the cell populations involved (Nickerson, Reference Nickerson1989). Therefore, in addition to SCC, determination of different types of immune cells present in milk is beneficial for describing udder health status (Pillai et al. Reference Pillai, Kunze, Sordillo and Jayarao2001; Rivas et al. Reference Rivas, Quimby, Blue and Coksaygan2001). So far, however, there is little knowledge on DCC and the qualitative role of milk leucocytes in healthy udders because DCC in low-SCC milk is difficult to perform (Dosogne et al. Reference Dosogne, Vangroenweghe, Mehrzad, Massart-Leën and Burvenich2003).
Data from a previous study (Schwarz et al. Reference Schwarz, Diesterbeck, Failing, König, Brügemann, Zschöck, Wolter and Czerny2010) indicated a high standard of udder health in a representative part of the dairy cow population in the German federal state Hesse and confirmed the threshold of 100×103 cells/ml differentiating between normal and abnormal secretion of quarters. However, unexpectedly high numbers of mastitis pathogens in the SCC range ⩽100×103 cells/ml were found. They could already be detected at a threshold of 1×10³ cells/ml. Based on these data we suspected inflammatory processes even within the SCC range of mammary glands classified as healthy according to current definitions. Therefore, the objective of this study was the detailed evaluation of health status in udder quarters with SCC clearly <100×103 cells/ml based on a statistical analysis of DCC. Leucocytes were isolated from quarter foremilk samples and differentiated into lymphocytes, macrophages, and PMN using microscopy.
Materials and Methods
Animals and farms
Twenty dairy cows in good condition and without previous history of mastitis were selected from four German dairy farms (A–D) for a detailed analysis of their udder health status based on DCC in quarter foremilk samples. The animals, Holstein-Frisian cows (n=18) and German Simmental cows (n=2), were in different lactations (1–6) and stages of the lactation. Six cows were in their first, seven in their second, three in their third, one in her fourth, two in their fifth and one in her sixth lactation. Seven animals were in an early stage of lactation (28–86 d), eight were in mid lactation (107–177 d) and five in a late stage of lactation (212–289 d). Foremilk samples from 72 udder quarters of the 20 cows classified as normal secreting (SCC ⩽100×103 cells/ml and no pathogen) were selected for DCC analysis. A further 6 quarter foremilk samples with SCC of (100–1824)×103 cells/ml were chosen from 6 cows as control group. Clinical mastitis symptoms such as flecks in milk, swelling or redness of the udder quarters could only be observed in quarters with SCC >100×103 cells/ml.
In Farms A–D, 52–109 dairy cows were housed in pen barns and milked twice a day in milking parlours. Milking operations were similar in all farms. After forestripping into a foremilk cup, the milkers used damp cotton tissues for udder cleaning. Teats were dipped after milking with iodine solution. Feeding comprised a total mixed ration consisting of grass and maize silage, rape grist and cereals. Water was available ad libitum. Farm A produced high quality milk, while farms B–D were conventional milk producers. The average herd annual milk yields of the four farms ranged between 6500 and 9900 kg.
Milk sampling
Quarter foremilk samples were obtained according to DVG (2000) standards. Before milking, teat ends were scrubbed with 70% ethanol and the first two squirts of milk were discarded. Ten millilitres of milk per udder quarter was collected aseptically in a sterile 14-ml plastic sample tube (Greiner Bio-one, Frickenhausen, Germany). Four millilitres was used for SCC and bacteriological examinations, the remaining 6 ml was subjected to DCC analysis.
Quarter foremilk samples were taken on farms B–D during morning milking. Further processing occurred within 4 h. Samples on farm A were collected during evening milking and analysed within 15 h.
Somatic cell counts and bacteriological examinations
SCC was determined using a Fossomatic 5000 (Foss Electric, Hillerød, Denmark). Cytobacteriological analysis of all quarter foremilk samples was performed according to IDF (1981) standards. Promptly after collecting the quarter foremilk samples and cooled-transportation to the laboratory, 10 μl of milk was streaked onto a quadrant of a 7% bovine blood agar plate containing 0·05% aesculin (Merck, Darmstadt, Germany), incubated for 48 h at 37°C, and examined for bacterial growth.
Differential cell counts
Six millilitres of each quarter foremilk sample was transferred into a sterile 14-ml plastic tube. Milk samples were then centrifuged at 200 g at 4°C for 15 min. Cream layers and supernatants were discarded and cells were washed once in PBS by centrifugation at 200 g at 4°C for 15 min. Cell pellets were finally resuspended in 20 μl PBS. To obtain as many cells as possible for DCC analysis on the microscope slide, the whole sediment of the tube was spread over an area of 2 cm2. Cell staining was performed according to the method of Pappenheim (Reference Pappenheim1912).
Evaluation of the slides followed using light microscopy and oil immersion (100-fold magnification). One-hundred cells of each slide were counted meander-shaped and differentiated into lymphocytes, macrophages and PMN. Cell identification occurred according to standard methods (Coles, Reference Coles1974; Lee et al. Reference Lee, FBP Wooding and Kemp1980). Lymphocytes were identified based on their circular form (5–10 μm) and the typical shape of the nucleus that almost fills the cell leaving a very thin rim of cytoplasm. Cells of 8–30 μm in size containing a little nucleus and pale staining were considered as macrophages. The group of PMN was characterized as cells of 10–14 μm in size and segmented nuclei. They were intensely coloured and contained granula in the cytoplasm.
Statistical analyses
Associations between values for individual cell populations and values for SCC were analysed by applying linear mixed models as implemented in the SAS program (version 9.1, SAS Institute, Cary NC, USA). The statistical model included fixed and random effects as well as a regression on SCC up to the third polynomial degree, in order to fit regression curves. The non-significant regression coefficients of different polynomial structures were removed from the model by using F-statistics sum of square type I tests at P<0·05 instead of likelihood ratio tests. Based on type I sums of squares at P<0·05, a sequential analysis approach is appropriate for polynomial formulated models (Littell et al. Reference Littell, Henry and Ammerman1998). The applied statistical model [1] was defined as follows:

where:
- yijkl=
observation for the individual cell population (lymphocytes, macrophages, PMN) of the individual udder quarter of cow l
- μ=
overall mean effect
- herdi=
fixed effect of the i-th herd of cow l
- parityj=
fixed effect of the j-th lactation number of cow l [1, 2, ⩾3]
- DIMk=
fixed effect of the k-th stage of lactation of cow l [early, 28–86 d; mid, 107–177 d; late, 212–289 d]
- cowl=
random effect of cow l
- SCCijkl=
value for SCC of the individual udder quarter of cow l
- α1,α2, α3=
linear, quadratic, and cubic regression on SCC
- eijkl=
random residual effect
For verification of results of model [1], and to test DCC data especially for differences in the SCC range ⩽100×103 cells/ml, analysis of variance was additionally done by including a fixed effect of the SCC group and removing the SCC covariates from the statistical model. Therefore, all 78 udder quarters were classified into SCC groups I–IV as defined in a previous study (Schwarz et al. Reference Schwarz, Diesterbeck, Failing, König, Brügemann, Zschöck, Wolter and Czerny2010). Group IV represented the control quarters. Twenty-five (31%) of the 78 samples analysed belonged to group I according to their SCC values of ⩽6·25×103 cells/ml. Forty-one samples (53%) showed SCC values of (>6·25 to ⩽25)×103 cells/ml (group II). Six samples (8%) with SCC of (>25 to ⩽100)×103 cells/ml were categorized into group III. A further six samples (8%) with SCC >100×103 cells/ml were sorted into group IV. The applied statistical model [2] was defined as follows:

where:
- yijklm=
observation for the individual cell population (lymphocytes, macrophages, PMN) of the individual udder quarter of cow l
- μ=
overall mean effect
- herdi=
fixed effect of the i-th herd of cow l
- parityj=
fixed effect of the j-th lactation number of cow l [1, 2, ⩾3]
- DIMk=
fixed effect of the k-th stage of lactation of cow l [early, 28–86 d; mid, 107–177 d; late, 212–289 d]
- cowl=
random effect of cow l
- groupm=
fixed effect of the m-th SCC-group [I, ⩽6·25×103 cells/ml; II, (>6·25 to ⩽25)×103 cells/ml; III, (>25 to ⩽100)×103 cells/ml; IV, >100×103 cells/ml]
- eijklm=
random residual effect
Results
Somatic cell counts and bacteriological status of quarter foremilk samples
The 78 udder quarters selected showed a geometric mean value for SCC of 11·78×103 cells/ml and a median of 10×103 cells/ml. The quarter with the lowest SCC contained 1×10³ cells/ml, the quarter with the highest SCC contained 1824×103 cells/ml. Udder pathogenic microorganisms were identified in only two of the 78 quarter foremilk samples. In two of the six control quarters (SCC of 967×103 cells/ml and 1824×103 cells/ml) Escherichia coli and Staphylococcus aureus were detected.
Differential cell counts of quarter foremilk samples depending on somatic cell counts
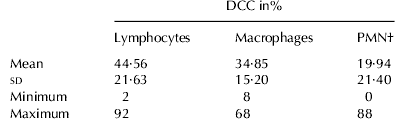
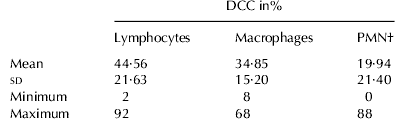
For a more detailed evaluation of the udder health status 100 cells per quarter foremilk sample were differentiated into lymphocytes, macrophages, and PMN. In view of DCC (n=78) the proportions of lymphocytes lay between 2 and 92% with a mean of 44·56% and sd of 21·63% (Table 1). Proportions of macrophages ranged between 8 and 68% with a mean of 34·85% and sd of 15·20%. PMN proportions varied between 0 and 88% with a mean of 19·94% and sd of 21·40%.
General overview of differential cell counts (DCC) of 78 quarter foremilk samples analysed by microscopy
† Polymorphonuclear leucocytes
Because of the wide variations found within the cell populations, particularly in case of lymphocytes and PMN, DCC data were tested for correlation with SCC using the statistical model [1].
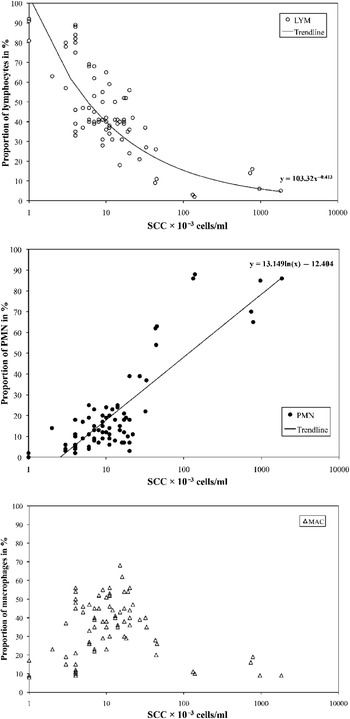
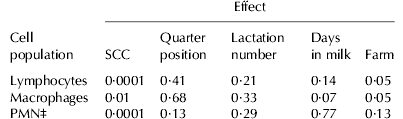
Lymphocytes decreased continuously from 92% at SCC of 1×10³ cells/ml to only 5% at an SCC of 1824×103 cells/ml (Fig. 1A). The statistical analysis (model [1]) indicated a significant (P<0·001) negative correlation between percentages of lymphocytes and SCC (Table 2).
A–C. Differential cell counts (DCC) depending on somatic cell counts (SCC): A, Proportions of lymphocytes (○ LYM) pictured in combination with a calculated potential trendline; B, Proportions of polymorphonuclear leucocytes (● PMN) pictured in combination with a calculated logarithmic trendline. C, Proportions of macrophages (▵ MAC); each symbol represents the result of one udder quarter analysed, but overlapping is possible.

Results of variance analysis (model [1]) for the percentage of the individual cell populations in 78 quarter foremilk samples analysed by microscopy†
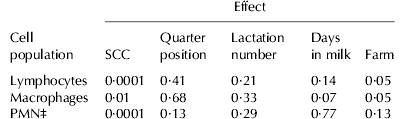
† Factors analysed were somatic cell count (SCC), quarter positions (front right, rear right, front left, and rear left), lactation number (1, 2, ⩾3), days in milk (28–86 d, 107–177 d, 212–289 d), and farm (A–D)
‡ Polymorphonuclear leucocytes
Percentages of PMN (Fig. 1B) and lymphocytes (Fig. 1A) emerged in contrary directions at rising SCC. PMN increased constantly from 0% at SCC of 1×10³ cells/ml to a maximum of 88% at 139×103 cells/ml. At SCC of 1824×103 cells/ml the proportion of PMN was 86%. Interestingly, PMN was already the predominant cell population at a SCC level of 43×103 cells/ml with a proportion of 62%. This event was observed in three udder quarters [SCC (43–45)×103 cells/ml] of three different cows housed in two different farms. Statistical analysis (model [1]) indicated a significant (P<0·001) positive correlation between percentage of PMN and SCC (Table 2).
Within the SCC range of (3–100)×103 cells/ml macrophage proportions lay between 8% and 68% (Fig. 1C). At SCC <3×10³ cells/ml and in samples with >100×103 cells/ml proportions of macrophages were <30%. Statistical analysis (model [1]) revealed a significant (P<0·01) negative correlation between macrophage percentage and SCC (Table 2). In addition, the position of the udder quarter, the lactation number and the stage of lactation had no significant impact on the individual cell populations (Table 2). However, percentages of lymphocytes and macrophages were significantly influenced by the farm (Table 2).
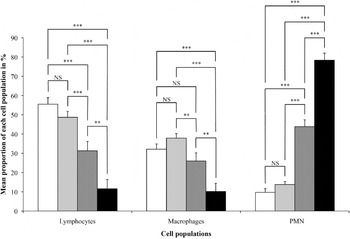
Statistical analysis (model [1]) revealed a significant negative correlation between the percentages of lymphocytes and SCC, a significant negative correlation between macrophages and SCC, as well as a significant positive correlation between PMN and SCC. To test DCC data especially for differences in the SCC range ⩽100×103 cells/ml, a second statistical analysis (model [2]) was performed (Fig. 2).
Comparison of differential cell counts (DCC) within the somatic cell count (SCC) range of healthy mammary glands (⩽100×103 cells/ml) using statistical model [2]. All 78 udder quarters analysed were classified into SCC groups I–IV (group I, empty bars, SCC ⩽6·25×103 cells/ml, n=25; group II, light grey bars, SCC (>6·25 to ⩽25)×103 cells/ml, n=41; group III, dark grey bars, SCC (>25 to ⩽100)×103 cells/ml, n=6; group IV, black bars, SCC >100×103 cells/ml, n=6). Group IV represents the control quarters. Data are expressed as mean±sem for percentages of the individual cell populations in the four SCC groups defined. Significance level: ***P<0·001; **P<0·01; *P<0·05; NS, not significant. Abbrevation: PMN, polymorphonuclear leucocytes.

Lymphocytes indicated significantly (P<0·01) higher mean percentages in groups I–III (31·31–55·49%) than in group IV (11·56%). Interestingly, mean percentages in groups I and II were significantly (P<0·001) higher than those in group III.
Mean percentages of macrophages indicated significant (P<0·01) differences between groups I–III (26·02–37·88%) and group IV (10·14%). In addition, mean percentages were significantly (P<0·01) lower in group III than those in group II.
Mean percentages of PMN differed significantly (P<0·001) between groups I–III (9·69–43·87%) and group IV (78·37%). In addition, mean percentages of PMN were significantly (P<0·001) lower in groups I and II than those in group III.
Discussion
Together with SCC, determination of DCC in milk is an important tool characterizing udder health (Pillai et al. Reference Pillai, Kunze, Sordillo and Jayarao2001). There are clear SCC cut-offs to differentiate between normal and abnormal secretion of quarters. But even in healthy udders, inflammations can be suspected under special circumstances (Schwarz et al. Reference Schwarz, Diesterbeck, Failing, König, Brügemann, Zschöck, Wolter and Czerny2010). The immunological status of mammary glands classified by DCC is poorly investigated. Reviewing the literature Medzhitov (Reference Medzhitov2007) reported that there might be a lack of knowledge on host defence in asymptomatic infections because almost all studies performed so far concentrated on symptomatic infections. In the present study, we differentiated leucocytes purified from quarter foremilk samples to improve knowledge of the immunological status of clinically healthy and subclinically infected bovine mammary glands. While SCC of >100×103 cells/ml is normally related to inflammatory processes inside the mammary gland, a SCC range of ⩽100×103 cells/ml is in a physiological band (Harmon, Reference Harmon1994; DVG, 2002) but can also be related to latent mastitis in the presence of pathogens (Schwarz et al. Reference Schwarz, Diesterbeck, Failing, König, Brügemann, Zschöck, Wolter and Czerny2010). Here, we predominantly analysed milk samples with SCC <50×103 cells/ml to have a high informative value about DCC in low-SCC milk. Our control group (SCC >100×103 cells/ml) included only six quarters. However, the SCC range >100×103 cells/ml has been studied extensively before and PMN has been reported generally to be the dominant cell population in mastitic milk (e.g. Leitner et al. Reference Leitner, Shoshani, Krifucks, Chaffer and Saran2000; Merle et al. 2005; Koess & Hamann, Reference Koess and Hamann2008).
It is known that the milk fraction collected has an impact on both SCC and DCC (Sarikaya et al. Reference Sarikaya, Werner-Misof, Atzkern and Bruckmaier2005; Sarikaya & Bruckmaier, 2006; Olde Riekerink et al. Reference Olde Riekerink, Barkema, Veenstra, Berg, Stryhn and Zadoks2007). SCC values in foremilk samples of quarters with a total quarter milk SCC >100×103 cells/ml were significantly higher than in cisternal milk (Sarikaya & Bruckmaier, 2006). In samples with SCC <100×103 cells/ml differences of SCC between foremilk and cisternal milk were only minor. While no changes of DCC during milking could be observed in milk with SCC <200×103 cells/ml, proportions of PMN were higher and proportions of macrophages were lower in milk (SCC >200×103 cells/ml) collected post milking compared with milk collected premilking or during the milking process (Olde Riekerink et al. Reference Olde Riekerink, Barkema, Veenstra, Berg, Stryhn and Zadoks2007). Sarikaya et al. (Reference Sarikaya, Werner-Misof, Atzkern and Bruckmaier2005) also reported that the proportion of macrophages decreased while that of PMN increased during milking. Since we concentrated predominantly on the analysis of low-SCC milk, we presume that the foremilk samples taken in our study are representative for the analysis of the udder health status.
Our results indicate that lymphocytes were the predominant cell population in healthy mammary glands. Milk samples with an extremely low SCC value of ⩽6·25×103 cells/ml revealed high lymphocyte proportions of up to 92% (mean value: 55%). In a SCC range of (>6·25 to ⩽25)×103 cells/ml a high mean proportion of lymphocytes (49%) was determined too. Information on DCC in milk samples with such low SCC from other field studies is rare. Only Koess & Hamann (2008) reported a mean value of 25% for the proportion of lymphocytes in the SCC range of (0–50)×103 cells/ml. Merle et al. (Reference Merle, Schröder and Hamann2007) measured a mean proportion of 25% of lymphocytes in milk samples with SCC <100×103 cells/ml. In an experimental study (Rivas et al. Reference Rivas, Quimby, Blue and Coksaygan2001) lymphocyte proportions between 54 and 80% were measured pre-inoculation in udder quarters with SCC <200×103 cells/ml. Data from our study showed higher proportions of lymphocytes in milk with SCC <100×103 cells/ml than reported before. This difference resulted from the analysis of milk with very low SCC, because lymphocytes were the dominant cell population in these samples. The proportions of 2–16% of lymphocytes in milk secreted by diseased udder quarters (SCC >100×103 cells/ml) were clearly lower than those in healthy quarters. Similar observations were described before (Rivas et al. Reference Rivas, Quimby, Blue and Coksaygan2001; Merle et al. Reference Merle, Schröder and Hamann2007; Koess & Hamann, Reference Koess and Hamann2008).
In udder quarters classified as normal secreting (SCC ⩽100×103 cells/ml) PMN proportions ranged from 0 to 63%. Our data show that PMN, particularly in milk samples with SCC values ⩽6·25×103 cells/ml, were rare (mean PMN proportion: 10%). At a SCC level of (>6·25 to ⩽25)×103 cells/ml the mean proportion of PMN of 14% was also low. Comparable data for such low SCC values are not available from the literature. Only a mean PMN proportion of 30% in udder quarters with SCC of (0–50)×103 cells/ml was reported previously (Koess & Hamann, Reference Koess and Hamann2008). However, because of an increased transfer of PMN from blood into the mammary gland at the beginning of an inflammation (Kehrli & Shuster, Reference Kehrli and Shuster1994; Paape et al. Reference Paape, Mehrzad, Zhao, Detilleux and Burvenich2002; Paape et al. Reference Paape, Bannerman, Zhao and Lee2003), a high percentage of PMN in milk is an important indicator of inflammatory reactions (Pillai et al. Reference Pillai, Kunze, Sordillo and Jayarao2001; Paape et al. Reference Paape, Mehrzad, Zhao, Detilleux and Burvenich2002). PMN have been reported previously as the predominant cell population in secretions of diseased mammary glands (Paape et al. Reference Paape, Wergin, Guidry and Pearson1979; Kehrli & Shuster, Reference Kehrli and Shuster1994). We made the unexpected observation that in milk of udder quarters classified as normal secreting PMN dominated already at SCC ⩾43×103 cells/ml. This finding suggested that inflammatory processes appear already in a SCC range that is clearly below the cut-off value of 100×103 cells/ml. Factors that might have triggered the elevated proportion of PMN might be manifold. A dairy cow is under constant pressure from udder pathogenic microorganisms in the environment. The elevated PMN proportion could be evidence for the initial phase of an inflammation. In this regard it is also possible that PMN are able to defend against pathogens successfully and prevent mastitis. However, although we could not isolate any pathogens in such quarters they might be not healthy anyhow. Negative bacteriological results could depend on intermittent pathogen shedding (Sears et al. Reference Sears, Smith, English, Herer and Gonzalez1990), presence of antimicrobials or other inhibitors in milk (Reiter, Reference Reiter1978). At the time of examination pathogens could also be ingested by phagocytes or survive intracellularly in the host (Newbould & Neave, Reference Newbould and Neave1965; Hill et al. Reference Hill, Shears and Hibbitt1978). Shedding of too low amounts of pathogens or ceased growth may be further reasons for negative bacteriological results (Sears et al. Reference Sears, Smith, English, Herer and Gonzalez1990).
The interdependence of infections, inflammatory processes, and immune responses in individual udder quarters is discussed controversially in the literature. Some authors suggested that individual udder quarters within a cow can be influenced by infections of neighbouring quarters (Merle et al. Reference Merle, Schröder and Hamann2007) whereas others did not find any evidence for an interdependence of udder quarters (Wever & Emanuelson, Reference Wever and Emanuelson1989) because they did not find DCC to be affected by the bacteriological status of adjacent quarters. Our data indicated no immunological interdepencence between the four udder quarters at low and high SCC levels. In the three udder quarters of three different cows with SCC of (43–45)×103 cells/ml in foremilk samples, elevated PMN proportions between 54 and 63% were determined. In the remaining nine quarters of these cows clearly lower SCC values of (4–19)×103 cells/ml, lower PMN proportions of 6–18%, and no bacterial infection were detected. Furthermore, no interactions between the quarters were observed in the six cows of the control group with high SCC values >100×103 cells/ml and PMN proportions of 65–92% in one udder quarter. In these animals SCC <100×103 cells/ml and PMN proportions of 4–39%, respectively, were detected in the other three quarters.
Another factor that might have triggered the elevated percentage of PMN is stress (Davis et al. Reference Davis, Maney and Maerz2008). Although we did not measure parameters related to stress, such as corticosterone in plasma, the influence of stress in our study might be minimal because the animals analysed were kept under optimal conditions and according to national guidelines. No obvious symptoms of stress (i.e. kicking during pre-milking preparation of the udder or during taking the quarter foremilk samples) was observed.
The antidromic trend of lymphocyte and PMN percentages at increasing SCC is caused by the composition of milk leucocytes. Since they consist primarily of lymphocytes, macrophages and PMN (Sordillo & Nickerson, Reference Sordillo and Nickerson1988), the increase of the percentage of one cell population implies the decrease of at least one of the other cell populations. However, our statistical analysis indicated a significant impact of the farms on percentages of both macrophages and lymphocytes. This impact might be due to a non-randomized selection of cows within the farms and different numbers of cows selected per farm. While cows with healthy mammary glands were predominantly selected from farms A, B and D, samples from cows with diseased quarters were predominantly collected from farm C.
Besides PMN, macrophages also possess phagocytic functions. Milk samples with extremely low SCC values of ⩽6·25×103 cells/ml showed a mean proportion of 32% of macrophages. In the SCC range of (>6·25 to ⩽25)×103 cells/ml the mean macrophage proportion was 38%. In the literature a mean value of 43% of macrophages was reported for the SCC range of (0–50)×103 cells/ml (Koess & Hamann, Reference Koess and Hamann2008). In the case of diseased udder quarters (SCC >100×103 cells/ml) we measured macrophage proportions of 9–28%. These results lay also within a wide range of 4–48% as mentioned in other studies (Rivas et al. Reference Rivas, Quimby, Blue and Coksaygan2001; Merle et al. Reference Merle, Schröder and Hamann2007; Koess & Hamann, Reference Koess and Hamann2008). While we found that macrophages were the second dominant cell population in almost all samples tested in relationship to lymphocytes and PMN, they had been reported to be the predominant cell population in milk of healthy mammary glands (Lee et al. Reference Lee, FBP Wooding and Kemp1980). This difference might be explainable by different definitions of healthy mammary glands. In our study we focused on the analysis of immune cells in milk with very low SCC values. However, Lee et al. (Reference Lee, FBP Wooding and Kemp1980) defined mammary glands as healthy based on negative bacteriological examinations and did not present any SCC values.
Besides leucocytes, epithelial cells can also be found in milk. In the literature (Lee et al. Reference Lee, FBP Wooding and Kemp1980; Koess & Hamann, Reference Koess and Hamann2008) low proportions of epithelial cells of 1–3%, which were similar to our examinations (data not shown), were described. Other researchers reported epithelial cell proportions of 10–19% (Miller et al. Reference Miller, Paape and Fulton1991) or even 44% (Leitner et al. Reference Leitner, Shoshani, Krifucks, Chaffer and Saran2000). However, proportions of ⩾10% should be discussed critically. Miller et al. (Reference Miller, Paape and Fulton1991) analysed milk of primiparous cows during the first 75 d of lactation, whereas Leitner et al. (Reference Leitner, Shoshani, Krifucks, Chaffer and Saran2000) measured epithelial cells by flow cytometry based on a non-specific identification procedure.
Variations in the distribution of leucocytes in milk from non-infected mammary glands as shown in other studies, were probably dependent on differences in methods, sampling, investigators (Schröder & Hamann, Reference Schröder and Hamann2005), breed (Leitner et al. Reference Leitner, Eligulashvily, Krifucks, Perl and Saran2003), stage of lactation (Vangroenweghe et al. Reference Vangroenweghe, Dosogne, Mehrzad and Burvenich2001; Dosogne et al. Reference Dosogne, Vangroenweghe, Mehrzad, Massart-Leën and Burvenich2003) and variable SCC. Contrary to other authors (Schröder & Hamann, Reference Schröder and Hamann2005), we did not observe influences of the composition of the sample tubes (glass or plastic) on differences of phagocytic cell percentages (data not shown).
In our study bacteriological examinations revealed udder pathogenic microorganisms in only 2 of the 78 udder quarters analysed (2 of the 6 control quarters). Esch. coli, however, was found in a quarter with high SCC of 967×103 cells/ml (DCC: lymphocytes 6%, PMN 85%, macrophages 9%), whereas Staph. aureus was detected in a quarter with SCC of 1824×103 cells/ml (DCC: lymphocytes 5%, PMN 86%, macrophages 9%). These few bacteriological findings did not allow any assessment. However, other studies (Piccinini et al. Reference Piccinini, Bronzo, Moroni, Luzzago and Zecconi1999) also found PMN to be the dominant cell population in milk of udder quarters infected with major pathogens.
Conclusion
SCC is an undisputed and well-established criterion for the evaluation of udder health and milk quality. However, in addition to SCC, DCC can be used for a more detailed analysis of udder health status. Analysing DCC of mammary glands classified as normal secreting by SCC <100×103 cells/ml, inflammatory reactions were already detectable at a SCC level of ⩾43×103 cells/ml due to predominating PMN proportions in foremilk samples of the corresponding udder quarters. This is the first study indicating inflammatory reactions in udder quarters with SCC that were clearly below the current threshold of 100×103 cells/ml.
The authors are grateful to U Eskens, T Kinder, A Nesseler, K Risse and M Sander for their excellent technical assistance. We thank the four dairy farms for their excellent cooperation. Furthermore, we thank Jessica Olbrich, Renata Piccinini, Gabriel Leitner and Ariel Luis Rivas for critical reading of the manuscript.