Introduction
The allotetraploid (2n = 4x = 28) durum wheat (Triticum durum Desf.) with the genome of AABB was evolved by natural intergeneric hybridization and polyploidization between Triticum urartu (A genome) and a closely related species of Aegilops speltoides (B genome) (Hancock, Reference Hancock2004). Durum wheat is domesticated about 10,000 years ago in the Near Fertile Crescent regions (Blanco, Reference Blanco2024) and is a staple food crop of the Mediterranean regions. It is mainly used for couscous, pasta, macaroni, semolina, burghul and other end-use products (Ebsa et al., Reference Ebsa, Tessoand and Letta2024) in countries like Morocco, Algeria, Tunisia and Libya (West Asian and North African countries) as reported by Royo et al. (Reference Royo, Ammar, Villegas and Soriano2021). After common wheat, durum wheat is the second most prominent wheat species (Martınez-Moreno et al., Reference Martınez-Moreno, Solıs, Noguero, Blanco, Özberk, Nsarellah, Elias, Mylonas and Soriano2020), accounting for about 6.2% of the total wheat cultivated area worldwide and contributing 4.5% of the total wheat production (Blanco, Reference Blanco2024). The increase in world population and preferences towards durum wheat products by consumers creates increased demand for durum wheat in the agricultural markets (Kiran et al., Reference Kiran, Wakeel, Mahmood, Mubaraka and Haefele2022). The shrinkage of the durum wheat gene pool has increased the risk of susceptibility to diseases and pests (Frankel et al., Reference Frankel, Brown and Burdon1995) and adverse climate changes (Aremu, Reference Aremu and Caliskan2012). Thus, the information on the agro-morphological variability is an important step towards the utilization of plant genetic resources in a breeding programme (Marzario et al., Reference Marzario, Sica, Taranto, Fania, Esposito, De-Vita, Gioia and Logozzo2023). The landraces, wild relatives, wild species, genetic stock, advanced breeding material and modern varieties are important plant genetic resources, and these diverse resources have contributed to maintaining sustainable biodiversity (Salgotra and Chauhan, Reference Salgotra and Chauhan2023). These resources represent the source of variation in the durum wheat gene pool; hence, there is a need to reintroduce these resources in the crossing programme to address future challenges. It has been estimated that 84% of the diversity in durum wheat and 69% of the diversity in bread wheat are lost during the domestication process (Mehta et al., Reference Mehta, Arya, Ra Singh and Bisht2019). Integrating landraces into breeding programmes can ensure sustainable wheat production by leveraging their adaptability and resilience (Cheng et al., Reference Cheng, Feng, Wingen, Cheng, Riche, Jiang, Leverington-Waite, Huang, Collier, Orford, Wang, Awal, Barker, O’Hara, Lister, Siluveru, Quiroz-Chávez, Ramírez-González, Bryant and Griffiths2024). Recent studies indicate that assessment of variability of landraces and obsolete cultivars is important as they contain desirable alleles responsible for increasing yield and nutritional traits as well as tolerance to biotic and abiotic stresses (Khalid et al., Reference Khalid, Afzal, Gul, Amir, Subhani, Ahmed, Mahmood, Xia, Rasheed and He2019; Zhao et al., Reference Zhao, Wang, Liu, Zhao, Li, Hou, Zhang and Hao2019; Zhang et al., Reference Zhang, Zhao, He, Kang, Wang, Zhang, Hao, Ma and Chen2021; Chegdali et al., Reference Chegdali, Ouabbou, Essamadi, Dreisigacker and Guzmán2024). Phenotypic trait analysis is frequently employed to evaluate the variability and to study the population structure in durum wheat research (Mengistu et al., Reference Mengistu, Kiros and ME2015; Ouaja et al., Reference Ouaja, Bahri, Aouini, Ferjaoui, Medini, Marcel and Hamza2021; Gadissa and Gudeta, Reference Gadissa and Gudeta2023). Plant breeders are more interested in those traits that influence the end product, while the gene bank curators are more interested in studying the diversity present in a crop. The Shannon–Wiener diversity index is one of the tools to measure diversity in a unifying manner and provides a single value that encapsulates the germplasm richness (number of different trait variations) and evenness (distribution of those variants). It enables the reliable comparison of phenotypic diversity across accessions by minimizing bias when the number of genotypes and traits is sufficiently large and uniformly represented (Phogat et al., Reference Phogat, Kumar, Kumari, Kumar, Pandey, Singh, Kumar, Tyagi, Jacob, Singh, Srinivasan, Jalli, Bisht, Archak, Karale, Sharma, Yadav, Joshi, Mishra, Kumari, Aftab, Gambhir, Gangopadhyay, Rathi, Pal, Sharma, Yadav, Bhatt, Singh, Prasad, Solanki, Singh, Dutta, Yadav, Rana and Bansal2020; Kumari et al., Reference Kumari, RK, Gupta, Honrao, Vaish, Sharma, Ram, Krishnappa, Sharma, Bhardwaj, Jacob, Kumar, Vikas, Pandey, Rana, Kumar, Singh and Singh2024). The characterization of plant genetic resources aids breeders in the identification and utilization of promising donors for various traits in their hybridization programmes. The assessment of qualitative and quantitative traits helps breeders to choose ideal parents and execute hybridization among selected parents (Schut et al., Reference Schut, Qi and Stam1997). Classifying, characterizing and comprehending the relationships between durum wheat breeding materials can be aided by knowledge of their genetic diversity, which can also make it easier to make crosses using various breeding techniques (Soriano et al., Reference Soriano, Villegas, Aranzana, Del-moral and Royo2016). The International Centre for Agricultural Research in Dryland Areas (ICARDA) created a large set of global durum wheat panel (GDP) based on assessment of phenology, disease severity, response to mineral toxicity, etc. (Mazzucotelli et al., Reference Mazzucotelli, Sciara, Mastrangelo, Desiderio, Xu, Faris, Hayden, Tricker, Ozkan, Echenique, Steffenson, Knox, Niane, Udupa, Longin, Marone, Petruzzino, Corneti, Ormanbekova, Pozniak, Roncallo, Mather, Able, Amri, Braun, Ammar, Baum, Cattivelli, Maccaferri, Tuberosa and Bassi2020). However, these lines were not assessed for various agro-morphological DUS (distinctiveness, uniformity and stability) traits. The churning down of the genetic resources in workable manner is also one of the responsibilities of gene bank curators. This can be achieved by the development of a core set using any software, which reduces the redundancy and enhances diversity richness. Power Core software (Kim et al., Reference Kim, Chung, Cho, Ma, Chandrabalan, Gwag and Park2007) is used by Phogat et al. (Reference Phogat, Kumar, Kumari, Kumar, Pandey, Singh, Kumar, Tyagi, Jacob, Singh, Srinivasan, Jalli, Bisht, Archak, Karale, Sharma, Yadav, Joshi, Mishra, Kumari, Aftab, Gambhir, Gangopadhyay, Rathi, Pal, Sharma, Yadav, Bhatt, Singh, Prasad, Solanki, Singh, Dutta, Yadav, Rana and Bansal2020) and Saremi et al. (Reference Saremi, Zeinalabdini, Shabazi, Haravan, Azizinezhad and Sadeghzadeh2024) for the development of core set. In the present paper, the first objective of present paper is to assess the level of agro-morphological variability in the global durum wheat panel (formed by ICARDA) based on 32 studied traits and identification of discriminatory traits for a proper description of accessions. The second objective is to identify genetically diverse accessions by the creation of a core set that can represent the whole variability of the panel.
Materials and methods
Plant materials and field experiment
The ICAR-Indian Institute of Wheat and Barley Research (IIWBR), Karnal, India, received a global durum panel (GDP) from the ICARDA in the year 2021. The panel contained 976 accessions of tetraploid wheat, out of which 752 accessions were of durum wheat. These 752 accessions were sown at the research farm of ICAR-IIWBR located at 29°43ʹN (latitude) and 76°48ʹE (longitude) for two consecutive years (2021–22 and 2022–23). In the first year (2021–22), the data were recorded on 32 agro-morphological traits. In the second year (2022–23), 42 very late-maturing or having less seed quantity accessions were excluded from the study. Thus, the second-year experiment involved only 710 accessions of this panel. These accessions were planted in an augmented complete block design using four durum wheat varieties (PDW291, DDW47, DDW48 and DDW55) as checks. The checks were replicated within a block of 80 entries. Each accession was planted in a three-row plot of 2 m in length with inter- and intra-row spacing of 30 and 10 cm, respectively. In both years, the experiment was sown in the first two weeks of November and harvested in April. A recommended dose of fertilizer was applied, i.e. Nitrogen:Phosphorus:Potassium (N:P:K) at the rate of 120:60:40 kg per hectare, respectively. The doses of N:P:K fertilizers were applied by urea, triple super phosphate and muriate of potash, respectively. Half N and full P and K were applied at the time of sowing as basal dose. While the remaining ½ N was applied in two splits, i.e. first at the crown root initiation stage (21 days after sowing) and second at the booting stage I (45 days after sowing). The crop in every season was irrigated at regular intervals of 20–25 days to raise a healthy crop. Weeds were controlled by hand weeding at two stages: the first stage is 30 days after sowing (DAS) and the second stage is 60 DAS, and the crop was also protected from pests as needed. Each accession was harvested individually at the time of maturity, sun-dried and threshed. The observations were recorded on 32 agro-morphological traits as per brief details given in Table 1 (see full details in Supplementary Table 1).
Name, abbreviation, subclass and their note for 32 agro-morphological DUS traits were recorded in the global durum wheat panel

Statistical analysis
Based on the recorded agro-morphological trait data, a core set was selected from 710 durum wheat accessions using the Power Core software and a heuristic core collection approach (Kim et al., Reference Kim, Chung, Cho, Ma, Chandrabalan, Gwag and Park2007). The collected data were transformed into Microsoft Excel sheet, and the frequency distribution was calculated for each subclass of each trait under study. The Shannon–Wiener diversity index (H′) was calculated for each trait based on the entire set as a single group, core subset, type of breeding materials and geographical origin using the formula given below  $H'=\{\sum_{i=1}^R\text{Pi}(\text{InPi})/\text{ln}(n)\}$ given by Hutchinson (Reference Hutchinson1970). In the formula, n is the number of phenotypic classes for a character and Pi is the proportion of accessions in the i th class of an n-class character. In order to keep the values between zero and one, each value of H′ was divided by its maximum value, ln(n).
Results
Collection of global durum wheat panel
The total number of durum wheat accessions in GDP was 752, although some accessions were excluded from the study due to very late maturity duration or less quantity of seeds obtained, and thus the final count in this set was 710 accessions. This set of GDP involved three types of breeding materials: released cultivars (421 accessions), landraces (205 accessions) and EPO (evolutionary pre-breeding population) lines (84 accessions), and originated from 15 different geographical origins, which are presented in Figure 1 and Supplementary Table 2. The cultivars and landraces mainly originated from West Asia, Spain and Portugal, North Africa, Italy, Horn of Africa, Central Europe, Central Asia, Canada, Balkans, Australia, South Asia and Argentina, while from ICARDA, France and CIMMYT only cultivars originated. The 84 lines of EPO originated from France.
Persentation of numbers and type of accessions and name of geographical origin of global duurm wheat panel.

Frequency distribution of various agro-morphological traits
The frequency distribution in number and proportion in percent (%) for each trait was analysed for the entire set, and the data are presented in Supplementary Table 3. For CCOL, the highest frequency was observed for subclass ‘absent’ (417 and 58.7%), while the lower frequency was observed for subclass ‘present’ (293 and 41.3%). For PGHB, the order of frequency was semi-erect (398 and 56.1%) followed by intermediate (254 and 35.8%), semi-prostrate (29 and 4.1%), erect (27 and 3.8%) and prostrate (2 and 0.3%). For FOLCOL, the highest frequency was observed for dark green (417 and 58.7%) followed by green (186 and 26.2%), and the remaining accessions showed pale green foliage colour. The AURCOL and AURPUB showed high frequency for absent and low frequency for present. Based on FLATT, these durum wheat accessions were classified into three groups, with the highest frequency for semi-erect (503 and 70.9%) followed by erect (169 and 23.8%), and the remaining showed drooping type. In the present study, medium WXFLB, parallel ERSHP, dense ERDEN, presence of Awns, medium AATT, dull white ACOL and ERCOL, absent GLUPUB, elongated GLUSHP, narrow SHLDWID, sloping SHLDSHP, short BKL, moderately curved BKSHP, straight PEDATT, light GPHECOL, angular GRCR, oblong GRSHP, medium GRWID, absent BRL, hard GRTX and absent RABRT were in higher frequency and percent.
Shannon–Wiener diversity index
In the present study, we calculated the Shannon–Wiener diversity index (H′) for 32 agro-morphological traits by considering all accessions as a single group of the entire GDP, and data are presented in Figure 2. The Shannon–Wiener diversity index (H′) based on all accessions as a single group across the traits ranged from 0.02 (GRCT) to 1.27 (WXER) with the overall average value of 0.63. The high H′ (>0.60) was observed for traits, namely CCOL, PGHB, FOLCOL, AURCOL, FLATT, WXFLSH, WXFLB, WXER, WXPED, AATT, SHLDSHP, BKL, BKSHP, PEDATT, GRPHECOL, GRWID, BRL and GRTX. The medium H′ (>0.40 to <0.60) was observed for ACOL, GLUPUB, SHLDWID and GRCOL, while low H′ (<0.40) was observed for AURPUB, WXPL, ERSHP, ERDEN, AP, ERCOL, GLUSHP, GRSHP, GRCR and RABRT.
Shannon-Wiener diversity index for 32 agro-morphological traits in core and entire set.

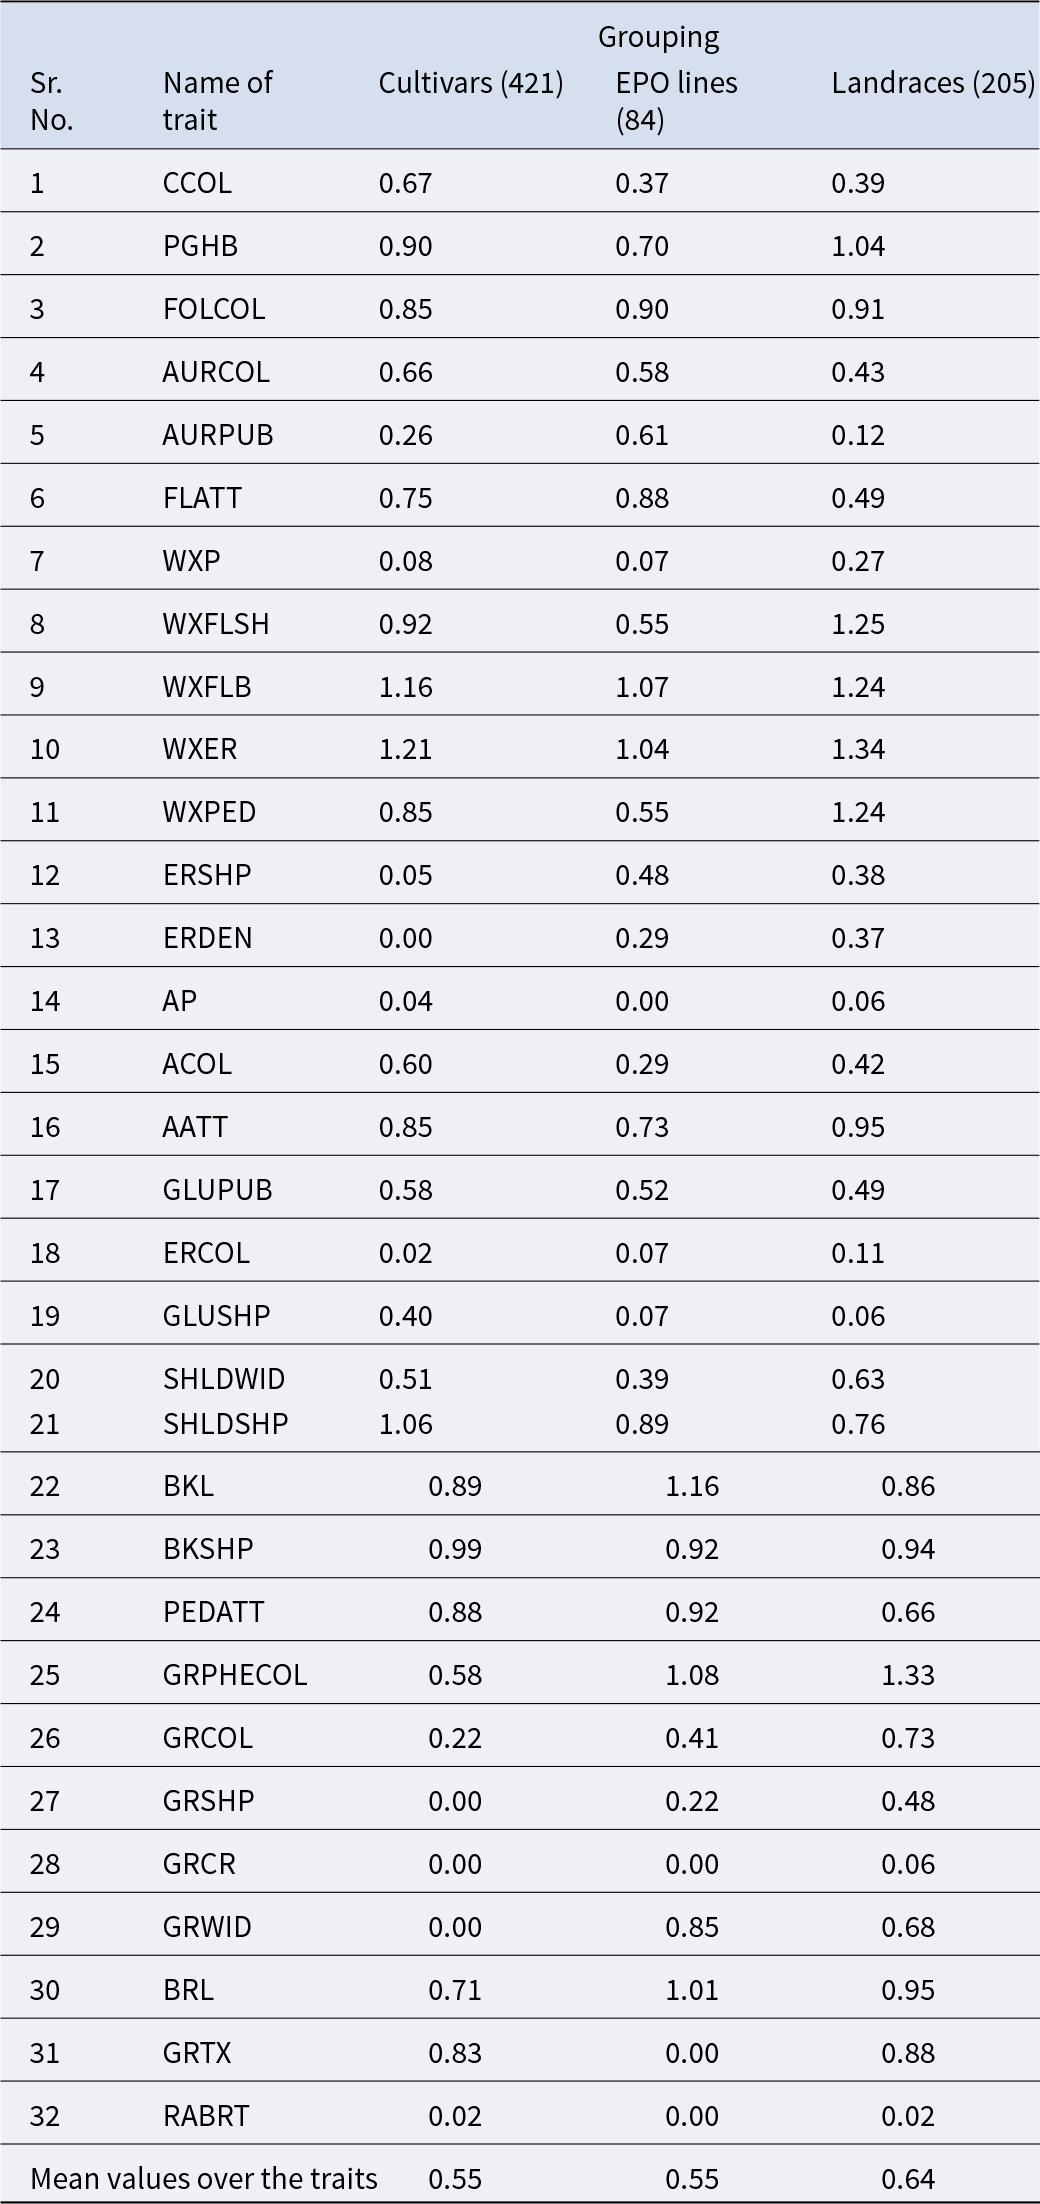
The present GDP includes three types of breeding materials (Cultivars, Landraces and EPO lines), which are collected from 15 different geographical origins from all over the world. Thus, the Shannon–Wiener diversity index was calculated for each type of breeding material, for each trait as well as across the traits (Table 2). The highest variability over the traits was observed in landraces (H′ = 0.64) followed by EPO lines and cultivars (H′ = 0.55). The Shannon–Wiener diversity index showed high variability over the traits in landraces, while medium variability in EPO lines and cultivars. However, low to high variability was observed for each trait in each type of breeding material. High variability in landraces was recorded for PGHB, FOLCOL, WXFLSH, WXFLB, WXER, WXPED, AATT, SHLDWID, SHLDSHP, BKL, BKSHP, PEDATT, GRPHECOL, GRCOL, GRWID, BRL and GRTX. Among cultivars, high variability was observed for CCOL, PGHB, FOLCOL, AURCOL, FLATT, WXFLSH, WXFLB, WXER, WXPED, AATT, SHLDSHP, BKL, BKSHP, PEDATT, BRL and GRTX. In EPO lines, the high variability was recorded for PGHB, AURPUB, FOLCOL, FLATT, WXFLB, WXER, AP, AATT, SHLDSHP, BKL, BKSHP, PEDATT, GRPHECOL, GRWID and BRL. The other traits showed low to medium variability based on the type of breeding materials.
Shannon–Wiener diversity index (H′) values for 32 agro-morphological traits based on the type of breeding materials in the global durum wheat panel

The H′ values for each geographical origin over the traits are presented in Figure 3. Further, the H′ values were calculated for all the 32 agro-morphological DUS traits within each geographical origin and across the traits, and results are presented in Supplementary Table 4. The maximum variability over the traits was observed in the breeding materials originated from West Asia (H′ = 0.63), while the minimum was in the breeding materials originated from CIMMYT (H′ = 0.46). West Asia is the only geographical origin that showed a high variability index over the traits, while the other geographical origins (Italy, North America, Spain and Portugal, Horn of Africa, Central Asia, France, Balkans, South Asia, Canada, Argentina, ICARDA, Central Europe, Australia and CIMMYT) showed medium variability over the traits. Further, a high level of variability (H′ > 0.60) over the geographical origin was observed for PGHB, FOLCOL, FLATT, WXFLSH, WXFLB, WXER, WXPED, AATT, SHLDSHP, BKL, BKSHP, PEDATT, GRPHECOL, GRWID, BRL and GRTX. Medium levels of variability (H′ < 0.40 to >0.60) were observed for CCOL, AURCOL, ACOL, GLUPUB, SHLDWID and GRCOL, while low variability (H′ = <0.40) was observed for AURPUB, WXP, ERSHP, ERDEN, AP, ERCOL, GLUSHP, GRSHP, GRCR and RABRT over the origin. The overall variability over the trait among the accessions as well as across the geographical origins was medium (H′ = 0.55).
Shannon-Wiener diversity index over the traits for different geographical origin in global durum wheat panel.

Development and comparison of the core set and entire set
The development of core set was done using ‘Power Core’ by selecting heuristic core set approach. Therefore, 13 accessions from the entire set of GDP (710 accessions) were able to make the core set, ensuring maximum diversity and minimum redundancy (Supplementary Table 3). Chi-squared (χ2) values were also calculated to assess the degree of deviation between the observed and expected frequency distributions of agro-morphological traits. According to the chi-squared (χ2) values, all the traits showed significant differences except AURCOL, AURPUB, GLUPUB and GRTX between the core set and the entire set of GDP.
The core set extracted from the entire set of GDP consisted of 13 accessions, including cultivars (four accessions), EPO line (one accession) and landraces (eight accessions), which accumulated large variation as per the frequency distribution for various agro-morphological traits (Supplementary Table 3). The core set contained two representative accessions from France, three from North Africa, three from central Asia, along with one accession from each Central Europe, Spain and Portugal, Horn of Africa, ICARDA and South Asia. A heat map of the 32 studied agro-morphological traits in the core set, based on accession type, accession name and geographical origin, is presented in Figure 4. The maximum contribution in the core set was shown by landraces (61.53%) followed by cultivars (30.76%) and EPO lines (7.69%), and the data are presented in Table 3. Accordingly, higher variability was observed in the core set when compared to the entire set as represented by the higher Shannon–Wiener diversity index values (Supplementary Table 5).
A heat map of the 32 studied agro-morphological traits in the core set, based on accession type, accession name, and geographical origin.

Status of entire set and core set developed from the global durum wheat panel

Discussion
The sustainable conservation of durum wheat genetic resources preserved in the gene bank is important for future durum breeding programmes worldwide. The GDP received from ICARDA revealed high agro-morphological variability as indicated by the frequency distribution of each trait, suggesting that this panel contains potential accessions that can be used in future breeding programmes of durum wheat. The range of variability in GDP is due to the diverse germplasm collected from different geographical regions with different genetic compositions (Phogat et al., Reference Phogat, Kumar, Kumari, Kumar, Pandey, Singh, Kumar, Tyagi, Jacob, Singh, Srinivasan, Jalli, Bisht, Archak, Karale, Sharma, Yadav, Joshi, Mishra, Kumari, Aftab, Gambhir, Gangopadhyay, Rathi, Pal, Sharma, Yadav, Bhatt, Singh, Prasad, Solanki, Singh, Dutta, Yadav, Rana and Bansal2020). The dominance of absent CCOL, semi-erect PGHB, absent AURCOL, glabrous AURPUB and semi-erect FLATT was found suitable for the characterization of durum wheat accessions. These results are in concurrence with the earlier findings published by Fraser and Gielier (Reference Fraser and Gielier1935) for CCOL, Verma et al. (Reference Verma, Singh and Panwar2022) for PGHB, Haljak (Reference Haljak2005) for AURCOL and AURPUB, and Shahaji et al. (Reference Shahaji, Srivastava, Sethi, Arya and Bishnoi2020) for FLATT. The frequency of waxiness on different plant parts such as WXP, WXER, WXPED, WXFLB and WXFLSH differed but had representation from all classes of waxiness traits. As a result, these waxiness traits could be used in differentiating the durum wheat accessions. The presence of wax on various plant parts, including ear, peduncle and flag-leaf sheath, serves as a key DUS phenotypic marker for assessing genetic variation in durum wheat, as demonstrated in multi-year field trials (Shahaji et al., Reference Shahaji, Srivastava, Sethi, Arya and Bishnoi2020) and the International Union for the Protection of New Varieties of Plants (UPOV) descriptor-based phenotyping (Marzario et al., Reference Marzario, Sica, Taranto, Fania, Esposito, De-Vita, Gioia and Logozzo2023). However, these waxiness traits are not measurable and are observed visually. Verma et al. (Reference Verma, Singh and Panwar2022) suggested that the ERDEN trait is highly polymorphic and can be used for differentiating wheat varieties. In the present study, the lax ERDEN was not observed in the durum panel and can be considered a rare form in durum wheat. We observed all the subclasses of awns-related traits (AP, AATT and ACOL) and glume-related traits (SHLDWID, SHLDSHP of lower glumes), BKL, BKSHP, GRPHECOL, GRCR, GRSHP, GRWID, BKSHP, GRSHP, GRTX and BRL. These traits showed a high level of polymorphism; hence, these traits are useful in classifying the durum accessions into distinct groups (Shahaji et al., Reference Shahaji, Srivastava, Sethi, Arya and Bishnoi2020; Verma et al., Reference Verma, Singh and Panwar2022). In this study, no variation was observed for RABRT in this durum panel, indicating the mono-morphic nature of this trait. The morphological characters are used for the description of plant species and are always used to distinguish plant varieties (Spanic et al., Reference Spanic, Lalic, Berakovic, Jukic and Varnica2024). When all accessions considered as a single group, the overall variability over the traits was notably high (H′ = 0.63) (Figure 2). Furthermore, high variability in the landraces (H′ = 0.64) is due to the strong selection pressure exhibited in the different geographical regions; thus, the landraces exhibited polymorphism for multiple traits and, hence, have a high Shannon–Wiener diversity index values. In contrast, the low variability in the group of released cultivars and EPO lines may be due to the selection of some desirable traits resulted in the fixation of homozygous genes in most of the accessions during the breeding programme. The descriptor and state in any characterization of genetic resources using the Shannon–Wiener diversity index relate to loci and alleles. Thus, a comprehensive knowledge of variability present in a crop’s gene pool as well as the genetic relationships among germplasm of different geographical origins will aid in creating new cultivars with preferred traits (Dagnaw et al., Reference Dagnaw, Mulugeta, Haileselassie, Geleta and Tesfaye2022). Therefore, those traits that revealed high variability can be used in durum wheat improvement programmes. The differences among various traits based on the Shannon–Wiener diversity index may be due to the inclusion of different types of breeding materials like only landraces, old cultivars, or both.
Further, on the basis of geographical origin, high variability was recorded in accessions originating from West Asia (H′ = 0.63). This may be due to the fact that West Asia has geographical proximity with the Fertile Crescent (where durum wheat originated) and has the maximum alleles. From the Fertile Crescent, durum wheat spread to the Mediterranean region (Italy, Spain and Portugal) and North Africa. These regions had a moderate value of the Shannon–Wiener diversity index, indicating that they have shared allelic diversity (Kabbaj et al., Reference Kabbaj, Sall, Al-Abdallat, Geleta, Amri, Filali-Maltouf, Belkadi, Ortiz and Bassi2017). Thus, wheat landraces collected from these regions are considered prime genetic resources of cultivated durum wheat (Abu-Zaitoun et al., Reference Abu-Zaitoun, Chandrasekhar, Assili, Shtaya, Jamous, Mallah, Nashef, Sela, Alhajaj, Ali-Shtayeh, Peleg, Distelfeld and Ben-David2018). The spread of tetraploid wheat is linked to human migration from the Fertile Crescent regions to reach North Africa (Robbana et al., Reference Robbana, Kehel, Ammar, Guzmán, Naceur and Amri2021). This implies that durum wheat originated in the Fertile Crescent (MacKey, Reference MacKey, Royo, Nachit, Di Fonzo, Araus, Pfeiffer and Slafer2005) and subsequently spread to surrounding regions. Hence, the exchange of crop germplasm played a pivotal role in the development of new wheat varieties. Present findings revealed a high level of variability in accessions of GDP obtained from diverse geographical origins. High to medium variability for various agro-morphological traits by using the Shannon–Wiener diversity index in different sets of durum wheat genotypes belonging to different geographic regions may be due to environmental fluctuation in different geographical regions (Kebebew et al., Reference Kebebew, Tsehaye and Mcneilly2001), or different selection pressure was applied to develop the varieties and EPO lines in different geographical regions. These results suggest the importance of variability within origin and over origin for each trait as well as over the trait in durum wheat.
A core set of 13 accessions was developed using a heuristic core collection approach, representing the overall variability of the entire set of GDP, and contains all the agro-morphological traits. These 13 accessions collected from a wide range of geographical origin, as a result, possess high variability and could hence be used as a potential source of new genes/alleles for the genetic enhancement of durum wheat. The core set developed by the heuristic core collection approach provided 100% coverage for all of the evaluated traits. This core set has only 13 accessions and satisfies our aim for future experiments, and it would also be easier to handle, maintain and examine some of the more nuanced traits. A comparison of variability between the core set and the entire set based on genetic variation parameters revealed that the overall mean values of the Shannon-Wiener diversity index over the traits were higher in the core set (H′ = 0.84) compared to the entire set (H′ = 0.63). These results demonstrate that the developed core set adequately represents the morphological characteristics of the entire set (Supplementary Table 5). The goal of creating the core set is to maximize the allelic richness and represent the variation at phenotypic traits in order to define the smallest possible number of individuals that represent a more compact and manageable population. This approach is useful not only to represent whole genetic variability but also to enquire and identify new sources for interesting traits. This core set has only 13 accessions and satisfies our aim for future experiments, and it would also be easier to handle, maintain and examine some of the more nuanced traits. Therefore, this core set may serve as a useful genetic resource for researchers and help the wheat researcher to utilize the core set in future research programmes.
Conclusions
The global durum wheat panel comprised 710 accessions derived from the ICARDA. These accessions were collected from 15 diverse geographical regions worldwide and represent different genetic backgrounds, including released cultivars, landraces and evolutionary pre-breeding population lines. This panel was used to assess variability in 32 agro-morphological traits following the DUS testing guidelines for durum wheat. Accordingly, the present panel possessed high variability for all studied traits as revealed by the Shannon–Wiener diversity index when considering the entire set as a single group, across the type of breeding material, geographical origin and also within the origin. Furthermore, frequency distribution and the Shannon–Wiener diversity index also showed that the traits, namely coleoptiles colour, plant growth habit, auricle colour and pubescence, flag leaf attitude, ear shape, presence or absence of awns, awns colour and attitude, glumes shape and pubescence, beak length, peduncle attitude, grain phenol colour, grain germ width and brush hair length, were found suitable for characterization of durum wheat accessions. The core set of 13 accessions represented the overall variability of the entire set of global durum wheat panel based on agro-morphological traits and contains all the morphological traits. Also, these 13 accessions belong to a wide range of geographical origins, as a result possess high variability and could hence be used as a potential source of new genes/alleles for the genetic enhancement of durum wheat. The global durum wheat panel developed by ICARDA exhibits a diverse composition for all traits examined. Therefore, this panel may serve as a valuable genetic resource, enabling wheat researchers to utilize it effectively in future breeding and research programmes.
Supplementary material
The supplementary material for this article can be found at https://doi.org/10.1017/S1479262125100208.
Acknowledgements
The authors of this manuscript acknowledge the financial help granted for this study under the project CRP on Agrobiodiversity.
Authors contributions
V.K., P.K., A.G. and R.K.B. conduct field experiments. V.K., P.K. and R.K.B. recorded phenotypic data. P.K., A.G. and R.K.B. perform methodology and also statistical analysis. P.K., A.G. and R.K.B. drafted the first manuscript. A.G., J.K., C.S. and B.S.T. edited and revised the manuscript. A.G., G.P.S., G.S. and R.T. guided and finally reviewed the manuscript. The final submitted version of this manuscript is read and approved by all the authors.
Funding statement
This work was undertaken under a grant for research received from National Bureau of Plant Genetic Resources (NBPGR) under the project CRP on Agrobiodiversity.
Competing interests
The authors declare no competing interests.