Functional magnetic resonance imaging
Functional magnetic resonance imaging (fMRI) is a non-invasive technique that measures changes in blood flow. The fMRI signal depends on blood oxygenation levels (BOLD), i.e. on changes in the concentration of oxy- and deoxy-hemoglobin in the blood, which differentially affect magnetic fields. Therefore, fMRI provides an indirect measure of neuronal activity based on the assumption that local increased energy demands – e.g. during a cognitive task – are associated with increased blood flow. Although there is still a debate on the exact nature and the meaning of BOLD (Arthurs and Boniface, Reference Arthurs and Boniface2002), brain activations with well-defined BOLD signal have been reliably obtained for a variety of brain functions, such as language, movement, hearing and memory.
One of the most prominent cognitive symptoms of Alzheimer's disease (AD) is memory impairment. As medial-temporal lobes (MTL) and hippocampi are the earliest brain regions to show pathological changes in AD, fMRI studies investigating BOLD changes in AD patients have primarily focused on neuronal activity during memory tasks. fMRI studies using memory tasks have consistently shown a reduction in BOLD signal in MTL regions, particularly in the hippocampus and parahippocampal gyrus, in AD patients relative to healthy controls (Sperling, Reference Sperling2007; Schwindt and Black, Reference Schwindt and Black2009). These results have been interpreted as evidence that the memory network involving MTL regions is disrupted by the neurodegenerative processes of AD.
More controversial are the findings showing BOLD changes in AD in other brain areas. fMRI studies in neocortical areas, particularly in frontal and prefrontal brain regions, have reported both increased (Sperling et al., Reference Sperling2003) and decreased (Small et al., Reference Small, Perera, DeLaPaz, Mayeux and Stern1999) BOLD signal relative to controls. While AD-associated BOLD signal reductions have been interpreted as further evidence of memory network disruption, AD-related increases in the BOLD signal or the additional recruitment of brain regions not used by the healthy controls during the task, have been explained in terms of brain mechanisms to compensate for declining function in MTL regions (Prvulovic et al., Reference Prvulovic, van de Ven, Sack, Maurer and Linden2005).
Very few studies have used fMRI to investigate other cognitive domains in AD. BOLD signal abnormalities in AD were observed in motor and visual regions (Buckner et al., Reference Buckner, Snyder, Sanders, Raichle and Morris2000), which are not directly affected by AD in the early stages of the disease. However, due to the small number of studies, these findings require further confirmation.
Other neurodegenerative diseases, such as frontotemporal dementia (FTD), dementia with Lewy bodies (DLB) and vascular dementia (VaD), have been less extensively studied. Reduced BOLD signal in the occipito-temporal region was observed in DLB relative to AD and healthy controls when performing a visual–motion task (Sauer et al., Reference Sauer, ffytche, Ballard, Brown and Howard2006). Similarly, reduced BOLD signal was observed in clusters of regions in the frontal, temporal and cingulate cortices in FTD patients relative to AD during a memory task (Rombouts et al., Reference Rombouts, van Swieten, Pijnenburg, Goekoop, Barkhof and Scheltens2003). However, these findings should be considered preliminary and need further confirmation.
Mild cognitive impairment (MCI) is considered a transitional stage between normal aging and dementia. fMRI studies using memory paradigms have observed increased BOLD signal in MTL regions in MCI relative to both healthy controls and AD patients (Dickerson et al., Reference Dickerson2005; Celone et al., Reference Celone2006; Hamalainen et al., Reference Hamalainen2007; Kircher et al., Reference Kircher2007; Sperling, Reference Sperling2007). These have been interpreted as a compensatory strategy to counteract the pathological processes by recruiting additional neurons. BOLD signal reduction in MTL regions was also reported in MCI patients relative to healthy controls during a memory task (Machulda et al., Reference Machulda2003; Johnson et al., Reference Johnson2006). However, other studies have failed to replicate these results. Methodological issues may explain these inconsistencies: The definition of MCI is very broad, and recruitment of patients with different degrees of impairment, with various types of symptoms and with different age of onset may have confounded the results.
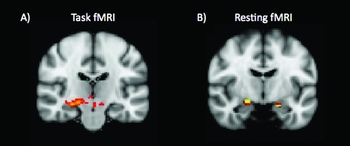
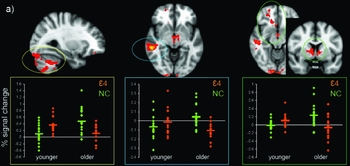
Genes explain between 60% and 80% of the predisposition to develop AD, and the apolipoprotein E (APOE) gene is the best-established risk factor (Li et al., Reference Li2008). APOE has three allelic variants (ɛ2, ɛ3, and ɛ4); the ɛ4 variant has been shown to increase the prevalence and lower the age of onset in AD patients. Functional imaging studies using task-based fMRI paradigms have consistently shown differential effects of the APOE genotype on the BOLD response, with the direction of change depending both on the specifics of the task used and on other AD risk factors (e.g. age and family history) (Trachtenberg et al., Reference Trachtenberg, Filippini and Mackay2010) (Figures 1 and 2). Increased hippocampal BOLD signal in ɛ4 carriers relative to non-carriers is a common feature reported in fMRI studies from early adulthood (Filippini et al., Reference Filippini2009; Dennis et al., Reference Dennis2010), i.e. decades before any cognitive or clinical deterioration (Filbey et al., Reference Filbey, Chen, Sunderland and Cohen2010; Filippini et al., Reference Filippini2011).
Results of analysis of (A) task and (B) resting fMRI. (A) Increased hippocampal activation in 18 younger (20–35 years old) APOE ε4 carriers relative to 18 age-matched non-carriers during an encoding memory task. (B) Default mode network (DMN) comparison between the same two groups revealed increased co-activation in the hippocampal regions in APOE ε4-carriers relative to non-carriers. For both analyses a statistical threshold of p < 0.05 (corrected for multiple comparisons) was used (adapted from Filippini et al., Reference Filippini2009).

Results of task fMRI using an ANOVA approach to investigate the interaction effects between age (younger (20–35 years old) and older (50–78 years old)) and gene (ε4 carriers and non-carriers) factors. In detail, 18 younger ε4 carriers, 18 younger non-carriers, 15 older ε4 carriers and 20 older non-carriers performed a memory task while inside the scanner. The brain regions displayed here show significant interactions between age and gene (p < 0.05 corrected for multiple comparisons). Box plots below each image show BOLD percentage signal change in significant group-related differences. ε4 (orange) refers to ε4 carriers, whereas NC (green) defines non-carriers (adapted from Filippini et al., Reference Filippini2011).

One of the main advantages of resting state fMRI (rs-fMRI) is that it does not rely on any specific task, as a particular task may be difficult for patients with AD or other neurodegenerative disorders to perform. rs-fMRI measures differences in spontaneous fluctuations in resting brain function. Its potential value has been demonstrated in clinical studies (Greicius et al., Reference Greicius, Srivastava, Reiss and Menon2004; Sorg et al., Reference Sorg2007), which confirm that the BOLD signal is a sensitive measure to detect disease-related effects on brain function.
Finally, the possibility of integrating fMRI with other techniques may help to further exploit the clinical potential of the BOLD measure. For example, fMRI combined with amyloid imaging may help to determine whether and to what extent amyloid deposition is associated with alterations in the BOLD signal, and thus directly link BOLD changes to pathological mechanisms.
Magnetic resonance spectroscopy
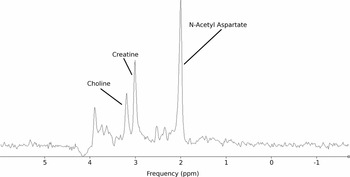
Spatial encoding of brain MRI signals is achieved by artificial magnetic field gradients (B0) across the head, which result in measurably different magnetic resonance frequencies (Larmor frequencies) along the spatial dimension. The law linking magnetic field strength with resonance frequency is also exploited in a different fashion by magnetic resonance spectroscopy (MRS): in a very stable and homogenous field, the molecular environment results in small fluctuations of field strength, which can be measured as slight differences in resonance frequency. While the frequency spectrum generated within a given volume should be a single peak dependent on the generated homogenous field B0, the actual signal appears as a dispersed spectrum, with different peaks attributable to chemical microenvironments, i.e. molecular groups (Figure 3). This effect has been used in analytical chemistry in vitro, but can also be used in vivo, by focusing on a limited brain volume at the time. The technique requires some expertise in “shimming” to generate a very homogenous magnetic field in the scanner and, of course, the appropriate software. While the usual spectra acquired are based on proton (1H) MRS, there are other nuclei, e.g. 13C to examine glutamine neurotransmission, 31P to investigate membrane phosphate-containing compounds, and 17F to label amyloid beta plaques.
Typical PRESS spectrum from a 2 × 2 × 2 cm region. The major neurochemicals N-acetylaspartate (NAA), creatine and choline can be identified as distinct peaks. The amplitude of the peaks is related to the concentration of each of the neurochemicals within the selected region of brain (generously provided by Dr Charlotte Stagg, St Edmund Hall and FMRIB, University of Oxford, UK).

Since Lin et al. (Reference Lin, Tran and Ross2006) reviewed the field and found that “this 15-year-old technique is still considered ‘investigational’ by . . . EBM [evidence based medicine] assessments,” researchers have been able to refer to his following minimum criteria for clinical EBM studies in MRS:
1. prospective study;
2. large patient population (n > 50 or power calculations to demonstrate that the size is sufficient);
3. quantitative analysis;
4. formal criteria for diagnosis (i.e. receiver operating characteristic (ROC));
5. multiple blinded analyses;
6. confirmation of MRS results (i.e. biopsy or outcome measure);
7. provide sensitivity and specificity measures;
8. “added value” diagnostic enhancement over routine CT, MRI, SPECT or PET;
9. examine impact on diagnostic thinking (patient management); and
10. examine impact on choice of therapy.
Unfortunately, but perhaps predictably, the focus of investigations has been mainly on scientifically novel approaches, where “significance” does not mean that a particular MRS measurement can be used to distinguish groups or predict prognosis, but only that patient and control data have not been sampled from the same underlying population, i.e. they can have a wide overlap. One of the largest recent 1H-MRS studies was undertaken by Watanabe et al. (Reference Watanabe, Shiino and Akiguchi2010), who compared 52 healthy controls with 70 AD patients and 47 patients with amnestic MCI (aMCI). They examined three important metabolites: N-acetylaspartate (NAA), myo-inositol (MI) and choline compounds (Cho). NAA is a mainly intraneuronal marker of neuronal density and viability; MI is primarily located in glial cells and is used as a marker of gliosis; and Cho levels may reflect the damaged cholinergic neurons in AD or aMCI (Watanabe et al., Reference Watanabe, Shiino and Akiguchi2010). AD patients had reduced bilateral hippocampal absolute NAA concentrations, with aMCI levels being intermediate between AD and controls. aMCI patients also had reduced concentrations of NAA in bilateral posterior periventricular and deep white matters (PDWM) and posterior cingulate gyrus, and had lower levels of Cho in the left posterior PDWM (Watanabe et al., Reference Watanabe, Shiino and Akiguchi2010). Kantarci et al. (Reference Kantarci2009), in a cumulative study of patients examined at the Mayo Clinic Alzheimer's Disease Research Center and Patient Registry, were able to compare 151 consecutively recruited subjects with MCI. Seventy-five patients with MCI developed dementia during follow-up. The best regression model for the prediction of dementia included age, sex, hippocampal volumes, 1H-MRS NAA/creatine (Cr) ratios in posterior cingulate gyrus, and cortical infarctions. (Cr is related to general metabolism, is assumed to be relatively constant and, given the complications of determining absolute metabolite levels, is often taken as an internal reference value.) The adjusted hazard ratio for NAA/Cr ratios was 1.5 (95% CI 1.0–3.0), so that MRS made a small independent contribution to the prognosis over two years (Kantarci et al., Reference Kantarci2009). Finally, Fayed et al. (Reference Fayed, Davila, Oliveros, Medrano and Castillo2010) examined 33 patients with AD and 54 with MCI. Ratios of NAA/Cr and NAA/MI showed a good correlation with the clinical dementia rating and global deterioration scale (GDS) in both the left occipital cortex and posterior cingulate gyrus, and Cho/Cr a weak correlation with GDS in the left occipital lobe. None of these studies actually used formal quality criteria for diagnosis (e.g. ROC). An interesting treatment study using galantamine was able to show increases of hippocampal glutamate MRS signals in ten AD patients (Penner et al., Reference Penner, Rupsingh, Smith, Wells, Borrie and Bartha2010).
The use of MRS in DLB has been recently reviewed by Watson et al. (Reference Watson, Blamire and O'Brien2009), who concluded: “In summary, some but not all studies found relatively normal NAA/Cr ratios in DLB while in Parkinson's disease dementia (PDD), similar reductions to AD are seen. The differing voxels of interest, comparison groups and small sample size currently limit the generalizability of results.” There may be localized changes in VaD which are different from those found in AD (Jones and Waldman, Reference Jones and Waldman2004), in particular preclinical CADASIL (cerebral autosomal dominant arteriopathy with subcortical infarcts and leukoenceophlopathy) has been associated with lower NAA/Cr values, particularly in the corona radiate, albeit in a relatively small study (Stromillo et al., Reference Stromillo2009). Finally, a study of 61 patients with AIDS dementia complex (stages 1–3) and 39 HIV-positive neurologically asymptomatic individuals suggested that neuropsychological impairment is associated with reduced markers of mature neurons and increased markers of gliosis in the basal ganglia and frontal white matter (Paul et al., Reference Paul2007).
In summary, while the need is clearly recognized for clinical studies that confirm the usefulness of MRS in diagnosis and prediction or monitoring of treatment success, such studies are still lacking.
Diffusion tensor imaging
Diffusion tensor imaging (DTI) is an MRI technique that is increasingly used to analyze white matter (WM) integrity in vivo. DTI measures the diffusion of water molecules in neural tissue and exploits the fact that, within WM, the parallel arrangement of myelinated WM fibers restricts diffusion perpendicular to the WM tract, resulting in anisotropic diffusion. Analysis of DTI data involves fitting a diffusion tensor model at each voxel of the DTI image, with the magnitude and direction of tissue water mobility measured in the x, y and z direction, and the diffusion tensor modeled as an ellipsoid. Diffusion along the major axis of the ellipsoid, λ1, is assumed to reflect diffusivity parallel to the WM tract and is termed axial diffusivity. The two minor axes, λ2 and λ3, can be averaged to compute radial diffusivity, representing diffusion perpendicular to the WM tract. Mean diffusivity (MD) is the average of diffusivity in all three directions and provides a measure of the overall diffusion of molecules. Finally, fractional anisotropy (FA), a ratio of axial to radial diffusivity, provides a measure of the shape of the diffusion ellipsoid. Such DTI metrics can be extracted locally in a priori defined regions using region of interest (ROI) analysis or tractography, or globally using voxel-based analysis (VBA) or tract-based spatial statistics (TBSS).
Results of post-mortem and MRI studies have supported a key role for WM abnormalities in the pathophysiology of AD. Specifically, WM degradation has been hypothesized to result from myelin breakdown in line with the retrogenesis hypothesis (Bartzokis, Reference Bartzokis2004), Wallerian degeneration occurring secondary to gray matter pathology, and also local microvascular changes.
Overall, DTI studies of AD have detected decreased FA and increased MD values in AD compared with controls. In a recent meta-analysis that included 33 case-control ROI or tractography studies of AD, AD was found to be associated with reduced FA and elevated MD values compared with controls in widespread brain regions, including within frontal and temporal white matter, the posterior cingulum, corpus callosum, superior longitudinal fasciculus and uncinate fasciculus (Sexton et al., Reference Sexton, Kalu, Filippini, Mackay and Ebmeier2010a). Furthermore, several studies have reported a significant association between decreased Mini-Mental State Examination (MMSE) scores in AD and reduced FA (Bozzali et al., Reference Bozzali2002; Duan et al., Reference Duan2006; Ukmar et al., Reference Ukmar, Makuc, Onor, Garbin, Trevisiol and Cova2008; Mielke et al., Reference Mielke2009) or increased MD (Bozzali et al., Reference Bozzali2002; Duan et al., Reference Duan2006), indicating that DTI metrics may be sensitive markers of disease progression.
In contrast to the growing number of case-control studies of AD, few studies have used DTI to investigate changes brought about by other types of dementia, e.g. DLB, VaD and FTD. As with studies of AD, those of other dementias generally report reduced FA and elevated MD in patients compared with healthy controls. Importantly though, differences have also been detected between different types of dementias, indicating that DTI metrics may have potential as biomarkers used to distinguish different types of dementia.
In VaD, WM degradation appears mostly to affect the anterior parts of the corpus callosum (Zarei et al., Reference Zarei2009). Also, significantly lower FA and higher MD values have been detected in VaD patients compared with AD patients in the posterior periventricular area (Chen et al., Reference Chen2009).
In DLB, reductions in FA and increases in MD compared with healthy controls have been reported in the inferior longitudinal fasciculus (Ota et al., Reference Ota2009; Kantarci et al., Reference Kantarci2010) and in frontal, occipital and parietal white matter (Bozzali et al., Reference Bozzali2005). Differences between AD and DLB patients have been found in the posterior cingulum, with MD elevated in the AD group compared with both control and DLB groups (Kantarci et al., Reference Kantarci2010). There are also several tracts that might be useful to differentiate DLB and PDD. Compared with PDD patients, FA in patients with DLB was significantly lower in bilateral posterior temporal, posterior cingulum and bilateral visual association fibers extending into occipital areas (Lee et al., Reference Lee2010).
In FTD, the differences in FA between patients and healthy controls are mainly found in the anterior cingulate, uncinate fasciculus and superior longitudinal fasciculus (Whitwell et al., Reference Whitwell2010). In comparison with AD, WM degradation is increased in FTD patients and found especially in frontal WM tracts, including the anterior cingulum, anterior corpus callosum and uncinate fasciculus (Zhang et al., Reference Zhang2009).
However, it is important to note that most of the studies of other dementias were limited to pre-selected ROI. This type of analysis is insensitive to changes in WM integrity outside of the ROI. Additionally, it is difficult to compare the changes brought about by the different type of dementias because, to date, studies have concentrated on one or two types of dementia only.
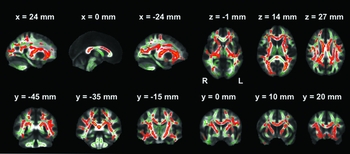
Alterations in WM have also been found in people at higher risk of developing AD, including those with MCI and the ε4 allelic variant of the APOE gene. A meta-analysis of 21 case-control studies of MCI found that differences between MCI and controls paralleled the differences between AD and controls, but fewer regions reached statistical significance (Sexton et al., Reference Sexton, Kalu, Filippini, Mackay and Ebmeier2010a). As with AD, several studies have reported a significant association between decreased MMSE and reduced FA in MCI (Ukmar et al., Reference Ukmar, Makuc, Onor, Garbin, Trevisiol and Cova2008; Bai et al., Reference Bai2009; Mielke et al., Reference Mielke2009;). Furthermore, hippocampal MD has been found to be superior to hippocampal volumes in predicting conversion from MCI to dementia (Fellgiebel et al., Reference Fellgiebel2004). The ε4 allelic variant of the APOE gene is associated with higher risk of developing both early- and late-onset AD, and age-related cognitive impairment. Several studies have reported effects of the APOE ε4 allele on WM integrity in brain tracts, such as the parahippocampal WM (Honea et al., Reference Honea, Vidoni, Harsha and Burns2009) and the corpus callosum (Smith et al., Reference Smith2010). Furthermore, a recent whole-brain tract-based spatial statistics (TBSS) analysis showed reduced FA in widespread WM tracts of the brain (Figure 4). This effect is already present in young APOE ε4 carriers aged 20–35 years and remains relatively stable throughout adulthood (Heise et al., Reference Heise, Filippini, Ebmeier and Mackay2010).
Whole-brain mean fractional anisotropy (FA) images that show the results of a TBSS analysis described by Heise et al. (Reference Heise, Filippini, Ebmeier and Mackay2010). White matter integrity differences between carriers of the APOE ε4 allele and non-carriers were found in a group of 34 healthy young subjects aged 20–35 years. The investigated tracts, called mean FA skeleton, are shown in green. The red color indicates tracts where FA was significantly decreased in APOE ε4 carriers compared to non-carriers (p < 0.05 corrected for multiple comparisons).

Overall, DTI has proved to be a sensitive technique to detect group differences between various dementias, at-risk groups and control groups. However, before translation to the clinic would be possible, further studies are needed in order to better characterize the anatomy of WM abnormalities, especially in dementias other than AD. This is complicated by the fact that a priori distinctions between different types of dementia (e.g. VaD and AD) are not always straightforward. Additionally, it is unclear if it is important to differentiate between disease severity or disease subtypes, e.g. of FTD. Furthermore, more standardized ways of acquiring and analyzing DTI data are required. Indeed, results of meta-analyses have indicated that both patient characteristics (MMSE, age, and percentage of women) and acquisition parameters (b value, voxel size, number of directions, number of excitations) contribute to the significant heterogeneity observed between studies (Sexton et al., Reference Sexton, Kalu, Filippini, Mackay and Ebmeier2010a). Also, it is not yet clear which DTI metric is the most sensitive measure of WM degradation in dementia. Although FA is the most commonly used DTI metric, it lacks sensitivity when diffusivity in all three directions displays similar changes. For example, MD has been found to be more sensitive than FA in detecting group differences between AD and control participants (Acosta-Cabronero et al., Reference Acosta-Cabronero, Williams, Pengas and Nestor2010), and in reflecting decline in MMSE (Nakata et al., Reference Nakata2009) and episodic memory (Sexton et al., Reference Sexton2010b).
Conflict of interest
KPE has received payment from IPA for several GE-sponsored workshops on “Neuroimaging in Dementia”.
Description of the authors' roles
NF wrote the first draft of the section on “Functional magnetic resonance imaging”; KPE on “Magnetic resonance spectroscopy”; and VHS and CES on “Diffusion tensor imaging”. All authors contributed to further drafts and the final version of the paper.
Acknowledgments
The authors acknowledge the Alzheimer Research UK (KPE, VH) and Gordon Edward Small Charitable Trust (KPE, NF, CES) for financial support.