INTRODUCTION
In the Mediterranean basin, most wheat (and barley) is cultivated in rainfed conditions. Mediterranean wheat is exposed to water stress of varying severity due to scarce and variable rainfall. The Mediterranean conditions for wheat production represent a risky scenario where farmers’ yields are uncertain, but frequently rather low (Acevedo et al., Reference Acevedo, Silva, Silva, Solar, Satorre and Slafer1999; Anderson, Reference Anderson1985a; Cooper et al., Reference Cooper, Gregory, Tully and Harris1987a; Kopp, Reference Kopp1981; López-Bellido, Reference López-Bellido and Pearson1992; Loss and Siddique, Reference Loss and Siddique1994; Sadras, Reference Sadras2002; Yankovitch, Reference Yankovitch1956). Sadras et al. (Reference Sadras, Roget and Krause2003) analysed the response of Australian dryland wheat to contrasting cropping strategies for various locations across years with variable rainfall (these strategies were either conservative, reducing economic losses in dry seasons, or risky, increasing benefits in wet seasons). The conservative strategy seemed more profitable in years with low water availability, but it was less profitable in wet seasons.
In the past 20 years nitrogen fertilization has become the most useful management practice to increase grain yield of cereal crops in other regions with Mediterranean weather (Angus, Reference Angus2001; Passioura, Reference Passioura2002). As water is intrinsically limited in Mediterranean systems, nitrogen (N) fertilization has been shown to increase either water capture and/or water use efficiency under rainfed conditions. However, within the Mediterranean Basin region, differences in response to N fertilization were reported depending on the seasonal rainfall (Anderson, Reference Anderson1985b; Reference Andersonc). For the Mediterranean region of Australia, French and Shultz (Reference French and Schultz1984a; Reference French and Schultzb) reported increments in wheat yield when crops were fertilized by improving the use efficiency of available water. These increments may have been due mainly to the positive effect of N fertilization on reductions of water losses by direct evaporation, increased growth during the winter period (decreasing the evaporation-to-transpiration ratio) or to higher capture of soil water due to an improved root system (Cooper et al., Reference Cooper, Gregory, Tully and Harris1987a; Reference Cooper, Gregory, Keatinge and Brownb). On the other hand, in some Mediterranean environments N fertilization might produce an adverse effect on the grain yield from rainfed wheat, known as ‘haying-off’ (van Herwaarden et al., Reference van Herwaarden, Angus, Richards and Farquhar1998). However, evidence for yield penalties is not often reported outside Eastern Australia. The occurrence of ‘haying-off’ does not seem to be common even in Western Australia (Asseng and van Herwaarden, Reference Asseng and van Herwaarden2003; Asseng et al., Reference Asseng, Keating, Fillery, Gregory, Borden, Turner, Palta and Abrecht1998; Palta and Fillery, Reference Palta and Fillery1995), one of the main Mediterranean wheat production regions of the globe. For the Mediterranean Basin region, Keatinge et al. (Reference Keatinge, Neate and Shepherd1985) reported a decreased grain weight and increased water stress as a consequence of N fertilization, but reductions in grain weight were compensated in yield by the increased number of grains in response to N. It is known that in most cases (Mediterranean and non-Mediterranean environments), reductions in grain weight are due to an increased number of grains in the distal positions of the spike or secondary tiller spikes (Acreche and Slafer, Reference Acreche and Slafer2006; Miralles and Slafer, Reference Miralles and Slafer1995).
The amounts of N fertilization in the wheat-growing regions of the Mediterranean Basin vary widely. The range has been broadly described from zero in the low-rainfall areas of Morocco to 120 kg N ha−1 in Spain on durum wheat crops in high-rainfall areas (López-Bellido, Reference López-Bellido and Pearson1992). These widely variable amounts reflect a difference between the risk aversion of farmers in the European and North African areas of the Mediterranean Basin. The more-conservative strategy followed in most of the rainfed wheat regions of North Africa is translated into relatively low levels of productivity. Cooper et al. (Reference Cooper, Gregory, Keatinge and Brown1987b) reported that fewer than 15% of barley growers use N fertilization in northern Syria, and as a consequence this has led to a decline in soil fertility. In fact, it is not uncommon that rainfed cereals are grown year after year under N deficiency in the West Asia and North Africa (WANA) region in general (e.g. Mossedaq and Smith, Reference Mossedaq and Smith1994; Oweis et al., Reference Oweis, Pala and Ryan1998; Ryan, Reference Ryan2000; Reference Ryan2008), and in Tunisia in particular (Latiri, Reference Latiri, Ceña, Gallardo, Elloumi and Sai2005). The conditions in North Africa cannot be extrapolated from those in Europe due to the differences in subsidies to crop production and the frequent integration in Europe of intensive animal production and cropping systems, with the regular use of animal wastes as organic fertilizer. However, the experience of non-subsidised Australian farmers (Passioura, Reference Passioura2002) suggests that mineral N-fertilization might overcome part of the yield penalties imposed by the Mediterranean climate in North African rainfed cereal production. Similarly, N fertilization has also been reported (from either results of experiments or outputs of simulation models) to be a valuable tool to increase grain yield in the WANA region (Cooper et al., Reference Cooper, Gregory, Tully and Harris1987a; Garabet et al., Reference Garabet, Wood and Ryan1998; Harmsen, Reference Harmsen1984; Oweis et al., Reference Oweis, Pala and Ryan1998; Pala et al., Reference Pala, Stockle and Harris1996; Pilbeam et al., Reference Pilbeam, Wood, Harris and Tuladhar1998; Ryan, Reference Ryan2008; Ryan et al., Reference Ryan, Abdel Monem, Shroyer, El Bouhssini and Nachit1998; Reference Ryan, Ibrikci, Sommer and McNeill2009). Most of the new information regarding the WANA region has been generated since 1977 as a consequence of the establishment of the International Center for Agricultural Research in the Dry Areas (ICARDA) in Syria, and additionally to its collaborative research with other national research institutes. However, the attitude of farmers in Mediterranean Australian regions (who increasingly use fertilization systematically to raise yields in the severely water stressed conditions of their crops) differs from that of farmers in North Africa, who are mostly reluctant to use such a tool. These different attitudes most likely reflect different socioeconomic conditions in which the farmers operate or show the different degree of confidence in the extrapolation of results from field experiments and simulation exercises to realistic farm conditions.
In North Africa, limited confidence in transferring the results of field experiments to farm practice may be expected as there is limited research done within this region and it is less comprehensive than the studies carried out in Australia. Farms are far more complex and have more intrinsic variability than the capacity of most field experiments, and this is particularly so when they are conducted on research stations that are frequently under lower stress variability than the nearby working farms. The inclusion of farmers in the experimentation allows for an improved targeting of technology and viable technology assessment (Ashby and Sperling, Reference Ashby and Sperling1995). However, while it is apparently known that management practices offer options to achieve more efficient nutrient use in the WANA region, the lack of inclusion of local farmers might explain why such practices are hardly ever applied (Ryan, Reference Ryan2008).
A European research project of co-operation with Mediterranean partner countries (WatNitMED) was aimed, among other things, at analysing the degree of N-nutrition deficiencies that may be behind low wheat productivity in the region, rather than focusing on water stress alone. Based on experimental results from several locations and years, a fertilization scheme was proposed. In the present paper, we report the results of an experiment conducted on working farms in two rainfed regions in Tunisia. We aimed to analyse whether the positive response of grain yield to N fertilization observed in field experiments can be achieved on farms by up-scaling and transferring the knowledge from field experiments to a farm pilot experiment.
For this purpose, the yield response to N fertilization was analysed using two different comparisons: (i) the effect of N fertilization on wheat yield compared to the unfertilized conditions and (ii) the response to N fertilization doses considered optimal by farmers v. those from a fertilization scheme proposed from WatNitMED.
MATERIALS AND METHODS
The experiment was carried out at two locations with different weather conditions in Tunisia: Béja (sub-humid) and Siliana (semi-arid). In each case, the responses of three different N fertilization strategies for durum wheat in farmer fields were compared (9 fields in Béja, and 11 fields in Siliana). The experiment was carried out using cultivars of durum wheat selected by farmers for their fields, and using their machinery and their crop management practices with the exception of N fertilization.
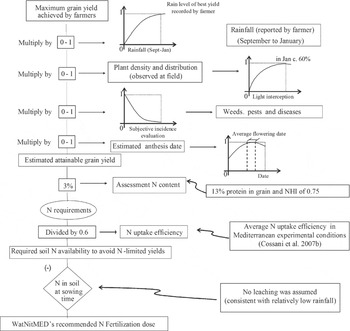
The different N fertilization treatments consisted of an unfertilized control, fertilization determined freely by each farmer as the optimum for their fields and quantities of fertilizer derived from the WatNitMED recommendation. The WatNitMED recommended scheme was determined with experimental results from previous years across the Mediterranean Basin as set out by WatNitMED partners at the Third General Meeting of the project (Marrakech, October 2007). The scheme involved the postponement of decisions regarding N fertilization to the tillering stage when both: (i) the characteristics of the early part of the growing season and (ii) the structure of the crop canopy were already known. At that time, each individual field was visited and a fertilizer dose was decided in each case based on: (i) the maximum achievable yield expected in that field and (ii) the likely attainable yield by considering the rainfall from September to January of the current season compared to the wettest seasons for that period as recorded by the farmers, as well as the agronomic condition of the crop (Figure 1). We estimated a yield (with all the above mentioned elements) that would be achieved if N did not limit growth. Then we estimated how much N the crop should take up to avoid N-limiting yields assuming a ‘standard’ protein percentage in grains and nitrogen harvest index. A value for N uptake efficiency similar to average values previously reported for other Mediterranean sites (Albrizio et al., Reference Albrizio, Todorovic, Matic and Stellacci2010; César de Carvalho, Reference César de Carvalho2009; Cossani et al., Reference Cossani, Savin, Slafer, Bosch, Teira and Villar2007a) was used to decide the soil N levels needed to satisfy the expected requirements. Finally, the fertilizer dose was calculated in consideration of the difference between these requirements and soil N availability (Figure 1).
Scheme of the procedure used for N recommendation in each of the 20 fields in which the experiment was carried out (for details see text). NHI: nitrogen harvest index.

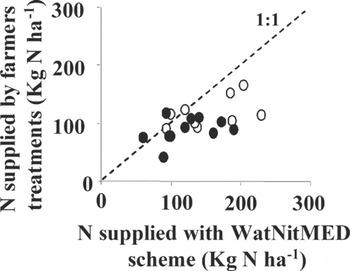
Fields were visited from 29 January to 1 February 2008 to determine the amount of fertilizer to be derived from the WatNitMED scheme. Farmers were requested to fertilize their fields as they would have done in the absence of this experiment. However, most of them seemed to have fertilized more than usual, after learning about the recommendations from the project. Nevertheless, in both regions the WatNitMED recommended dose was higher than the levels selected by most of the farmers (Figure 2).
Comparison of N-fertilization rates applied by farmers and those derived from WatNitMED. Open and closed symbols represent Béja (relatively high-yielding region) and Siliana (relatively low-yielding region) fields, respectively.

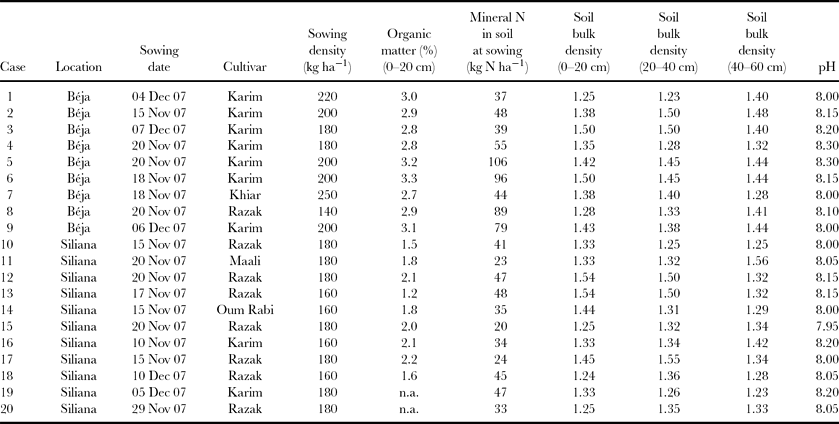
Sowing date and density, cultivars grown, initial soil N, organic matter content and bulk density of soil are summarized in Table 1 for each field. The cultivars Karim and Razak were the most popular cultivars used in 78% and 64% of cases at Béja and Siliana, respectively.
Crop information for all the experimental cases at sowing time and soil properties.
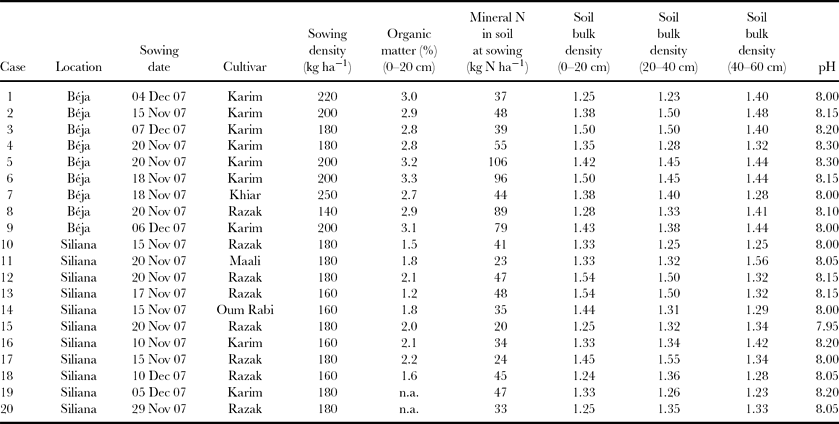
Note: Mineral N in soil at sowing represent N availability at 60 cm depth.
Experimental units consisted of a sub-division of farmer fields into large plots of 0.5 ha, with each of the treatments assigned randomly. Unfortunately, despite the same explicit instructions to all farmers, some of them did not strictly follow the scheme and did not leave an unfertilized half-hectare. All in all, there were 11 fields with all three treatments while the other 9 fields only had the farmers’ treatments and the WatNitMED's fertilization schemes. Immediately before sowing, soil samples were taken to determine the soil N content of each field (Table 1).
Because of limitations in the infrastructure for collecting, transporting and processing the field samples, only two samples of 1 m2 of aboveground biomass were taken at maturity per experimental unit. Grain yield, yield components and straw yield were then determined. As straw has a market value in Tunisia, to have a realistic overall measure of the response to treatments, we calculated for each plot a combined grain and straw yield (total yield). The combined yield was calculated by weighting the physical yield of the straw by the ratio of prices of straw and grain. Thus, a total yield was estimated that represents the overall marketable yield in terms of grain-equivalent yield thus:

Averaging across the previous five years (2004–08), the market price of the straw in Tunisia was 0.4 of the price of grain.
Following this, grains and shoots were milled and the N concentration in them was measured using the micro-Kjeldahl methodology.
A one-tailed paired t-test was used to test if N fertilization, per se, significantly increased grain yield, straw yield and total yield with respect to the unfertilized conditions and to assess if the WatNitMED recommendation produced higher grain, straw and total yield than the treatment that farmers’ considered optimal N fertilization.
RESULTS
Weather conditions
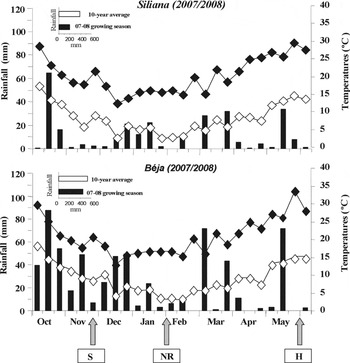
As expected, the two Tunisian regions differed significantly in their environmental conditions during the growing season, particularly in total rainfall. While in Siliana rainfall from November 2007 to June 2008 was only 198 mm, in Béja it was 448 mm. In both locations, rainfall distribution was typically Mediterranean with approximately 70% of the rainfall occurring before 1 April. Total rainfall from November to June was below the average for the previous 10 years in both locations, although the difference was greater in Siliana than in Béja (Figure 3). In both sites, average minimum temperatures were higher than 0 °C during the whole growing season, while average maximum temperatures reached more than 30 °C at the end of May.
Accumulated precipitation (bars), average maximum (closed symbols) and minimum (open symbols) temperatures for periods of 10 days during the growing season. Timing of sowing (S), N-fertilization recommendation (NR) and harvest (H) (they were similar for both locations) are indicated. Inset is the comparison of the accumulated precipitation for the whole growing season (November–June) showing average of the last 10 years (open bars) and that for the experimental growing season (closed bars).

Yield and components
Unfertilized grain yield across both locations ranged from about 1 to 3.5 Mg ha−1, whilst the range widened when fertilized to more than 7 Mg ha−1. The average yield in Siliana was 1.6 Mg ha−1 lower than in Béja.
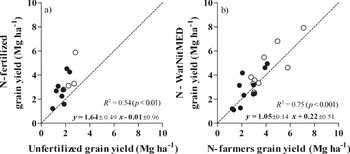
N fertilization has consistently increased grain yield (mean difference 1.21 Mg ha−1, p < 0.005). The magnitude of the increase was related to the background condition: the slope of the relationship in Figure 4a was significantly (p < 0.05) higher than 1. Therefore, the higher the unfertilized yield the larger the crop responsiveness to N fertilization (Figure 4a). The fertilization recommendation produced by the WatNitMED treatment also showed an overall trend towards higher yields than the farmers’ optimal fertilization rate (mean difference 0.39 Mg ha−1, p < 0.05). As the slope in Figure 4b was not significantly higher than 1, there was not a consistent change in crop responsiveness (WatNitMED v. farmer optimal doses) with the conditions of the site. Consequently, the slight advantage of fertilizing at a higher level than the farmers’ optimal dose was not restricted to Béja (the relatively high-yielding region) but was also evident in Siliana (Figure 4b).
Relationships between grain yields of (a) fertilized (average of the two fertilization treatments, farmers and WatNitMED) and unfertilized fields, and (b) fields receiving fertilization rates derived from the WatNitMED scheme and farmer fertilization. Open and closed symbols represent Béja and Siliana fields, respectively. The dashed line stands for the 1:1 ratio.

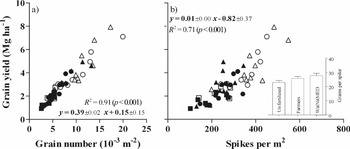
Even though, the weather was typically Mediterranean, with low rainfall after anthesis, grain yield was positively and directly related to grain number per unit land area in all the treatments at both locations (Figure 5a). The average grain weight did not show a clear relationship with grain yield. The number of spikes per unit land area was the main sub-component explaining N effects and location differences in the number of grains per m2. Therefore, grain yield was well related to the number of spikes per m2 (Figure 5b).
Relationship between grain yields and either (a) grain number or (b) spikes number per unit land area for unfertilized (squares), farmer treatments (circles) and WatNitMED treatments (triangles). Open and closed symbols represent Béja and Siliana fields, respectively. Inset of panel (b) is the average grains per spike of both locations, with their respective standard errors of the means.

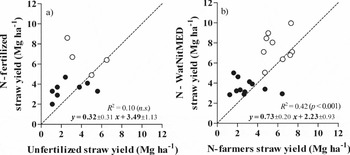
Fertilized plots had 1.5 Mg ha−1 higher (p < 0.05) straw yields than unfertilized plots (Figure 6a). The differences between fertilized and unfertilized plots in straw yield were greater in Béja than in Siliana. The comparison between the two fertilization schemes (farmers and WatNitMED) showed that the straw yield obtained after the N-WatNitMED recommendation was 1.02 Mg ha−1 higher (p < 0.05) (Figure 6b).
Relationships between straw yields of (a) fertilized (average of the two fertilization treatments, farmers and WatNitMED) and unfertilized fields and (b) fields receiving fertilization rates derived from the WatNitMED scheme and farmer fertilization. Open and closed symbols represent Béja and Siliana fields, respectively. The dashed line stands for the 1:1 ratio.

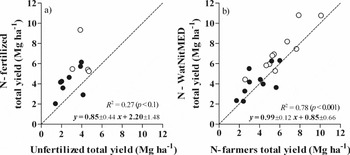
If the analysis of yield is performed including the yields of grain plus straw (the latter weighted by the ratio of the straw to grain prices), it can be observed that total yield of the unfertilized fields was clearly lower (mean difference 1.71 Mg ha−1, p < 0.005) than the fertilized plots (Figure 7a). The total yield of wheat fertilized according to the N-WatNitMED recommendation was higher than under the farmers’ fertilization regime. The mean difference was statistically significant (0.8 Mg ha−1, p < 0.005) and in most cases the WatNitMED data points were above the 1:1 ratio (Figure 7b).
Relationships between total yield (grain yield + straw yield × 0.4) of (a) fertilized (average of the two fertilization treatments, farmers and WatNitMED) and unfertilized fields and (b) fields receiving fertilization rates derived from the WatNitMED scheme and farmer fertilization. Open and closed symbols represent Béja and Siliana fields, respectively. The dashed line stands for the 1:1 ratio.

Nitrogen uptake and N utilization efficiency
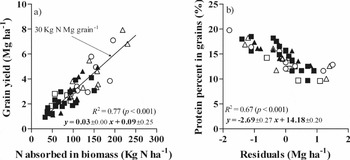
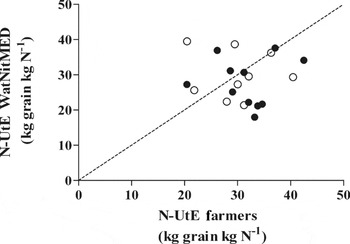
Nitrogen uptake was significantly (R 2 = 0.77; p < 0.001) and positively related to grain yield (and biomass at maturity) across all treatments and locations. As was expected, N uptake increased with the amount of N supplied. In general, crops receiving WatNitMED fertilization had higher amounts of absorbed N (averaging across conditions 122 kg N ha−1) than treatments representing farmers’ fertilization (106 kg N ha−1), and the difference became larger when WatNitMED treatments were compared to unfertilized treatments (65 kg N ha−1). Differences in N absorption were behind the responsiveness to fertilization (Figure 8a). There were no significant differences (p > 0.05) between farmers’ and WatNitMED treatments in terms of N utilization efficiency (N-UtE) (Figure 9).
Relationship between (a) grain yield and N absorbed at maturity and (b) grain protein concentration and the residuals of the relationship between actual grain yield and grain yield expected with a certain amount of N absorbed with a conversion efficiency of 30 Kg N per Mg grain−1 for unfertilized (squares), farmer fertilization (circles) or WatNitMED fertilization (triangles). Open and closed symbols represent Béja and Siliana fields, respectively.

Relationship between N utilization efficiency (N-UtE) of farmer fertilizations and N utilization efficiency of WatNitMED fertilizations. Open and closed symbols represent Béja and Siliana fields respectively. The dashed line stands for the 1:1 ratio.

The protein percentage of grains was higher percentage in Siliana (14.7%) than in Béja (13.9%). Protein percentages differed between unfertilized (11.4%) and fertilized treatments (c.13.5%) in Béja while differences between treatments were less noticeable in Siliana (range 14.2–15.2%). The protein percentage was explained by the residuals of the relationship between the observed grain yield and the grain yield expected with the same N uptake and an N conversion of 30 kg N Mggrain−1 (Figure 8b).
DISCUSSION
Despite the difficulties in carrying out the experiment (e.g. convincing farmers to apply the recommended N rate in the WatNitMED treatments; the withdrawal by some farmers of some of the treatments; the relatively small sample size), the pilot experiment produced results with similar trends to those observed in standard experimental or simulated conditions across the WANA region (Cooper et al., Reference Cooper, Gregory, Tully and Harris1987a; Reference Cooper, Gregory, Keatinge and Brownb; Garabet et al., Reference Garabet, Wood and Ryan1998; Harmsen, Reference Harmsen1984; Oweis et al., Reference Oweis, Pala and Ryan1998; Reference Oweis, Pala and Ryan1999; Pala et al., Reference Pala, Stockle and Harris1996) and other Mediterranean regions (Spain, Italy) used as the basis for the design of the fertilization scheme. This study reinforces knowledge about N fertilization generated at different scales across the Mediterranean Basin (Abeledo et al., Reference Abeledo, Savin and Slafer2008; Albrizio et al., Reference Albrizio, Todorovic, Matic and Stellacci2010; Cabrera-Bosquet et al., Reference Cabrera-Bosquet, Albrizio, Araus and Nogués2009; Cossani et al., Reference Cossani, Slafer and Savin2009).
Similar to the reported cases from Australia (Passioura, Reference Passioura2002), the low yields that are normally achieved in the rainfed wheat systems of North Africa would be associated, at least partially, with N limitations, especially if cereals are not fertilized, which is commonly the case in the WANA region (Heng et al., Reference Heng, Asseng, Mejahed and Rusan2007; Mossedaq and Smith, Reference Mossedaq and Smith1994; Oweis et al., Reference Oweis, Pala and Ryan1998). The clear yield advantages for most of the fertilized treatments supports the hypothesis and suggests that in most cases, farmers who do not fertilize their wheat crops in Tunisia are missing an opportunity to improve their productivity, even in relatively low-yielding regions for rainfed wheat such as Siliana.
In most cases WatNitMED treatments produced yield advantages over the optimal doses of N decided by farmers in their fields. The advantage was small but significant, and the difference might have been higher if the farmers had fertilized their fields at the usual rates, rather than with quantities they regarded as optimal. There are several reasons for speculating that the N amounts these farmers normally use would have been lower than their optimal selections. The main reason is that when the farmers were previously surveyed, before agreeing to run the experiment in their fields, the amounts of N fertilizer used were approximately 20 kg N ha−1 lower than the amounts applied in the experiment (average amount applied 100.17 kg N ha−1 v. 80 kg N ha−1 previously reported by farmers) (Thabet et al., Reference Thabet, Chebil and Elouaer2006). Because farmers themselves applied the fertilizer doses suggested by the WatNitMED project, they learnt the recommended dose for WatNitMED treatments before applying their normal amounts of N, and were probably influenced by this and raised the N fertilization to get closer to that ‘recommended’ from the WatNitMED scheme. Thus, the general view of the relative advantage of the WatNitMED treatment used compared to the farmers’ treatment was minimized, and for many of the farmers in the region (particularly in Siliana) the comparison that more truly reflects the reality is the one with the unfertilized crops.
Variability in grain yield was based mainly on the responsiveness of the number of grains per m2, which in turn was a consequence of the improved number of spikes per m2. As crops were fertilized at the end of tillering stage, it seems clear that the main response of N fertilization was the reduction in tiller mortality, thus determining greater numbers of spike-bearing tillers per unit land area (Baethgen et al., Reference Baethgen, Christianson and Lamothe1995; Prystupa et al., Reference Prystupa, Slafer and Savin2003). In addition, this finding was complemented by an increase in grains per spike that was likely due to increases in floret survival due to fertilizer application (Ferrante et al., Reference Ferrante, Savin and Slafer2010). Similarly, results from experiments in Morocco showed that fertilizing with N increased grain number per m2, which was accounted for by increased spikes per m2 and increased grains per spike (Mossedaq and Smith, Reference Mossedaq and Smith1994).
The fact that yield differences were tightly linked to the number of grains per m2, even under Mediterranean conditions, is in line with evidence reported from the experimental conditions of the WatNitMED project (e.g. Albrizio et al., Reference Albrizio, Todorovic, Matic and Stellacci2010; Cossani et al., Reference Cossani, Savin and Slafer2007b; Reference Cossani, Slafer and Savin2009). In addition, this agrees with the view that grain growth in wheat, after the number of grains has been set, proceeds under low or no competition for carbohydrates (e.g. Acreche and Slafer, Reference Acreche and Slafer2009; Cartelle et al., Reference Cartelle, Pedró, Savin and Slafer2006) similarly to the case of non-Mediterranean conditions (Borrás et al., Reference Borrás, Slafer and Otegui2004 and several references quoted therein; Slafer and Savin, Reference Slafer and Savin1994).
Because straw has a market value in Tunisia (as in other countries of the Mediterranean region), the analysis of crop responsiveness to N must take into consideration the yield of not only grain, but also crop residues. In addition to the observed yield response to N fertilization, straw yield for the fertilized plots was also increased, highlighting the advantage of fertilizer treatments (on average across fields there was 1.58 Mg ha−1 more straw in fertilized than in unfertilized crops; equivalent to an extra earning of about 130 € ha−1, using the mean straw price for the past five years in Tunisia). In addition, the WatNitMED treatment produced an advantage in straw yield over the farmers’ treatment, representing an extra income equivalent to about 85 € ha−1.
In the present pilot experiment, we focused on up-scaling the experiments to conditions experienced by farmers so as to quantify the increase in yield of rainfed wheat in Tunisia without a direct focus on grain quality. However, it was clear that in cases where yield did not strongly respond to applications of fertilizer, there was compensation through an improvement in grain quality. This further reinforces the recommendation that farmers in this region should avoid growing wheat continuously without using fertilizer.
Beyond accepting the implicit hypothesis that wheat yield is N-limited if fields are not fertilized, even in a Mediterranean rainfed system, the WatNitMED project delivered a tool that proved useful in two contrasting regions of Tunisia. The use of crop management guides such as decision schemes, like the one used in the present study or simulation models (Abeledo et al., Reference Abeledo, Savin and Slafer2008; Asseng et al., Reference Asseng, Milroy and Poole2008), is critical for optimizing wheat yield under the dryland Mediterranean conditions of North Africa. Despite the higher yield achieved following the recommendation based on WatNitMed treatment, it should be noted with caution that the present paper attempts only to report a single pilot experiment (the only trial we could conduct within the funding scheme available). The main limitation of the present work is that it is only based on one growing season (although unfertilized yields resembled closely ‘normal’ yields in the region). Thus, this work is not intended to provide quantitative tools in terms of recommended doses, but to simply illustrate that up-scaling from field experiments to working farms managed by their farmers seems appropriate because we found similar results at the farm level to those observed in experimental conditions. In Mediterranean regions, fertilization should not only be used far more widely than currently, but the scheme used by farmers to maximize yields should also be rethought: even the levels that our farmers regarded as optimal fertilizer doses would likely be insufficient for achievable yields. If tested further on a national level, or in other WANA regions, the scheme used in this pilot experiment (illustrated in Figure 1) might be adopted as an easy tool to determine fertilization doses in the region.
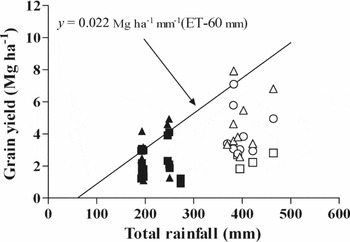
N fertilization allowed increases in grain yield through improvements in the use of limiting resources by the crops. N fertilization increased water use efficiency (WUE) at least in terms of rainfall use (Figure 10). The response of WUE to N fertilization coincides with the observations in the classic papers by French and Shultz (Reference French and Schultz1984a; Reference French and Schultzb). The improved WUE could have been mediated by an earlier soil cover reducing direct evaporation and increasing crop growth during the cold winter months (Cooper et al., Reference Cooper, Gregory, Tully and Harris1987a; Passioura, Reference Passioura2006; Passioura and Angus, Reference Passioura and Angus2010).
Grain yield as a function of the total rainfall during the growing season for unfertilized treatments (squares), farmer fertilization (circles) treatments and WatNitMED fertilization (triangles). Open and closed symbols represent Béja and Siliana fields respectively. Solid line represents the upper water use efficiency threshold as defined by Sadras and Angus (2006).

In conclusion, N fertilization analysed in field conditions normally encountered by farmers proved to be a useful strategic farm management tool to increase wheat yield and productivity in rainfed Mediterranean Tunisia. The use of a scheme accounting for crop status as well as environmental and management conditions resulted in an additional yield and biomass productivity beyond the levels attained by the N management schemes considered optimal by farmers.
Acknowledgements
We thank the 20 farmers from UTAP (Union Tunisienne de l'Agriculture et de la Pêche) for their participation in the study. This work was supported by WatNitMED, an INCO-Project of the European Union. CMC initially held a scholarship from WatNitMED and later a PhD scholarship from the Comissionat per a Universitats i Recerca del DIUE de la Generalitat de Catalunya i del Fons Social Europeu.