

INTRODUCTION
During the last century in The Netherlands, milk production per cow has almost tripled. Accordingly, the amount of concentrates fed annually per cow has increased markedly. Furthermore, automation and robotization have changed dairy management, especially through the introduction of automatic concentrate feeders and milking systems (Bieleman Reference Bieleman2005, Reference Bieleman2008). A new management concept that has emerged in recent decades is precision livestock farming (PLF). The objective of PLF is to optimize livestock production by online monitoring and control of the production process, utilizing the technical possibilities of automation and robotization (Cox Reference Cox2002). PLF is an embryonic technology with great promise, but one that requires considerable research and development before uptake (Wathes et al. Reference Wathes, Kristensen, Aerts and Berckmans2008). Wathes et al. (Reference Wathes, Kristensen, Aerts and Berckmans2008) state that the new technology to be developed should consist of integrated monitoring and control systems for biological processes. Monitoring and control systems are already successfully implemented for industrial processes that can usually be controlled effectively, because the objects are inanimate and predictable and the targets can be defined precisely and set independently of time and weather. In contrast, biological processes are more difficult to control because they are inherently more variable due to differences between individuals, and dynamic changes through age, reproduction and environment. Moreover, livestock producers are only prepared to adopt new technology when there is sound economic justification to do so (Frost et al. Reference Frost, Schofield, Beaulah, Mottram, Lines and Wathes1997).
Within dairy farming, the use of automated concentrate feeders and milking systems is increasing, enabling the use of individual daily setting of concentrate intake and milking interval. Although current settings are based on knowledge about energy and nutrient requirements in relation to milk production, they do not account for variation between and within individual dairy cows. André et al. (Reference André, Berentsen, van Duinkerken, Engel and Oude Lansink2010a, Reference André, Berentsen, Engel, de Koning and Oude Lansinkb) found considerable variation in milk yield in response to concentrate intake and milking interval length among individual dairy cows and concluded that individual variation in response can be exploited to improve economic profitability of dairy farming by optimization of individual feeding, enhancing utilization of automatic milking systems (AMSs). They recommended an individual dynamic approach to utilize the individual variation in response within management decision support systems for dairy farming.
Milk yield response to concentrate intake depends on stage of lactation. Woods et al. (Reference Woods, Kilpatrick and Gordon2003) developed models that predict the response in milk yield to metabolizable energy intake with reasonable precision in vivo. However, there are various physiological factors that complicate attempts to model milk yield response to changes in (net) energy and/or nutrient intake during lactation. Ingvartsen & Andersen (Reference Ingvartsen and Andersen2000) reviewed and summarized changes in hormones and tissues during pregnancy and lactation that affect the response. Van Knegsel et al. (Reference Van Knegsel, Van den Brand, Dijkstra, Tamminga and Kemp2005) analysed milk yield response to energy intake, especially in early lactation. During lactation, net energy partitioning shifts away from milk yield towards retention of net energy in body reserves (Van Knegsel et al. Reference Van Knegsel, De Vries Reilingh, Meulenberg, Van den Brand, Dijkstra, Kemp and Parmentier2007a, Reference Van Knegsel, Van den Brand, Dijkstra, Van Straalen, Jorritsma, Tamminga and Kempb). Ingvartsen & Andersen (Reference Ingvartsen and Andersen2000) and Garnsworthy et al. (Reference Garnsworthy, Lock, Mann, Sinclair and Webb2008a, Reference Garnsworthy, Lock, Mann, Sinclair and Webbb) studied the influence of pregnancy on energy partitioning. Because of these physiological factors, in general, milk yield response to concentrate intake is highest in early lactation and decreases towards the end of lactation. In addition, there are the unpredictable causes for changes in the actual response in milk yield due to, e.g. mastitis or lameness.
Within a dynamic approach, historical outcomes of the production process are analysed in order to estimate the actual response to the control variables. Time series analysis of daily milk yield and online recursive estimation during the lactation has been applied in several studies. A Bayesian approach was applied by Goodall & Sprevak (Reference Goodall and Sprevak1985) to estimate the parameters of the Wood-curve (Wood Reference Wood1967) early in lactation. DeLuyker et al. (Reference DeLuyker, Shumway, Wecker, Azari and Weaver1990) applied time series analysis to provide short-term forecasts for daily milk yield. Lark et al. (Reference Lark, Nielsen and Mottram1999) applied time series analysis for monitoring milk yield for detection of a disease (e.g. ketosis). De Mol et al. (Reference de Mol, Keen, Kroeze and Achten1999) combined time series analysis of daily milk yield with a Kalman filter for detection of oestrus and diseases, considering also milk temperature and electrical conductivity. Bebber et al. (Reference van Bebber, Reinsch, Junge and Kalm1999) introduced a recursive mixed model for monitoring milk yield at group and individual levels. The focus of the models used in the aforementioned studies was either on long-term forecasts of milk yield, e.g. for early estimation of the whole lactation curve, or on short-term forecasts, for monitoring and detection purposes. However, the models used in the studies mentioned above did not estimate actual individual response in milk yield on concentrate intake and interval length. The present authors consider such information vital to obtain optimal individual settings for concentrate supply and milking frequency on a daily base.
In the present study, time series of daily milk yield of individual cows are analysed following a Bayesian approach, using dynamic models proposed by West & Harrison (Reference West and Harrison1997). A dynamic model consists of an observation and a system equation. The observation equation is a linear regression model describing the relation between milk yield and concentrate intake and milking interval length. However, in contrast to ordinary regression models, the parameters in the observation equation are time dependent. Thus, dynamic models have the advantage of being more flexible in accounting for changes in response during lactation.
The objective of the present study is the development of an adaptive dynamic model for online estimation of the actual response in milk yield to concentrate intake and milking interval length, in order to determine economically optimal settings for concentrate supply and milking frequency.
Initially, two dynamic models will be presented that can be considered as first- and second-order Taylor approximations (linear and quadratic approximations) of a more intricate nonlinear model describing the underlying mechanistic and physiologic concepts of milk production such as the model presented by France & Thornley (Reference France and Thornley1984). A third model is derived by applying constraints on the parameters of the quadratic model.
Secondly, the predicted responses of these three adaptive models will be evaluated, with particular attention for the quality of the parameter estimates, because this relates to the choice of proper optimal settings for concentrate supply and milking interval.
Thirdly, the usefulness of the models for monitoring of daily milk production is evaluated.
MATERIALS AND METHODS
Modelling milk yield response to concentrate intake and milking interval
Milk yield per milking depends on the time between the starts of two consecutive milkings, i.e. upon the interval length I (in days). France & Thornley (Reference France and Thornley1984) described the process of milk secretion using a mechanistic model in which at the start of a milking interval (I=0) the rate of milk secretion (kg/day) by the alveoli in the udder is maximal.
The milk secretion rate approaches zero when the amount of milk M m (kg) in the udder approaches the maximum udder capacity M max (kg). The milk secretion rate depends on the number of active alveoli and the energy status of the cow (Vetharaniam et al. Reference Vetharaniam, Davis, Upsdell, Kolver and Pleasants2003). Therefore, the maximum milk secretion rate can be regarded as a function of feed intake. Feed intake consists of roughage and concentrates. Roughage intake, usually unknown, defines the intercept and the response on concentrate intake C (kg/day) will be curvilinear, following the law of diminishing returns (Broster & Thomas Reference Broster, Thomas and Haresign1981). Milk yield per milking is obtained by integration:

Because nonlinear system equations are difficult to handle, Eqn (1) is linearized by Taylor expansion around I=i 0 and C=c 0, the second-order approximation being M m≈α 0+α 1C+α 2I+α 3C 2+α 4I 2+α 5CI. Note that the first-order approximation consists of the first three terms. Imposing the constraint that M m=0 at I=0, implies that α 0=α 1=α 3=0. But then the quadratic effect of concentrate would be lost and for that reason André et al. (Reference André, Ouweltjes, Zom, Bleumer and Cox2007) added a third-order term α 6C 2I to the constrained model.
The realized milk yield per day M d (kg/day) is achieved by accumulation of the milk yields per milking over the number N of milkings per day. The following response models for milk yield per day will be considered:


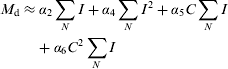
The first- and second-order Taylor approximations, in Eqns (2) and (3), will be referred to as model T1 and T2, respectively. The enhanced model (EM) in Eqn (4) will be referred to as model EM. Usually, when all the milkings in a day are successful, the sum of the interval lengths  day, and therefore α 2 is regarded as the intercept and the other parameters as regression coefficients for the effects of concentrate intake and milking interval length on milk yield.
In models T1, T2 and EM, only the response to one diet component, i.e. compound concentrate, is estimated. The models can be easily extended to allow for more diet components, e.g. roughage or an extra concentrate component. However, it should be taken into account that an increase in diet components in the model, and thereby in the number of model parameters, will also increase the risks of multi-collinearity. This is especially the case when applying additive models such as quadratic response surfaces, where each extra term results in at least two extra parameters.
Dynamic model and online time series analysis
So far, the linear models T1, T2 and EM represent the situation at some moment during the lactation without any dynamics yet. T1, T2 and EM are made dynamic by allowing their parameters to be time dependent. This involves an observation equation and a system equation. The observation equation describes the relationship between milk yield and concentrate intake and milking interval length as in Eqns (2)–(4), but with time-dependent parameters (α.t instead of α.), and an added random error term with an associated observational variance. The system equation describes the dynamic change of the parameters. The present research focuses on short-term forecasting. Therefore, the coefficients are assumed to be locally constant: current coefficients equal coefficients of the day before plus independent random error terms (a random walk) with an associated system variance. Technical details are provided in Appendix I, following West & Harrison (Reference West and Harrison1997).
The time series of individual accumulated daily milk yields is analysed online, following a Bayesian approach. The philosophy of Bayesian statistics (Gelman et al. Reference Gelman, Carlin, Stern and Rubin1995) encompasses the idea that information (in research) is constantly updated (from one experiment to another). This is reflected by the use of a prior distribution that summarizes current knowledge, based on observations from the past. When new data are collected, the information in the data is combined with the information in the prior, leading to a new distribution: the posterior distribution. The posterior is an up-to-date summary of the current and past information. The posterior will become the new prior in any subsequent calculations, when new data are collected. The analysis starts with an initial prior distribution for the parameters. This process of prior, plus data, becoming the posterior, where the posterior is the new prior for subsequent calculations, makes Bayesian statistics eminently suitable for monitoring purposes. Thus, within time series analysis, Bayesian statistics are applied as a way of sequential learning.
Discount factors allow for additional uncertainty when the posterior information from the last time point evolves into prior information for the next time point: basically by making the new prior somewhat wider than the last posterior. In this way, the system is able to discount information from the past, and to adapt to the present situation. A high discount factor (close to 1) implies a slow decay of information, such that the online parameter estimates are based on a long series of observations from the past and by consequence the dynamic change of the parameters (system variance) is low. A low discount factor (close to 0) would imply the opposite, where almost nothing from the past is retained. West & Harrison (Reference West and Harrison1997) recommend the use of values between 0·8 and 1·0 for the discount factors, with the value for the regression part of the model being somewhat higher than for the intercept; accordingly, values of 0·95 and 0·975 were used for the intercept and the regression parameters, respectively, in the present study. The observation variance is estimated in an adaptive way from the forecast errors with a discount factor for variance learning of 0·9. More details about the dynamic system and the use of discount factors may be found in West & Harrison (Reference West and Harrison1997).
Monitoring followed by automatic intervention
The discrepancy between forecast and observation is judged by the Bayes’ factor, expressing the likelihood that the observation fits into the actual routinely used model relative to an alternative and exceptional outlier model with an observation variance three times higher. When the Bayes’ factor is lower than 0·15, the observation is classified as a potential outlier. Additionally, a cumulative Bayes’ factor and a run length are calculated, to detect deteriorations in the series that are more gradually introduced. When the cumulative Bayes’ factor is lower than 0·15 or the run length is higher than three, a signal for deterioration is given. Potential outliers are discarded when parameter estimates are updated. After detection of a potential outlier or after a signal for deterioration, automatic intervention is carried out by applying once-only exceptional discount factors. The exceptional discount factors are lower than those used routinely (0·8 for intercept, 0·9 for regression parameters and 0·8 for variance learning), allowing the system to adapt more quickly to possible changes in the process.
Assessment of model adequacy and retrospective analysis
Model adequacy, in terms of goodness of fit of the models, is evaluated using the standardized forecast errors and calculation of the root-mean-squared error, the log likelihood and the autocorrelation between successive forecast errors. The forecast error is the difference between the observation and the forecast and is standardized by dividing the forecast error by the square root of the forecast variance. The goodness-of-fit measures mainly relate to the forecast performance of the models. However, the quality of the online parameter estimates needs careful scrutiny as well, because these are used to calculate optimal settings of concentrate supply and milking frequency in the actual situation. The online parameter estimates, based on observations in the past only, are compared with retrospective parameter estimates. The retrospective parameter estimates are based on information from the whole series and can be used as reference for the online estimates. Details on online and retrospective estimation of the parameters can be found in West & Harrison (Reference West and Harrison1997).
Potential problems due to multi-collinearity, such as inflated variances of and/or high correlation between parameter estimates, are assessed by calculation of the condition number of the correlation matrix of the online parameters estimates (Montgomery & Peck Reference Montgomery and Peck1982). The condition number is always greater than 1 and a high condition, greater than 30, is considered evidence for inflated variance and/or high correlation.
The appropriateness of the model for monitoring is also assessed by judgment of the forecast errors. Deviating forecast errors are classified as potential outlier or yield a signal, as explained before, the other errors are classified as normal. Results of this classification are discussed to assess the appropriateness for an alert system to the farmer.
Data
The data set consists of time series of 238–310 daily observations of daily accumulated milk yield, milking interval length and concentrate intake from 15 cows. Daily concentrate intake is calculated as the moving average of the intakes of the current day and 2 days earlier. A moving average is used to reduce day-to-day variation in intake and to account for a delay in response in milk yield. The 15 cows selected were those with a lactation length of more than 200 days from calving, taken from a herd of 66 cows. A summary of the results over the whole time series will be given for the 15 selected cows that calved in the period February–April 2006. To clarify details of the analysis, daily results will be given for one randomly selected cow. The time series for this cow starts at day 22 and ends at day 260 after calving. In total, there are 238 observations, because one observation is missing at day 170. Milking frequency was on average 3·26 milkings/day (s.d.=0·80). Daily concentrate intake (kg/day) for this cow during the lactation is displayed in Fig. 1.
Daily concentrate intake (kg/day) during lactation (DIM) for the randomly selected cow.

Farm situation: feeding and milking
Data used in the present study were collected by André et al. (Reference André, Ouweltjes, Zom, Bleumer and Cox2007) during the development and testing of a prototype for dynamic feeding and milking on a research farm in The Netherlands. The research farm was equipped with a robotic milking system and a robotic feeding system for individual feeding of roughage−concentrate mixtures and an automatic concentrate feeder. On average, this farm had 66 Holstein Friesian cows in milk, with an average milk yield of 29·8 kg/day and an average milking frequency of 2·5 times/day. The cows were milked with a single unit Lely Astronaut® AMS and remain indoors year round. Individual milking start time, milking duration and milk yield were recorded at each milking. The AMS was equipped with manufacturer software (T4C management system, Lely, Rotterdam, The Netherlands) to determine whether cows visiting the milking unit should be milked or not. In this software, production level, days in lactation and parity were the main criteria to determine preferred settings for milking permit. Fixed interval thresholds were set for fetching; cows with prolonged milking intervals were fetched 3 times/day.
Cows were individually fed with roughage−concentrate mixtures using an Atlantis® robotic feeder (Lely, Rotterdam, The Netherlands). The diet consisted of maize silage, grass silage and soybean meal, supplemented with commercial compound concentrates. Between 10 days prepartum and 90 days postpartum the ratio between maize silage, grass silage and soybean meal was 13:4:3 on a dry matter basis. Beyond 90 days in milk (DIM), the proportions of maize silage and soybean meal in the ration were gradually reduced to zero in the last trimester of the lactation, depending on the development of body condition. The cows were given unrestricted access to the robotic feeder, and so the intake of concentrate–roughage mixture was ad libitum. Feed intake was recorded individually at each meal. Most of the concentrates were fed individually in the AMS and automatic concentrate feeder, and so the mixtures contained only small amounts of concentrates.
RESULTS AND DISCUSSION
First, the forecasting performance of the models T1, T2 and EM will be evaluated. The models describe daily milk yield as a two-dimensional response surface on concentrate intake and milking interval length. The estimated response parameters are input for a control algorithm that calculates the daily individual optimal settings for concentrate supply and milking interval. Next, the quality of the estimated response parameters will be evaluated by evaluation of the predicted responses. Finally, detection of outliers and other deteriorations that can be used for monitoring will be evaluated.
Evaluating the forecasting performance
For models T1, T2 and EM, observations and forecasts with P<0·10 are given in Fig. 2.
Milk yield (kg/day) during lactation (DIM) for models T1, T2 and EM. Observations (points), forecasts (centre line) and 90% probability interval (upper and lower lines), for the randomly selected cow.

The graphs show that most of the observations lie within P<0·10 for all models. All models provide reasonable forecasts during the lactation, but the forecasts of model T2 show more variation from day to day than the forecasts in models T1 and EM. There are large changes in level of the forecasts of model T2, and the probability interval of the forecasts also shows occasional substantial increases. This suggests that model T2 adapts too fast.
Standardized forecast errors are displayed in Fig. 3 and normal errors, potential outliers and signals for deterioration are indicated.
Standardized forecast errors v. DIM for models T1, T2 and EM. Normal error (.), potential outlier (×) and signal for deterioration (+).

The majority of the normal errors lie between ±2 and 3 are no trends indicating lack of fit. Most errors deviating by more than twice the average are classified as potential outliers. Note that there are relatively more negative outliers; these are caused by interrupted and incomplete milkings.
Table 1 shows characteristics and statistics for the goodness of fit for the different models.
Average goodness-of-fit statistics for the different models based on the results of 15 cows. The range over the 15 cows is given in parentheses

The observations are classified as potential outlier or signal for deterioration based on the forecast errors. Model EM shows a lower proportion of deviating observations than models T1 and T2. The root-mean- squared error of model T2 is higher than the root mean-squared error of models T1 and EM. Model T1 shows the highest log likelihood and model T2 the lowest. The lowest log likelihood and highest root-mean-squared error for model T2 indicate that model T2 fits worse than models T1 and EM. The autocorrelation of successive forecast errors is low for all models. The negative correlation of model T2 and EM suggests that these models adapt too quickly. In contrast, it appears that model T1 adapts too slowly.
Figure 4 shows the estimated observation variance during lactation for the randomly selected cow. The results from models T1 and EM show that the observation variance during the middle part of the lactation is higher than in begin and end of the lactation. This suggests that the observation variance depends on production level.
Estimated observation variance during lactation (DIM) for models T1, T2 and EM, for the randomly selected cow.

The estimated observation variance is higher in model T1 and lower in model T2 than in model EM. In other words, in models T1 and EM, a relatively greater part of the random variation is attributed to the observation variance than to the system variance of the model parameters. This relates to the stochastic change in the parameters and the rate of adaptation of the models; models T1 and EM are adapting slower than model T2.
Evaluation of the predicted responses
Parameter α 0 in models T1 and T2 represents the linear effect of the number of milkings per day on accumulated daily milk yield, but during almost the entire lactation the estimates of this parameter are not significantly different from zero. Parameter α 1 in models T1 and T2 represents the linear effect of concentrate intake in relation to the number of milkings and this effect is positive and increasing during lactation. As mentioned before, parameter α 2 in models T1, T2 and EM, is practically an intercept. The development of the online and retrospective parameter estimates of α 2 during lactation is illustrated in parallel in Fig. 5 for the randomly selected cow. The retrospective estimates are based on information of the whole series, observations from the past as well from the future, while online parameter estimates incorporate only information from past observations.
Development of the estimated intercept during lactation (DIM), parameter α 2 in models T1, T2 and EM, for the randomly selected cow. Online (points), retrospective (centre line) and 90% confidence interval of the retrospective parameter estimates (lower and upper lines).

Figure 5 reflects the lactation curve, although the typical shape of a lactation curve is less apparent for model T2 where estimates tends to be less precise.
Parameter α 3, representing the quadratic effect of concentrate intake in relation to the number of milkings in model T2, is significant and negative in the second part of the lactation. Parameter α 4, representing the quadratic effect of interval length on accumulated daily milk yield in model T2 and EM, is poorly estimated in model T2. Parameter α 5, representing the linear effect of concentrate intake in relation to accumulated interval length in model T2 and EM, is mostly insignificant in model T2. Parameter α 6, representing the quadratic effect of concentrate intake in relation to accumulated interval length in model EM, is negative during almost the entire lactation. This implies convex curvature, which agrees with the law of diminishing returns. However, the curvature diminishes and its precision decreases towards the end of lactation.
The effects of interval length and concentrate intake on daily milk yield are partitioned over different terms in model T1 and T2; consequently, the parameters are difficult to interpret or to compare with the parameters of model EM. In contrast, the parameters α 4, α 5 and α 6 of model EM can be interpreted as the interval sensitivity, and the linear and quadratic effects of concentrate intake, respectively. The development of these parameters is shown in Fig. 6.
Development of parameter estimates α 4, α 5 and α 6 during lactation (DIM) in model EM, for the randomly selected cow. Online (points), retrospective (centre line) and 90% confidence interval of the retrospective parameter estimates (lower and upper lines).

Some of the parameters, especially in model T2, show relatively a low precision. Differences between the online and retrospective estimates occur in model T1: parameter α 1; in model T2: parameters α 0,1,4 and in model EM: parameter α 4. Using the retrospective estimates as reference, because they are based on information from the whole series, a great difference with the online estimates suggests bias in the online parameter estimates.
The quality of the parameter estimates can also be assessed from their variance covariance matrix. A low quality, caused by a high variance and/or correlation, is reflected by a high condition number (Montgomery & Peck Reference Montgomery and Peck1982). The condition numbers of the correlation matrix on day 50, 100, 150, 200 and 250 in lactation are given in Table 2 for the different models.
Averaged condition numbers of the correlation matrix of the parameter estimates for models T1, T2 and EM, including the range for the 15 cows in parentheses

The condition numbers increase during lactation. The lowest values are found for model T1. For model T2, condition numbers are extremely high. Hence, particularly in model T2, the parameter estimates are strongly correlated. This multi-collinearity is due to relationships between the regression variables in the model. In this data set, regression variables are the realized concentrate intakes and milking intervals that depend on the behaviour of a cow in the on-farm situation. Settings for concentrate supply and interval length are not controlled as in experimental testing following an experimental design that pursues orthogonality. In a practical setting, multi-collinearity may arise naturally from the nature of non-experimental data. Moreover, in the practical situation, settings are changed only moderately to avoid negative consequences for the cows’ performance, thereby complicating the estimation of the response on concentrate intake and milking interval. Together, these aspects not only hamper the estimation of the parameters but also complicate the interpretation on the basis of estimated parameter values. Multi-collinearity can be dealt with in a sensible way by changing to a sparser adaptive model, as is achieved with model EM relative to model T2. Model T1 has the smallest number of parameters and lowest condition numbers, but provides no information about the curvature of the response.
In Fig. 7, the predicted response in milk yield on concentrate is given for the different models at 50, 100, 150, 200 and 250 days in lactation. In early lactation, concentrate supply was directed to achieve maximum milk yield per day. The predicted response from model EM at 50 days in lactation shows that the maximum milk yield is reached at c. 15 kg concentrate per day, but models T1 and T2 show a higher response. Later in lactation, concentrate supply was lowered towards an economic optimum where the marginal milk returns equal the marginal costs of concentrate, i.e. dM/dC=0·5 according to a milk price of 0·30 €/kg and a concentrate price of 0·15 €/kg. From Fig. 7, it can be seen that the slope, i.e. the marginal response to concentrate intake based on model EM, is c. 0·50 kg milk/kg concentrates at days 150, 200 and 250 in lactation. At day 100, the marginal response is somewhere between the economic optimum and the maximum milk yield.
Estimated response curve of daily milk yield (kg/day, Y-axes) for one cow milked 2·85 times/day on concentrate intake (kg, X-axes) at 50, 100, 150, 200 and 250 DIM for models T1 (solid line), T2 (dashed line) and EM (dotted line).

Because the milk yield response on concentrate intake follows the law of diminishing returns, convex curves are expected for model T2 and EM. Hence, the parameters α 3 in model T2 and α 6 in model EM should be negative. However, α 3 in model T2 is positive at c. 50 DIM and α 6 in model EM is positive at c. 250 DIM. So, the response curve is concave and an optimum for concentrate supply is not defined. Therefore, advice for the increase or decrease of supply must be based on the first derivative of the estimated response curve. Note that this also applies to model T1 where only the linear effect is estimated.
The predicted responses based on model T1 and EM correspond well and are in agreement with the expectation that the response decreases during lactation. However, the predicted response by model T2 is clearly different and not in agreement with the expectations according to the stage of lactation. During the period of maximum milk yield, from 100 to 150 DIM, the response is mainly negative, while at the end of lactation the curvature seems to be severely overestimated.
In Fig. 8, the predicted milk yield response on number of milkings at 50, 100, 150, 200 and 250 DIM is displayed for the different models. Models T1 and T2 predict a higher response at 50 DIM and a lower response later on in lactation than model EM. The predicted curvature in response in model EM is more pronounced than in models T1 and T2 and can be explained by the constraints in model EM.
Estimated response curve of daily milk yield (kg/day, Y-axes) on number of milkings per day (X-axes) at 50, 100, 150, 200 and 250 DIM for models T1 (solid line), T2 (dashed line) and EM (dotted line).

Usefulness for control and monitoring
From the above discussion, it is seen that model EM provides reasonable results, whereas model T2 shows poorer results. Model T1 obviously lacks information about the curvature of the response. The results of model EM for the 15 cows will now be discussed to illustrate the usefulness of model EM for control and monitoring. Three cows were primiparous and 12 multiparous. Table 3 presents the parameter estimates for model EM at 100 and 200 DIM to show the variation between individual cows.
Parameter estimates of model EM for 15 cows at 100 and 200 DIM. Standard errors in parentheses are given for the first primi- and multiparous cow

The primary aim is to control the milk production process by providing actual parameter estimates of the milk yield response as a basis for determination of daily settings for concentrate supply and milking interval length during lactation. The settings chosen are economically optimal settings that account for the actual milk and concentrate prices. Milking duration is also taken into account to ensure that the total milking time fits within the restricted capacity of the AMS. The method for calculating the preferred settings is described in Andre et al. (Reference André, Berentsen, van Duinkerken, Engel and Oude Lansink2010a, Reference André, Berentsen, Engel, de Koning and Oude Lansinkb). The preferred settings overcome several disadvantages of currently used standard guidelines for concentrate allocation and milking frequency, which are based on models that predict the performance of dairy cows (e.g. Zom et al. Reference Zom, Van Riel, André and Van Duinkerken2002; Thomas Reference Thomas2004) using general relationships from the population the individual belongs to. Individual variation in the milk yield response to concentrate intake and milking frequency is ignored. Consequently, there is a large degree of uncertainty about the predicted performance. Neither the milking duration in relation to capacity of the AMS nor economic aspects, such as the milk and concentrate prices, is taken into account in currently used advisory systems. Consequently, the advised settings using standard guidelines are often suboptimal. Another disadvantage of existing practice is that the settings are manually adjusted periodically with intervals up to 4–6 weeks, whereas the preferred settings can be automatically updated daily. The preferred settings are continuously tailored to the performance of an individual cow in the actual situation. Therefore, the profitability of dairy production can be improved and, additionally, positive effects on health and reproduction are expected.
In addition to control of the production process, the model and associated time series analysis is also a useful tool for monitoring. Automatic intervention and temporary change of discount factors ensures that the model adapts faster after detection of potential outliers and other deteriorations. The detected potential outliers and signals for deteriorations can also be used to alert the farmer that milk production is disturbed, possibly due to illness, heating or failure of equipment. In Fig. 9, the distribution of the forecast errors is given, classified as normal error, signal for deterioration or potential outlier.
Histogram of forecast errors (kg milk/day) classified as normal (white), signal for deterioration (grey) or potential outlier (black) for all data of the 15 cows together.
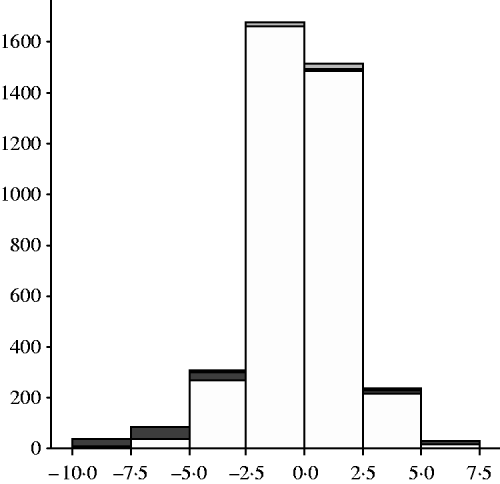
Out of 4013 forecast errors, 0·015 were classified as signals for deterioration and 0·058 as potential outliers. In currently used decision support systems, attention on deviating milk yield is commonly based on fixed thresholds for deviations between observed and expected milk yield, e.g. ±2·5 kg milk/day or a fixed proportion of expected daily milk yield. Figure 9 shows that many forecast errors deviating more than ±2·5 kg were not classified as potential outliers nor as signals for deterioration, whereas a small proportion of deviations lower than ±2·5 kg were. This is because model EM, in concert with the time series analysis, is more specific: forecast errors are evaluated fully, taking account of the realized milking intervals and actual individual variance that may differ between and within cows.
Signals and potential outliers occurred in 222 series of length 1, 20 series were of length 2 and only 7 series of length 3 or longer. This indicates that it is likely that most of the signals for deterioration and potential outliers were false positives, resulting from technical failures of the equipment or registration errors. Nevertheless, the Bayesian procedure for monitoring offers a good starting point for an appropriate alert system, when the length of series of sequential outliers and/or signals is taken into account.
CONCLUSIONS AND RECOMMENDATIONS
The present research shows that the actual individual milk yield response to concentrate intake and milking interval can be adequately estimated online from daily accumulated real-time process data, with an adaptive dynamic linear model. A two-dimensional quadratic response surface can be used, which can be regarded as an approximation to more intricate nonlinear models. Modification of the quadratic model is recommended, as done for the EM in the present paper, for the sake of sparseness and interpretability of parameters in the model.
Model assessment showed that the daily individual response parameter estimates from model EM can be used in an algorithm to determine the daily individual optimal settings for concentrate supply and milking frequency. The algorithm can be built in decision software and fits within the concept of PLF. Model T1, as a first-order Taylor approximation, has limited use for defining an economic optimum, and is only useful for forecasting milk production. Furthermore, evaluation of the predicted responses suggested that model T1 adapts relatively slow. Model T2, the second-order approximation, apparently adapts too fast and consequently the parameter estimates proved to be unstable, with severely biased estimates for curvature.
Monitoring signals and potential outliers provide a base for useful alerts to the farmer, but the length of the series of sequential signals and/or outliers should be taken into account.
The authors are grateful to Edwin Bleumer for gathering the data. This project was funded by the Dutch Commodity Board for Dairy Products (Zoetermeer) and the Dutch Ministry of Agriculture, Nature and Food Quality (Den Haag).
APPENDIX I
A univariate dynamic linear model consists of an observation and system equation. The observation equation is

linking the observations milk yield per day Y t to the regressor variables for concentrate intake and interval length in matrix Ft.
The system equation is

The system error follows a Student's t distribution:  . The analysis starts with an initial prior for the parameters and the online parameter estimates are sequentially updated based on information of the past. The decay of information is regulated by discount factors for the intercept (δ I=0·95) and for the regression parameters (δ R=0·975) assuming that dynamic change of the intercept is greater than the dynamic change of the regressor variables.
The observation variance is unknown and estimated from information from the past using a discount factor for variance learning δ V=0·9. The observation error is assumed to be normally distributed  with precision
 ;
 and n t degrees of freedom. The number of milkings per day, N t, is used as weighting factor, because the observation Y t results from the accumulation of several milkings per day.
Detection of outliers and other deteriorations is based on monitoring of the cumulative Bayes’ factor. After detection of potential outliers or signals for deterioration, automatic intervention is carried out applying once-only exceptional discount factors, δ I=δ V=0·8 and δ R=0·9. These exceptional discount factors are lower than the routinely used discounts factors resulting in an extra loss of information so that the system parameters adapt faster to a probable change in the process.



