Implications
The clinical signs of subacute ruminal acidosis (SARA) include the depression of food intake, diarrhea and laminitis, which indicate a stress response in the animals. Previous studies showed that SARA cows and steers had higher level of acute phase proteins in plasma than control healthy animals. As another indicator of stress, cortisol plays a vital role for maintaining internal homeostasis. However, the data about the alternations of cortisol in SARA ruminants are limited. Therefore, the aim of this study was to investigate the stress response of SARA goats, with particular focus on the cortisol production in adrenal cortex.
Introduction
Feeding excessive amounts of non-structural carbohydrates and highly fermentable forages to ruminants are the common reasons to cause subacute ruminal acidosis (SARA), and SARA is a common health and production problem in dairy herds in intensive management systems (Van Metre et al., Reference Van Metre, Tyler and Stehman2000; Enemark et al., Reference Enemark, Jørgensen and Kristensen2004; Plaizier et al., Reference Plaizier, Krause, Gozho and McBride2008; Klevenhusen et al., Reference Klevenhusen, Hollmann, Podstatzky-Lichtenstein, Krametter-Frötscher, Aschenbach and Zebeli2013). The consequences of SARA include depression of food intake, diarrhea, laminitis and inflammatory response due to increased production of bacterial endotoxin such as lipopolysaccharide (LPS). When ruminants experienced SARA, a huge amount of LPS production and the lesions in the gastrointestinal tract easily caused LPS translocation from the gastrointestinal lumen to peripheral circulating system, thus leading to the inflammatory response (Khafipour et al., Reference Khafipour, Krause and Plaizier2009).
Thereafter, immune responses are activated and pro-inflammatory cytokines are released via toll-like receptors 4 recognizing the circulating LPS (Baumann and Gauldie, Reference Baumann and Gauldie1994). The acute phase response is the answer of the organism to disturbances of homeostasis due to inflammation, tissue injuries or other disorders, and is helpful to restore the disturbed physiological homeostasis (Bode et al., Reference Bode, Albrecht, Häussinger, Heinrich and Schaper2012). Liver is the major site for the synthesis of acute phase proteins (APPs), including LPS-binding protein (LBP), C-reactive protein (CRP), serum amyloid A (SAA) and haptoglobin (HP) (Murata et al., Reference Murata, Shimada and Yoshioka2004). Among these APPs, HP and SAA are two major APPs in ruminants, and particularly HP appears to be a potential indicator of acidosis in goats (González et al., Reference González, Ruipérez, Sánchez, Souza, Martínez-Subiela and Cerón2010). It has been demonstrated that SARA induced by high grain diet causes the increase of APPs in peripheral blood (Gozho et al., Reference Gozho, Plaizier, Krause, Kennedy and Wittenberg2005; Khafipour et al., Reference Khafipour, Krause and Plaizier2009).
It is well-documented that there is a close link between immune response and stress reaction. The previous studies showed that cytokines secreted by immune cells can activate the hypothalamic–pituitary–adrenal axis (HPA) after dairy cows were subjected to LPS injection (Steiger et al., Reference Steiger, Senn, Altreuther, Werling, Sutter, Kreuzer and Langhans1999; Waldron et al., Reference Waldron, Nishida, Nonnecke and Overton2003). The results from Karrow et al. (Reference Karrow, You, McNicoll and Hay2010) also showed that sheep injected with interleukine-6 stimulated cortisol and corticotrophin hormone secretion into the peripheral circulating system, indicating a cross-talk of immune system and the HPA axis. As the final hormone of the HPA axis, cortisol is used as an indicator of stress and pain, and elevated serum cortisol has occurred after surgical stress in dairy cows (Mudron et al., Reference Mudron, Scholz, Sallmann, Rehage, Kovac, Bartko and Höltershinken1994; Thüer et al., Reference Thüer, Mellema, Doherr, Wechsler, Nuss and Steiner2007). The common clinical signs associated with SARA are reduced feed intake, reduced rumination, mild diarrhea and metabolic disorders, indicating that SARA animals might live in a certain stress status. However, the relative information is limited.
Cortisol is synthesized from cholesterol in the adrenal glands under the control of the HPA axis. The synthesis of cortisol is under the control of several key factors including 17α-hydroxylase cytochrome P450 (P45017α ), cytochrome P450 side-chain cleavage (P450scc) and 3β-hydroxysteroid dehydrogenase (3β-HSD) (Kaminska et al., Reference Kaminska, Ciereszko, Kiezun and Dusza2013). To our knowledge, limited information is available concerning changes of the stress status in ruminants induced to SARA. The objective of this study was to investigate the differences in plasma APPs and cortisol concentrations and the related gene expression between SARA and healthy goats.
Material and methods
Animals and experimental procedures
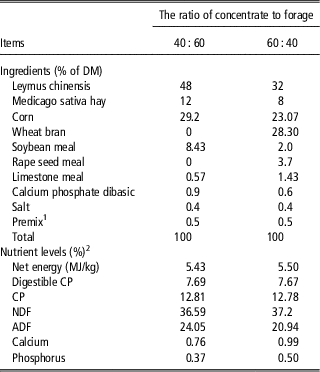
Twelve non-lactating multiparous goats (Chinese local breed) with 20.0±1.5 kg BW were used as the animal model in this study. Animals were housed in individual stalls in a standard animal feeding house at Nanjing Agricultural University (Nanjing, China). During a surgical procedure that required only a short post-operative recovery time, a small cannula constructed from polyvinylchloride was inserted into the rumen of each goat. Goats had free access to a diet containing 60% forage and 40% concentrate during the surgical recovery time. After recovery, goats were randomly allocated to the control group or SARA group, respectively. Each day at 08:00 and 18:00 control goats were fed a diet with forage to concentrate (F : C) ratio of 60 : 40 (Control, n=6) and SARA goats were fed a F : C ratio of 40 : 60 (SARA, n=6), respectively. The nutrients level including metabolic energy and CP content were approximately similar between the control and SARA diets, and the main difference was the dietary physical form (Table 1). The animals were fed the respective diets for 3 weeks, including 1 week for dietary adaptation and 2 week of experimental time, and had free access to water.
Ingredients and composition of the experimental diets (%)

DM=dry matter.
1 Provided per kg of premix: vitamin A 6000 U; Vitamin D2 500 U; Vitamin E 80 mg; Cu 6.25 mg; Fe 62.5 mg; Zn 62.5 mg; Mn 50 mg; I 0.125 mg; Co 0.125 mg; Mo 0.125 mg.
2 Nutrient levels were estimated from the current goat foods.
Rumen fluid sampling and tissues collection
Fifteen minutes before feed delivery and 1, 2, 4, 6, 8, 10 and 12 h after feed delivery on 2 consecutive days during week 3, 10 ml of rumen fluid was collected from each goat and pH value was measured immediately with pH-meter (six goats/group). Goats were fasted overnight and slaughtered at the end of the experiment. Liver and adrenal cortex tissues were quickly removed and immediately frozen in liquid nitrogen, and stored at −80°C until RNA isolation and protein extraction. The animal experiment was undertaken following the guidelines of the Animal Ethics Committee of Nanjing Agricultural University, China.
RNA extraction and real-time quantitative reverse transcription (RT-PCR)
Total RNA was extracted from liver and adrenal gland tissues (n=6) using TRIZOL reagent (Takara, Dalian, China) according to the manufacturer’s protocols. Total RNA concentration was then quantified by measuring the absorbance at 260 nm in a spectrophotometer (Eppendorf Biotechnology, Hamburg, Germany). Ratios of absorption (260/280 nm) of all preparations were between 1.8 and 2.0. Aliquots of RNA samples were subjected to electrophoresis with 1.4% agarose-formaldehyde gels stained with ethidium bromide to verify their integrity.
RT reaction was performed in a Bio-Rad DNA Engine Peltier Thermal Cycler PTC0200 (Bio-Rad, Hercules, CA, USA). In order to ensure that all the total RNA samples were free of genomic DNA contamination, total RNAs were treated with 10 U DNase I (RNase Free) (Code No. D2215, TaKaRa Biotechnology, Dalian, China) for 30 min at 37°C, and purified according to the manufacturer’s protocol (TaKaRa Biotechnology). Two micrograms of total RNA was reverse transcribed by incubation at 37°C for 1 h in 25 μl mixture consisting of 1×RT-buffer, 100 U Moloney Murine Leukemia Virus reverse transcriptase, 8 U RNase inhibitor, 5.3 μM random hexamer primers and 0.8 mM dNTP. The reaction was terminated by heating at 95°C for 5 min and quickly cooling on ice.
Real-time RT-PCR was performed in Mx3000P (Stratagene, La Jolla, CA, USA). Mock RT and No Template Controls were set to monitor the possible contamination of genomic and environmental DNA at both RT and PCR. The pooled sample made by mixing equal quantity of RT products (cDNA) from all samples was used for optimizing the PCR condition and tailoring the standard curves for each target gene, and melting curves were performed to insure a single specific PCR product for each gene. Two microliters of 16-fold dilution of RT product was used for PCR in a final volume of 25 μl containing 12.5 μl SYBR Green Real-time PCR Master Mix (TOYOBO Ltd, Shanghai, China) and 0.6 to 0.8 μM of each forward and reverse primers for target genes as shown in Supplementary Table S1. Goat β-actin mRNA was used as a reference gene for normalization purposes. The PCR protocol was initial denaturation at 95°C for 1 min and followed by a three-step amplification program (20 s at 95°C, 20 to 30 s at 60 to 64°C, 30 s at 72°C) was repeated 45 times. The PCR products for each gene were sent to Haojia Biotech Ltd, Shanghai, China, for sequencing to verify the specificity. The reported sequences exactly matched those published in GenBank. The method of 2-ΔΔCt was used to analyze the real-time RT-PCR data. All samples were included in the same run of RT-PCR and repeated for at least 3 times.
Western blot analysis
Adrenal cortex tissues (~100 mg) were homogenized with 1 ml lysis buffer (50 mM Tris-HCl, pH8.0), 150 mM NaCl, 0.5% deoxycholateand, 0.1% SDS, 1%Triton X-100 and protease inhibitor cocktail. Tissue lysates were centrifuged at 12 000×g at 4°C for 10 min and the supernatant was harvested. Protein concentrations were determined in duplicate by the bicinchoninic acid BCA) Protein Assay Kit (Pierce Chemical Corp, Rockford, USA). The protein samples were denatured at 100°C for 5 min, and then each sample and marker were subjected to 12% sodium dodecyl sulfate-polyacrylamide gel electrophoresis (SDS-PAGE) at 60 V for 30 min, then 100 V for 2 h. After that, proteins were transferred to nitrocellulose membranes at 100 V for 1.5 h at 4°C. The membranes were washed three times for 15 min in Tween-Tris-buffered-saline (TTBS, 1.81 g Tris, 8.8 g NaCl, 1 ml Tween-20 and 999 ml H2O, pH 7.42) buffer and blocked with 3% BSA in TTBS at room temperature for 2 h. The membranes were incubated with primary antibodies (3β-HSD 1 : 500 dilution, ab80363, Abcam; P450scc 1 : 400 dilution, ab86357, Abcam; β-actin 1 : 10 000, KC-5A08, Kangcheng) at 4°C overnight. After being washed five times for 40 min in TTBS, blots were incubated with anti-rabbit (3β-HSD and P450scc) or anti-mouse (β-actin) IgG horseradish peroxidase conjugate at room temperature. The immunoreactive band was visualized by enhanced chemiluminescence detection (Super Signal West Pico Trial Kit, Pierce, USA) and quantified by VersaDoc 4000 MP (Bio-Rad).The band densities of 3β-HSD and P450scc are expressed as optical densities relative to the control signal.
Statistical analysis
The results are expressed as mean±s.e.m. The difference in gene expression and protein translation between control and SARA goats was analyzed by using the post hoc analysis with the least significant difference test following ANOVA of SPSS 11.0. The data of ruminal pH was analyzed by Univariate using the General Linear Models of SPASS 11.0 for windows (StatSoft Inc, Tulsa, OK, USA). Differences were considered significant when P<0.05, and 0.05<P<0.1 was considered a trend. The method of 2−ΔΔCt was used to analyze the real-time PCR data (Livak and Schmittgen, Reference Livak and Schmittgen2001). The mRNA expression was expressed as the fold change relative to that of control group. Numbers of replicates used for statistics are noted in the Tables and Figures.
Results
Ruminal pH
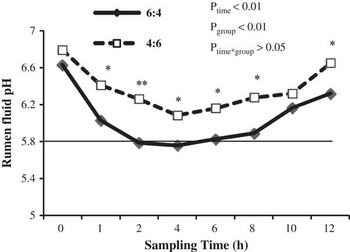
As shown in Figure 1, pH value in rumen fluid of SARA goats was significantly lower than of control goats (P<0.01), showing pH<5.8 from 2 to 6 h after feeding, lasting for more than 3 h. Feeding time as well as dietary modulation significantly affected pH value in rumen fluid (P<0.01), while there was no significant interaction between feeding time and dietary modulation (P>0.05) (Figure 1).
Ruminal pH values in control and subacute ruminal acidosis (SARA) goats. Data were analyzed for differences due to diet, time, and their interactions by ANOVA using the General Linear Models of SPSS 11.0 for Windows (StatSoft Inc, Tulsa, OK, USA). Data were considered statistically significant when P<0.05, n=6. **P<0.01 and *P<0.05 between two groups (n=6).

The level of plasma cortisol and factors expression in adrenal cortex
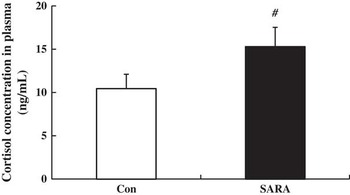
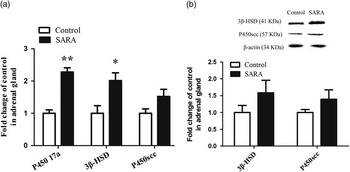
There was a trend increase of cortisol in plasma of SARA goats compared with control (0.05<P<0.1) (Figure 2). As shown in Figure 3a, in adrenal gland, genes expression of P45017α (P<0.01) and 3β-HSD (P<0.05) were markedly up-regulated, while P450scc mRNA expression was not altered in SARA goats compared with control (P>0.05) (Figure 3a). Figure 3b shows that, the contents of 3β-HSD and P450scc protein in adrenal gland were increased by 58.6% and 39.4% in SARA goats, respectively, but did not reach the statistical significance (P>0.05).
The level of plasma cortisol in control and subacute ruminal acidosis (SARA) goats. The results were expressed as mean±s.e.m. and differences was analyzed by using the post hoc analysis with the least significant difference test following ANOVA of SPSS 11.0. # represents 0.05<P<0.1, which was considered a trend.

The expression of P45017α , 3β-HSD and P450scc mRNA (a) and the proteins (b) in adrenal gland of control and subacute ruminal acidosis (SARA) goats. The level of P45017α , 3β-hydroxysteroid dehydrogenase (3β-HSD) and P450 side-chain cleavage (P450scc) mRNA expression and protein content was normalized to β-actin gene in adrenal gland. The results were expressed as mean±s.e.m. and differences was analyzed by using the post hoc analysis with the least significant difference test following ANOVA of SPSS 11.0. **P<0.01 and *P<0.05 between two groups (n=6).

The level of plasma HP and SAA and genes expression in liver
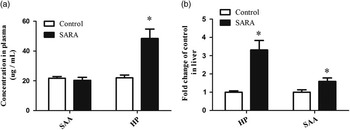
The level of APPs in plasma and their mRNA expression are presented in Figures 4a and b, respectively. Compared with the control goats, the level of plasma HP was significantly increased in SARA goats (P<0.05), while plasma SAA concentration did not change (P>0.05) (Figure 4a). In liver, the levels of HP and SAA mRNA expression were significantly up-regulated in SARA goats compared with control (P<0.05) (Figure 4b).
The level of haptoglobin (HP) and serum amyloid A (SAA) in plasma (a) and their gene expression (b) in liver of control and subacute ruminal acidosis (SARA) goats. The level of haptoglobin (HP) and SAA mRNA expression was normalized to β-actin gene expression in liver. The results were expressed as mean±s.e.m. and differences was analyzed by using the post hoc analysis with the least significant difference test following ANOVA of SPSS 11.0. **P<0.01 and *P<0.05 between two groups (n=6).

Discussion
In ruminants, SARA is a metabolic disease induced by feeding excessive amounts of highly fermentable forages and insufficient dietary coarse fiber (Elam, Reference Elam1976; Gozho et al., Reference Gozho, Plaizier, Krause, Kennedy and Wittenberg2005). As it affects animal health and reduces productive performance, SARA is considered to be the most important nutritional disorder for ruminants (Kleen et al., Reference Kleen, Hooijer, Rehage and Noordhuizen2003). In experimental studies, most effective indicators for the definition of SARA are based on ruminal pH. pH<5.6 or <5.8 in rumen fluid and prolonged for more than 3 h was set as the threshold for SARA definition for dairy cows (Beauchemin et al., Reference Beauchemin, Yang and Rode2003; Krause and Oetzel, Reference Krause and Oetzel2005). In good agreement with the previous studies, our results showed that feeding 60% concentrate diets for 3 weeks declined ruminal pH below 5.8 and lasted for more than 3 h per day. Our results indicate that feeding 60% concentrate (of dry matter) for 3 weeks can successfully induce subacute ruminal acidosis in dairy goats during non-lactating stage. Similarly, mid-lactation dairy goats receiving 60% concentrate diet showed lower mean daily ruminal pH and the percentage of time (pH<6.0) increased significantly compared to goats digesting 30% concentrate diet (Desnoyers et al., Reference Desnoyers, Duvaux-Ponter, Rigalma, Roussel, Martin and Giger-Reverdin2008). However, the daily mean pH was very close to the threshold of 6.25 proposed by Sauvant et al. (Reference Sauvant, Meschy and Mertens1999) to characterize subacute acidosis. Thus, it is reasonable to suggest that goats receiving 60% concentrate diet for 3 to 4 weeks were more acidogenic than controls.
SARA is a typical metabolic disorder in ruminants. When animals experience SARA disease, LPS is likely translocated from ruminal lumen and/or hindgut lumen into peripheral circulating system, causing the body inflammatory and acute phase response. In regard to acute phase response, several studies presented that SARA induced by high grain diet causes the increase of APPs in peripheral blood (Gozho et al., Reference Gozho, Plaizier, Krause, Kennedy and Wittenberg2005; Khafipour et al., Reference Khafipour, Krause and Plaizier2009). A grain-based SARA triggers inflammation and increases the level of APPs including SAA, HP and LBP in blood of lactating Holstein cows (Khafipour et al., Reference Khafipour, Krause and Plaizier2009). Gozho et al. found an increase in the plasma concentration of both HP and SAA in steers fed a diet consisting of 60% grain compared with those fed a hay diet (Gozho et al., Reference Gozho, Plaizier, Krause, Kennedy and Wittenberg2005). However, SARA induced by replacing 40% of alfalfa hay with alfalfa pellets quadratically, increased free rumen LPS concentration, but did not accompany an increase in SAA, HP or LBP in peripheral circulation (Khafipour et al., Reference Khafipour, Krause and Plaizier2009). These inconsistent results indicated that compared with forage particle size-induced SARA, grain-induced SARA is likely to cause inflammatory and immune response. González et al (Reference González, Ruipérez, Sánchez, Souza, Martínez-Subiela and Cerón2010) reported that as one of the major APPs in ruminants, HP particularly appears to be a potential indicator of acidosis in goats. During the stepwise adaptation from all-forage diet to 61% concentrate diet, serum HP was increased, but SAA concentration was not affected when SARA was induced in steers (Gozho et al., Reference Gozho, Krause and Plaizier2006). In a good agreement, our results showed that though hepatic HP and SAA mRNA expressions were both up-regulated in SARA goats induced by high concentration diet, only serum HP concentration was elevated. On the contrary, in mid-lactation dairy cows, grain-induced SARA elevated SAA concentration, but did not affect HP concentration (Gozho et al., Reference Gozho, Krause and Plaizier2007). These inconsistent results may be due to the differences in animal species, physiologic status and diet composition.
The elevation of cortisol concentration in stressful situations is an adaptation response of the organism to the changing environment (Jarvis et al., Reference Jarvis, Moinard, Robson, Baxter, Ormandy, Douglas, Seckl, Russell and Lawrence2006; Rutherford et al., Reference Rutherford, Haskell, Glasbey and Lawrence2006). Cortisol is used as an indicator of stress and pain (Mudron et al., Reference Mudron, Scholz, Sallmann, Rehage, Kovac, Bartko and Höltershinken1994). In cow, there was no significant difference of cortisol concentration in peripheral circulating system between high grain-induced SARA animals and the control healthy counterparts (Iqbal et al., Reference Iqbal, Zebeli, Mazzolari, Dunn and Ametaj2010). In the present study, cortisol concentration in circulating system of SARA goats showed a trend to increase (0.05<P<0.1) compared with control. It is well-documented that cortisol is an important regulator of glucose homeostasis, which acts to increase gluconeogenesis from amino acids and to control milk production in lactating ruminants (Huntington, Reference Huntington1990; Kristina et al., Reference Kristina, Örjan and Bernt2010). This moderate increase in cortisol release suggests a slight stress response for SARA animals. The physiological significance of this increase of cortisol in SARA ruminants still needs further study.
Cortisol secretion is under the control of the HPA axis. As one of steroids hormone, the synthesis of cortisol occurs in the adrenal cortex and is regulated by several key factors or enzymes (Sugawara et al., Reference Sugawara, Holt, Driscoll, Strauss, Lin, Miller, Patterson, Clancy, Hart and Clark1995; Stocco and Clark, Reference Stocco and Clark1996). During this process, the six-carbon side chain is removed from cholesterol to form pregnenolone, which is catalyzed by cholesterol side-chain cleavage cytochrome P450 (P450scc), an inner mitochondrial membrane protein (Hall, Reference Hall1986; Miller, Reference Miller1988). Another key factor to control cortisol production in adrenal cortex is 3β-HSD which plays a vital role in conversing pregnenolone to form progesterone, and catalyzing 17-hydroxypregnenolone to 17-hydroxyprogesterone (Kaminska et al., Reference Kaminska, Ciereszko, Kiezun and Dusza2013). Huang et al (Reference Huang, Wu and Li2000) reported that the higher cortisol production in adrenal cortical cell culture from pigs may be, in part, caused by the increase of P450scc and P45017α mRNA expression. In this study, a significant up-regulation of P45017α and 3β-HSD mRNA expression was observed in adrenal cortex of SARA goats. The contents of 3β-HSD and P450scc protein were increased by 58.6% and 39.4%, respectively, though there was no significant difference between control and SARA goats. These changes in gene transcription and protein translation may lead to the moderate increase of cortisol in plasma of SARA goats.
In conclusion, these results suggest that SARA disease induced by high grain-diet in non-lactation goat causes immune response and a slight stress response, indicated by the increases of HP concentration and stress hormone cortisol in blood.
Acknowledgment
This work was supported by National Basic Research Program of China (Project No. 2011CB100802) and National Nature Science Foundation of China (Project No. 31272470) and A Project Funded by the Priority Academic Program Development of Jiangsu Higher Education Institutions (PAPD).