Introduction
Nitrogen (N) is an expensive and difficult nutrient to manage in organic farming systems (Gaskell and Smith, Reference Gaskell and Smith2007), and yield reductions related to N deficiency have been reported in organic systems (Pang and Letey, Reference Pang and Letey2000; Berry et al., Reference Berry, Sylvester-Bradley, Phillips, Hatch, Cuttle, Rayns and Gosling2002). Legumes and legume-based cover crop mixtures can provide significant sources of N to subsequent cash crops, with estimates of N contributions ranging considerably among studies (Smith et al., Reference Smith, Frye and Varco1987; Fageria et al., Reference Fageria, Baligar and Bailey2005; Cherr et al., Reference Cherr, Scholberg and McSorley2006). Cover crops can also offer multifaceted benefits and potential positive and negative consequences of cover cropping have been reviewed by Crews and Peoples Reference Crews and Peoples2004; Snapp et al., Reference Snapp, Swinton, Labarta, Mutch, Black, Leep, Nyiraneza and O'Neil2005; Cherr et al., Reference Cherr, Scholberg and McSorley2006; Tonitto et al., Reference Tonitto, David and Drinkwater2006; Mitchell et al., Reference Mitchell, Shrestha and Irmak2015.
Non-legume cover crops sequester soil N for short periods of time and contribute to longer term soil N pools compared with legumes; however, cereal grain and grass cover crops frequently contribute very little N to subsequent cash crops because of the typically high C:N ratios of the plant tissue (Ranells and Wagger Reference Ranells and Wagger1996). Cover crop mixtures containing both legume and non-legume species offer several advantages over single species for optimizing multiple goals of cover cropping (Sullivan et al., Reference Sullivan, Parrish and Luna1991; Sainju et al., Reference Sainju, Whitehead and Singh2005; Snapp et al., Reference Snapp, Swinton, Labarta, Mutch, Black, Leep, Nyiraneza and O'Neil2005). Legumes in the mixture provide biologically fixed N from their association with Rhizobium bacteria in root nodules, while non-legume species, such as cereal grains or mustards, usually provide faster soil cover and scavenge N from the soil that would otherwise be lost to leaching or other causes (Meisinger et al., Reference Meisinger, Hargrove, Mikkelsen, Williams, Benson and Hargrove1991; McCracken et al., Reference McCracken, Smith, Grove, MacKown and Blevins1994; Brandi-Dohrn et al., Reference Brandi-Dohrn, Hess and Selker1997). Mixtures can also produce more total crop biomass yield than monoculture crops with higher land equivalency ratios (Angustia Nova, Reference Angustia Nova1995; Karpenstein-Machan and Stuelpnagel, Reference Karpenstein-Machan and Stuelpnagel2000; Sainju et al., Reference Sainju, Whitehead and Singh2005). Legumes in the mixture transfer N to the grains or grasses in the soil, thereby increasing their biomass and N content compared with grasses grown without legumes (Ta and Faris, Reference Ta and Faris1987; Sullivan et al., Reference Sullivan, Parrish and Luna1991).
Using a cover crop mixture effectively as an N source requires managing competition among cover crop species within the mixture. The proportion of legume vs non-legume species in the mixture can affect total N as well as N concentration in the green manure crop (Kuo and Sainju, Reference Kuo and Sainju1998). This is particularly important in northern climates where typically grown annual legume cover crops, e.g., hairy vetch (Vicia villosa Roth), Austrian field peas (Pisum sativum L. subsp. Arvense) and crimson clover (Trifolium incarnatum L.) usually establish slowly in the fall during cold and wet conditions. Cereal grains planted as cover crops, such as cereal rye (Secale cereale L.) usually germinate quickly after planting and establish quickly during the fall. However, if seeding rate of the cereal component of a cover crop mixture is too high, the rapid and vigorous growth of the cereal may outcompete the legume (Lawson et al., Reference Lawson, Fortuna, Cogger, Bary and Stubbs2013). This can produce a predominately cereal cover crop in the spring with typically low N content (high C:N ratio), with no or little N provided to the following cash crop (Lawson et al., Reference Lawson, Fortuna, Cogger, Bary and Stubbs2013). The C:N ratio is commonly used as a relative indicator to predict how rapidly the plant tissue will degrade after it is killed, either in the soil or on the soil surface as a mulch (Wagger, Reference Wagger1989). Plant tissue with high C:N ratios (>20 to 25) will be degraded more slowly than tissue with low C:N ratios such as <15 (Magdoff and van Es, Reference Magdoff and van Es2000; Muramoto et al., Reference Muramoto, Smith, Shennan, Klonsky, Leap, Ruiz and Gliessman2011).
In this study, we sought to estimate the performance and N contribution of selected cover crops, grown as sole crops or as mixtures, to organic broccoli [Brassica oleracea L. (Italica group)] production in the maritime Pacific Northwest of the USA. Our objectives were to (1) evaluate biomass production and N accumulation from selected cover crop treatments, (2) compare the effects of fall-planted cover crops on broccoli yield, (3) estimate the quantity of feather meal-N replaced by cover crops. We also wanted to compare oats with phacelia (Phacelia tanacetifolia Benth), a relatively novel cover crop species. Our choice of cover crops resulted from previous participatory on-farm research with vegetable growers in Oregon (Luna and Staben, Reference Luna and Staben2002). Several cover crop species and varieties had emerged which were preferred by the collaborating growers to cover crop species commonly grown in other regions. For example, rather than cereal rye, a cover crop grown widely across the USA, growers involved in our collaborative research projects preferred oats (Avena sativa L.) because of its shorter stature growth in the spring. Also, instead of hairy vetch, commonly grown in the eastern USA, Oregon growers preferred to grow common vetch (Vicia sativa L.) because of its reduced vining tendency and reduced incidence of hard seed, which can survive in the soil and become a weed problem in subsequent crops. Phacelia has shown potential in conservation tillage systems because of its relative ease of mechanical killing using mowing equipment, and the reduced tillage required for its incorporation in soil, compared with cereal grain cover crops (Luna et al., Reference Luna, Mitchell and Shrestha2012). In six on-farm research trials in western Oregon (2003–2005) comparing oat, oat plus common vetch, oat plus phacelia cover crops and a no-cover crop control, all three cover crops produced comparable biomass (Luna, Reference Luna2009). Wyland et al. (Reference Wyland, Jackson, Chaney, Klonsky, Koike and Kimple1996) found that cereal rye and phacelia cover crops were effective at taking up N preceding an irrigated broccoli crop, reducing nitrate leaching by >70%. Phacelia is also a major nectar and pollen source for honey bees and bumblebees (Williams and Christian, Reference Williams and Christian1991), and may serve a role as an insectary plant to enhance conservation biological control (Hickman and Wratten, Reference Hickman and Wratten1996; Colley and Luna, Reference Colley and Luna2000; Ambrosino et al., Reference Ambrosino, Luna, Jepson and Wratten2006).
Materials and methods
Site description
Because high levels of N-carryover from previous crops and manure have contributed to inability to detect cover crop effects in some studies (Lawson et al., Reference Lawson, Fortuna, Cogger, Bary and Stubbs2013), we chose to work in an irrigated organic system without previous history of manure or compost additions. Field studies were conducted in 2007 and 2008 at the Oregon State University Lewis Brown Farm (LBF) located near Corvallis, OR, USA. The soil was a Chehalis silt loam. The field used in 2007 was planted in blackberries from 2001 until 2003 and was fallow for 2 yr before cover crops were established in October, 2006. The 2008 experiment was relocated to an adjacent field at LBF. The field was planted in grasses 2003 through 2004, assorted vegetables in 2005, summer buckwheat in 2006 and fallowed in 2007 before cover crops were planted in October 2007. No synthetic insecticides or fertilizers had been applied for at least 3 yr prior to the start of these experiments. Although not yet certified organic, the area had been designated for transitional organic research.
The 2007 experiment
In preparation for cover crop planting, the field was disked and rolled with a cultipacker on October 1, 2006. Experimental treatments consisted of five cover crop treatments and a no-cover crop (fallow) control arranged in a randomized block design with four replications. Plots were 4.6 m × 36.6 m. Cover crops included ‘Monida’ oats, phacelia, common vetch and mixtures of oats and vetch and phacelia and vetch (see Table 1 for seeding rates). Cover crops were seeded October 3, 2006. To ensure accurate and uniform seeding rates, cover crop plots were subdivided into 4.6 m × 6.1 m subplots, with strings stretched to define the subplot boundaries. Cover crop seed was weighed separately for each subplot and broadcast seeded by hand.
Cover crop treatments and seeding rates in 2007 and 2008 experiments near Corvallis, OR, USA

The vetch in all treatments was inoculated with Rhizobium leguminosarum at the rate of 4 g kg−1 of seed. A few drops of water were added to the seed before mixing in the Rhizobium. Because of the small size of the phacelia seed, a ‘seed shaker’ was made by drilling 0.2 cm diameter holes in the lid of a Mason fruit jar. After seeding, strings were removed and a 2.4 m-wide tine-harrow drag was pulled longitudinally down the length of the plots to cover the seed. After seeding, irrigation was applied with overhead sprinklers to assure germination and establishment.
The 2008 experiment
In preparation for cover crop planting, the field was disked and rolled with a cultipacker on September 24, 2007. Prilled lime was applied at a rate of 2.2 t ha−1 and incorporated with a 2.4 m-wide tine harrow. Rains in late September and early October delayed cover crop seeding until October 8. Experimental treatments consisted of the same five cover crop treatments and a no-cover crop control, but phacelia seeding rates were increased slightly (Table 1). Cover crop treatment plots were 4.1 m × 24.4 m. Cover crops were hand-seeded, as for the 2007 experiment. Inadvertently, the vetch seed did not receive Rhizobium inoculant prior to planting. After seeding, a 2.4 m-wide tine harrow was pulled longitudinally down the length of the plots to cover the seed. No irrigation was applied because of wet soil conditions from rainfall.
Cover crop biomass and N content
Cover crop and weed above-ground biomass were sampled on May 12, 2007 and May 14, 2008. Two biomass samples were taken in each treatment plot by mowing across each replication block at random locations using a 0.76 m-wide powered sickle bar mower. Cover crops within a 4.6-m long section were raked and weighed. A subsample was then taken and returned to the laboratory where cover crop species and weeds were separated and placed in paper bags. The samples were oven-dried at 65°C for 72 h and then weighed to determine percent dry matter. Subsamples were taken from each cover crop component and pooled across replicates, then analyzed for percent total C and total N by the OSU Central Analytical Laboratory using a LECO CNS-2000® (LECO Corporation, Saint Joseph, MI, USA).
Broccoli experimental design
In 2007, cover crops were flail-mowed on May 13 (1 day after biomass sampling) and a Tortella® power-spader and Lely Roterra® used to incorporate the cover crop and prepare a seed bed in all treatment plots. A split-plot, randomized block design was established, with each cover crop plot divided into four sub-plots with four N fertilizer rates (0, 100, 200 and 300 kg N ha−1) randomized within the plot. Feather meal (N-P-K analysis 12-0-0) was used to create the N fertilizer rates. Feather meal was weighed, placed in paper bags and hand applied in a 15 cm-wide band over all four rows of the 4.6 m × 6.1 m plots, and was incorporated into the soil to a depth of approximately 5–7 cm using a tine harrow on May 29. Greenhouse-grown ‘Arcadia’ broccoli seedlings were transplanted the next day using a mechanical transplanter and irrigated immediately afterward. Broccoli rows were on 90-cm centers with plants spaced at 46 cm within the rows, for a planting density of 24,200 plants ha−1.
In 2008, the experimental design used in 2007 was repeated. Cover crops were flail-mowed on May 15 (1 day after biomass sampling) and a Tortella® power-spader and Lely Roterra® used to incorporate the cover crop and prepare a seed bed in all treatment plots. A rotary strip-tiller was used to mark the rows in all plots, and feather meal applied to the N fertilizer treatments and incorporated to a depth of 10–15 cm using the strip-tiller on June 9. Greenhouse-grown broccoli seedlings were hand-transplanted on June 10 and irrigated immediately afterward. Broccoli plant density was increased to 36,300 plants ha−1 by reducing in-row plant spacing to 36 cm and between-row spacing to 75 cm. This row-spacing configuration was used to more closely mimic the planting density used by commercial vegetable growers in Oregon.
Weed and insect management
In both years of the experiment, tractor-mounted sweep cultivators and hand hoeing were used for weed control. Insect populations were monitored weekly by visual examination of 40 broccoli plants randomly selected within the entire experimental block.
In 2007, Pyganic® (pyrethrin) (0.06 kg·A.I. ha−1) was applied to control cabbage aphid on June 21, and again on July 3 (0.12 kg·A.I. ha−1) with a tractor-mounted boom sprayer. To control flea beetle (Phyllotreta cruciferae Goeze) and cabbage aphid (Brevicoryne brassicae L.), azadirachtin (0.15 kg A.I. ha−1) was applied on July 20 using a Solo® backpack sprayer. Entrust® (spinosad) (0.10 kg A.I.·ha−1) was applied on August 6 using a Solo® backpack sprayer to control cabbage looper (Trichoplusia ni Hubner) and imported cabbage worm (Pieris rapae L.).
In 2008, insect population densities were estimated using methods described for 2007. Flea beetle population was estimated to be 5.6 beetles/plant on June 19 and azadirachtin (0.15 kg·A.I. ha−1) was applied on June 23 using a Solo® backpack sprayer. Flea beetle population density remained high on June 26, so the rate of azadirachtin was increased to 0.3 kg A.I. ha−1 and applied again. On June 28, flea beetle populations remained at 4.6 beetles plant−1, so rotenone (0.04 kg·A.I. ha−1) was applied with a backpack sprayer. On July 9, a modified Sears® Craftsman leaf blower was unsuccessfully used in an effort to vacuum beetles from the plants to reduce beetle populations. Entrust® (0.3 kg A.I. ha−1) was applied using a Solo® backpack sprayer on July 10, providing adequate flea beetle control.
Pyganic® was applied on August 7 (0.15 kg A.I. ha−1) in a tank mix with Entrust® (spinosad) (0.15 kg A.I. ha−1) to control cabbage aphid, cabbage looper and imported cabbage worm. Pyganic was applied to control cabbage aphid once again on August 22 (0.14 kg A.I. ha−1) with a backpack sprayer.
Soil nitrate
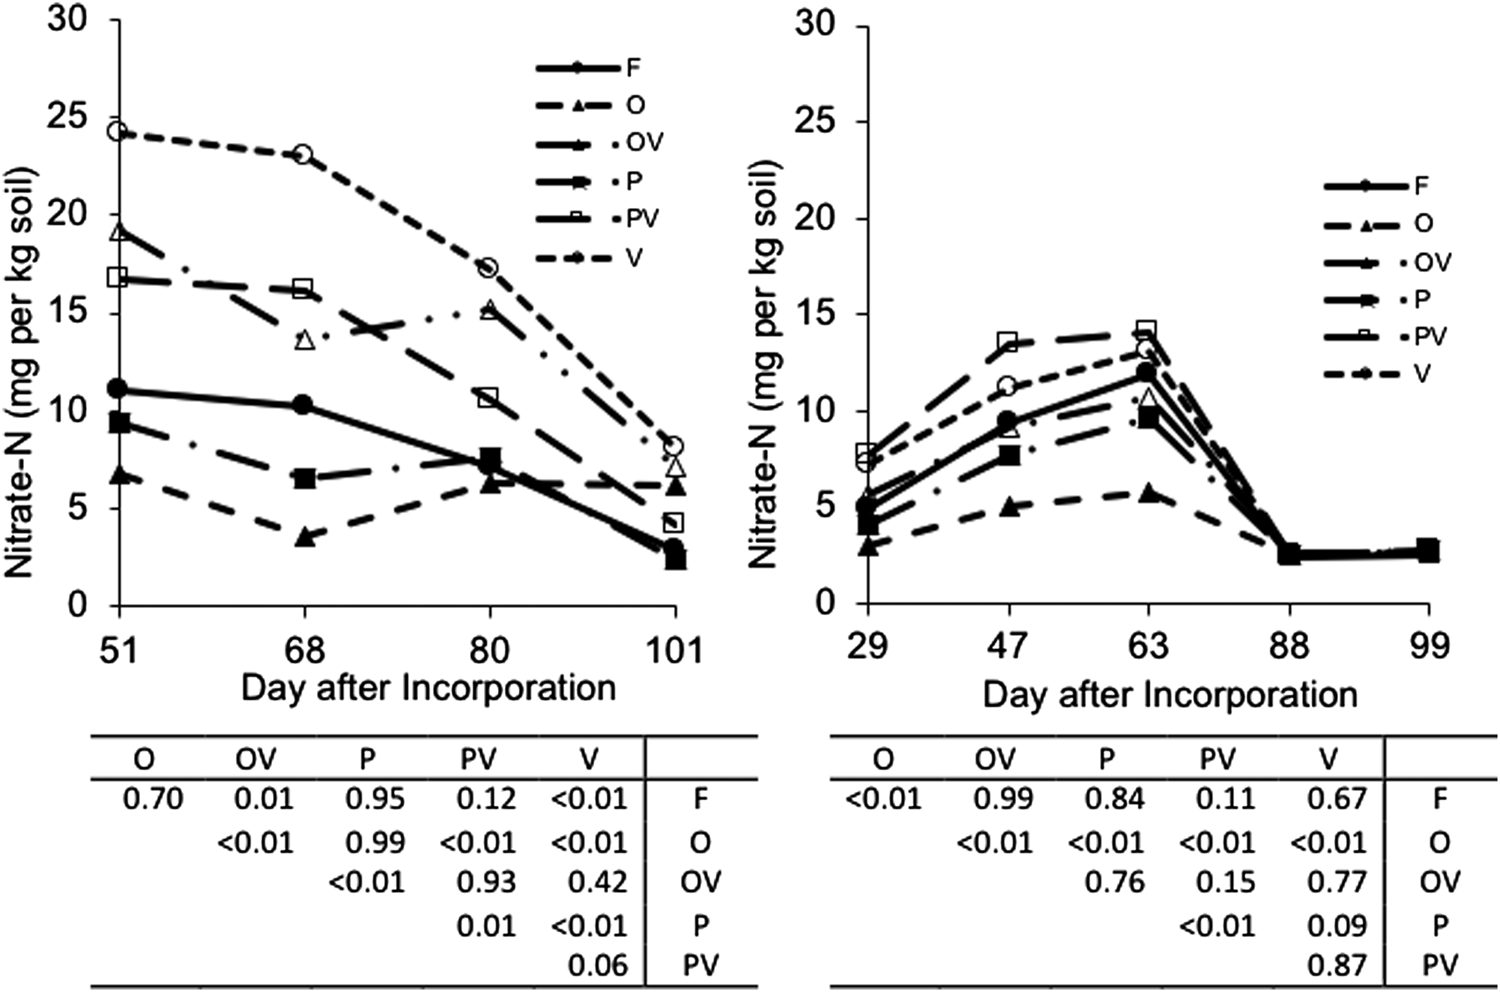
Soil samples were taken to a depth of 30 cm on approximate 2-week intervals throughout the season to estimate mineralization from the residue in each cover crop treatment. Within each zero-N cover crop treatment plot, five soil cores were taken randomly in the center areas between the broccoli rows and the soil cores pooled for analysis. We only took samples from the zero-N treatments because our research objective was to evaluate soil nitrate resulting only from the various cover crop treatments, and not that resulting from N fertilization. Samples were analyzed for nitrate content at the Oregon State University Central Analytical Lab using an automated cadmium reduction method (Gavlak et al., Reference Gavlak, Horneck and Miller2005). In 2007, soil samples were taken 51, 68, 80 and 101 days after incorporation (DAI) of the cover crops into the soil; in 2008, samples were taken 29, 47, 63, 88 and 98 DAI.
Broccoli yield
Within each treatment plot, a 6-m section of the center two rows was flagged for harvest. Within each harvest area, 15 heads at least 10-cm diameter were randomly selected, harvested and the total weighed. In 2007, broccoli was harvested on 3–6-day intervals from August 14 to 30 for a total of five cuttings. In 2008, broccoli was harvested 3–4-day intervals from August 26 to September 12, for a total of six cuttings.
Data analysis
All data were analyzed using SAS (SAS Institute, 2008) using PROC MIXED to determine treatment effects and LSMEANS statement with Tukey adjustment was used to calculate P values for pairwise comparisons. When the treatment effects are found to be significant, the pairwise comparison table is then presented to understand which treatment pairs are different. A repeated measures procedure was used to compare soil nitrate values among cover crop treatments. In addition, square root transformation was applied to soil nitrate values to equalize variances. To compare soil nitrate data, a square root transformation and a two-sample t-test with unequal variance was used. In the following, P-values were reported when testing the treatment effect, as well as the pairwise comparisons. In particular, the result is considered as statistically significant when its P-value is ≤0.10. We have chosen this null hypothesis rejection criteria to control the probability of type I errors (falsely declaring treatment means are different) to be 0.10, while trying to reduce the probability of type II errors (declaring there is no detectable difference between means) as much as possible.
Calculation of N fertilizer equivalence values for cover crop treatments
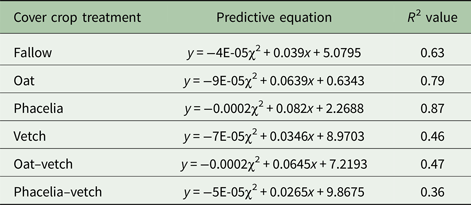
Quadratic regression analysis of broccoli yield (y) and the four N rates (x) for each cover crop treatment was conducted using data from individual plots. Using the quadratic regression equation for fallow treatment, its expected yield at 200 kg N ha−1 is calculated. Then using equations for each cover crop treatment, the required N fertilizer amount x is solved in the interval between 0 and 300 kg N ha−1 by substituting the expected yield of the fallow treatment for y. This generated a value for how much N fertilizer the cover crop treatment would require to equal the fallow treatment yield at 200 kg N ha−1. Nitrogen fertilizer equivalence (NFE) values were then calculated by subtracting the required N fertilizer amount from 200 kg ha−1. A graphic example of this method is shown in Figure 1, which plots the fitted quadratic regression function for the fallow and vetch cover crop treatments using year 2007 data. Because the regression equations were non-linear and the N fertilizer replacement values vary according to N fertilizer rate, the procedure described above was repeated for 100 kg N ha−1. However, the expected yields of PV and V are always higher than the fallow treatment yield at 100 kg N ha−1. Therefore, the required N fertilizer amounts for both PV and V are set to be zero and the corresponding NFE values are 100 kg N ha−1. Resulting equations for predicting broccoli yield from N fertilizer rate for each cover crop treatment are shown in Table 2.
A graphic illustration of the calculation of nitrogen (N) fertilizer equivalent values. For a selected N fertilizer rate (in this example 200 kg N ha−1), a vertical line is extended from the horizontal axis to the intersection with the line representing the quadratic relationship between N fertilizer rate and broccoli yield for the fallow treatment. A horizontal line is extended from this point to the intersection with the line representing the quadratic relationship between N fertilizer and broccoli yield and the vetch treatment. A vertical line is then dropped to the intersection with the horizontal axis. The horizontal difference between the two vertical lines is the N fertilizer equivalence.

Equations and R 2 values for predicting broccoli yield from nitrogen (N) fertilizer rate for the cover crop treatments, where y = broccoli yield and x = N fertilizer rate

Results and discussion
Cover crop biomass
Cover crop establishment differed between the 2 yr of the experiment, affecting cover crop biomass, N accumulation and broccoli yield. Cover crop establishment conditions in the fall of 2006 were nearly ideal, with warm soil conditions and supplemental irrigation following seeding, which enabled good seed germination and growth during a period of sunny and relatively warm weather. In the fall of 2007, however, cool and rainy conditions began in late September and continued into October, preventing proper soil preparation and delaying cover crop seeding. Cold and rainy weather continued after the cover crop seeding and through October, reducing cover crop germination, establishment and fall growth.
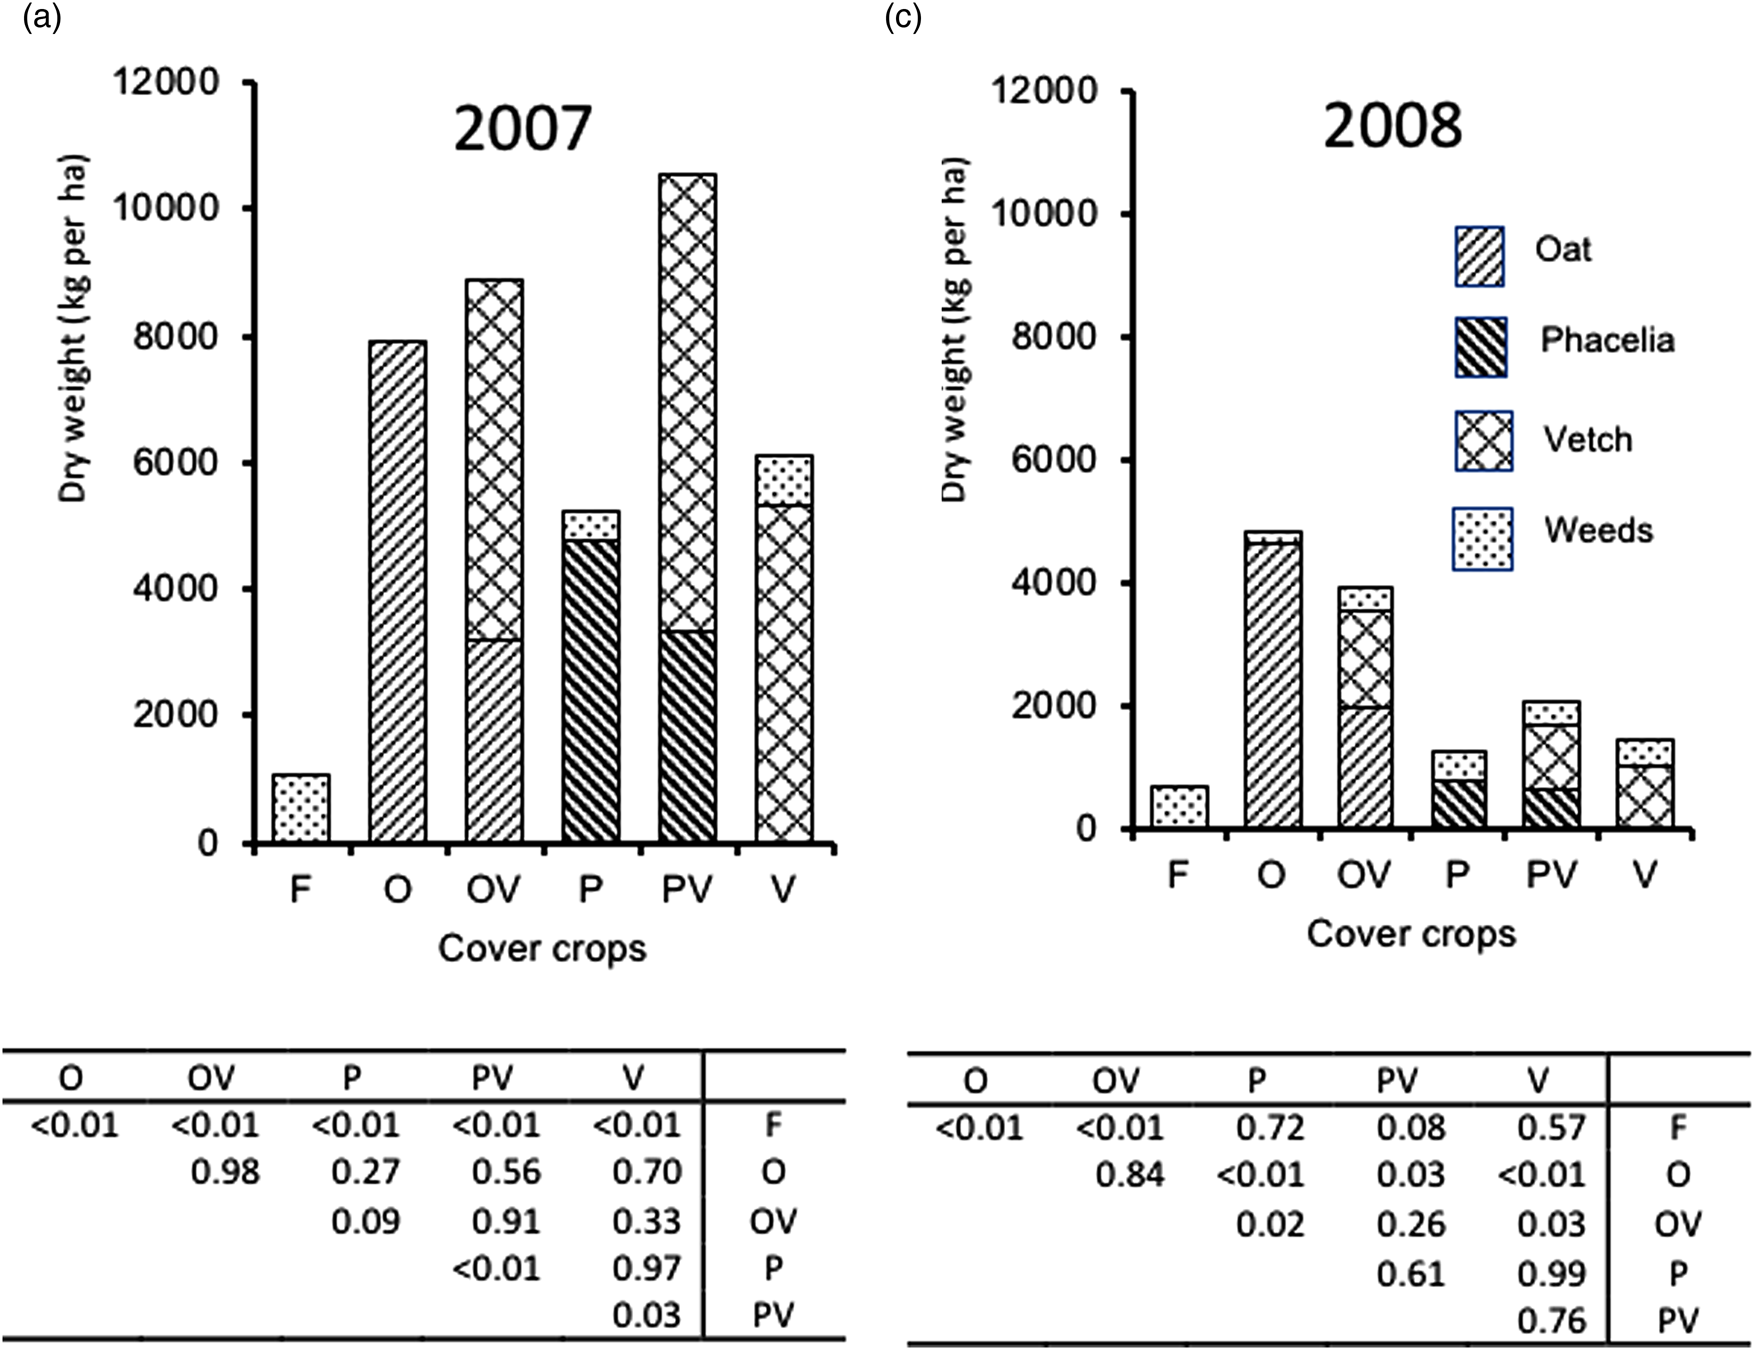
Analysis of variance (ANOVA) for both years showed significant cover crop effects (P < 0.01) for cover crop biomass accumulation. In 2007, the phacelia–vetch (PV) mixture produced a greater biomass than phacelia (P) (P < 0.01) and vetch (V) (P = 0.03), but was similar to the oat (O) (P = 0.56), and the oat–vetch mixture (OV) (P = 0.91) (Fig. 2A). Vetch made up more than 60% of the total biomass of both OV and PV mixtures. Whereas the vetch component added to the total biomass in the PV mixture, the oat component was reduced in the OV treatment, with the oat and oat–vetch mixture producing similar quantities of biomass (P = 0.98). This is likely due to the seeding rate of oats in the mixture, 45 kg ha−1, compared with the 90 kg ha−1 seeding rate for the oats grown as sole crop. Oats as a sole crop produced similarly to phacelia as a sole crop (P = 0.27).
Mean above-ground dry matter biomass (A) 2007 and (B) 2008. Cover crop treatments: F, fallow; O, oats; OV, oat–vetch; P, phacelia; PV, phacelia–vetch; V, vetch. Tables below the figures show the associated P-value tables to make pairwise comparisons of total biomass between cover crop treatments.

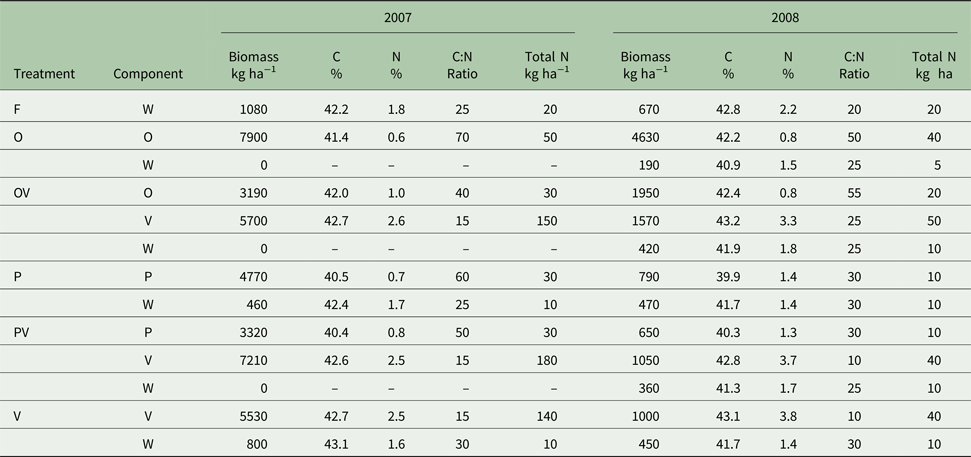
In 2008, total cover crop biomass was reduced by 69% compared with 2007 (Table 3). Biomass of both phacelia and vetch (in either mixtures or as sole crops) was reduced by 80% compared with 2007, whereas oat biomass and weed biomass in fallow plots were reduced by only 40%. In 2008, treatments O, OV and PV plots (P < 0.10) produced more biomass than the fallow, with P and V treatments not yielding more than the fallow (Fig. 2B). Oat and oat–vetch treatments produced similar amount of biomass (P = 0.84), with again vetch making up 40% of the total biomass of the mixture.
Mean estimates of cover crop biomass and percentage carbon and nitrogen content, 2007–2008

Treatments were: F, fallow and cover crops; O, oats; OV, oat–vetch; P, phacelia; PV, phacelia–vetch; V, vetch. W represents the weed component of each treatment; ‘−’ indicates zero or very low levels of weeds. For interpretive clarity, biomass values have been rounded to the nearest ten, total nitrogen values and C:N ratios rounded to the nearest five, and percentages of C and N have been rounded to the nearest 0.1%.
Year-to-year variation in cover crop growth and biomass (and N) accumulation is commonly observed in cover crop research and farmer practice (Kuo and Sainju, Reference Kuo and Sainju1998; Sainju et al., Reference Sainju, Whitehead and Singh2005; Schomberg et al., Reference Schomberg, Endale, Calegari, Peixoto, Miyazawa and Cabrera2006.) Factors can include previous crop rotation history (Mitchell et al., Reference Mitchell, Shrestha and Irmak2015), mineral nutrition, environmental, soil physical and biotic conditions (Fageria et al., Reference Fageria, Baligar and Jones2010), cover crop seed size (Cherr et al., Reference Cherr, Scholberg and McSorley2006), seeding rate (Brennan and Boyd, Reference Brennan and Boyd2012), time of planting (Akemo et al., Reference Akemo, Regnier and Bennett2000), planting methods (broadcast or drilled) (Hughes-Games and Bertrand, Reference Hughes-Games and Bertrand1991) and time of killing or desiccating the cover crop (Wagger, Reference Wagger1989; Clark et al., Reference Clark, Decker and Meisinger1994). In our study, the wet soil conditions before planting in the fall of 2007 interfered with good seedbed preparation for cover crop establishment, and cold wet conditions following planting likely reduced germination and crop growth.
Because inoculation of the vetch seeds with Rhizobium was inadvertently omitted during the seeding of the cover crop in October 2007, reduction in vetch biomass, N accumulation and N content could have occurred from the lack of root nodulation. However, the oat treatment was also reduced on 2008 by 40% compared with 2007, suggesting stand establishment and environmental factors may have the most significant factor reducing cover crop yields in the second year.
Cover crop N accumulation and concentration
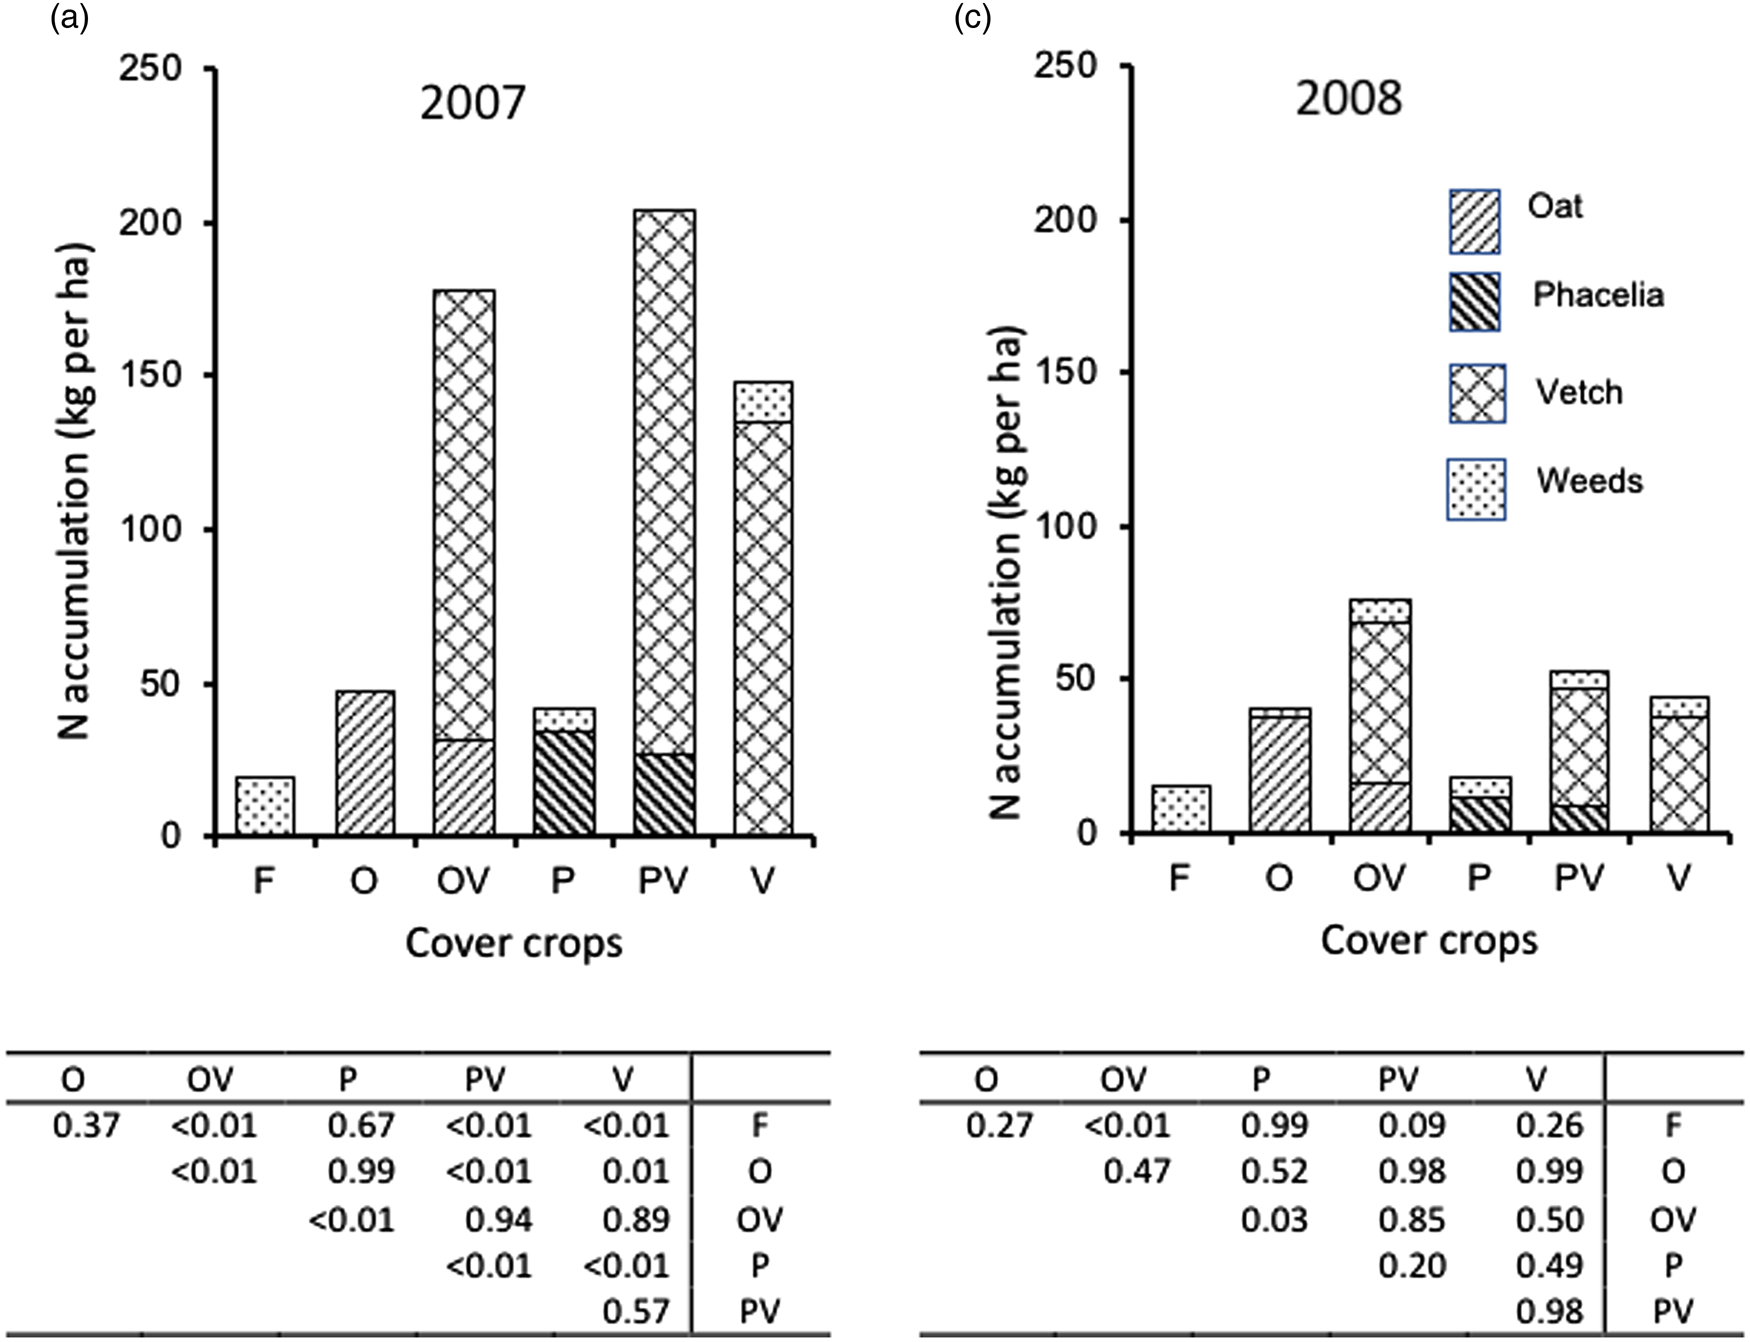
The ANOVA for both years showed significant cover crop effects (P < 0.01) for N accumulation. In 2007, N accumulation of OV, PV and V treatments was similar to each other, and higher than the fallow and the O and P treatments (Fig. 3A). Nitrogen accumulation in the cover crop treatments that included vetch (V, OV, PV) (140, 180, 210 kg ha−1, respectively) was at least three times higher than in the sole cover crops, O and P (50 and 30 kg ha−1) (Table 3). A majority of N in the mixtures was contributed by vetch. This follows the pattern of increased N accumulation in cereal–legume mixtures compared with cereal cover crops grown as a sole crop seen in other research (Sullivan et al., Reference Sullivan, Parrish and Luna1991; Ranells and Wagger, Reference Ranells and Wagger1996; Sainju et al., Reference Sainju, Whitehead and Singh2005).
Mean above-ground nitrogen (N) accumulation (A) 2007 and (B) 2008. Cover crop treatments: F, fallow; O, oats; OV, oat–vetch; P, phacelia; PV, phacelia–vetch; V, vetch. Tables below the figures show the associated P-value tables to make pairwise comparisons of total N accumulation between cover crop treatments.

The N concentration of the O and P cover crop treatments was relatively low (0.6 and 0.7%), and the C:N ratio (70) was relatively high. Vetch N concentrations were relatively constant (2.5–2.6%), regardless of being grown in a mixture or as a sole crop. In 2007, the N concentration of the oat component of oat–vetch mixtures (1.0%) was greater (P = 0.02) than that of oats grown as a sole crop (0.6%) (Table 3). Other authors (Sullivan et al., Reference Sullivan, Parrish and Luna1991; Ranells and Wagger, Reference Ranells and Wagger1996) have reported an increase in the N content of cereal rye grown with hairy vetch, suggesting the uptake of N released from the vetch roots.
In 2008, N accumulation was greatly reduced from 2007, reflecting the reduction in cover crop biomass described earlier. Only OV (P < 0.01) and PV (P = 0.09) treatments accumulated more N than the fallow. The effect of increased N concentration in the oats grown in a mixture with vetch compared with oats grown as a sole crop was not observed in 2008 as it was in 2007. Nitrogen concentration was identical in oats grown as a sole crop and in the oat component of the oat–vetch mixture (0.8%), and N concentration of phacelia grown as a sole crop (1.4%) was similar to that grown in the phacelia–vetch mixture (1.3%) (Table 3).
Cover crop effect on soil nitrate during broccoli growing season
The ANOVA for both years showed significant cover crop effects (P < 0.01) for total soil nitrate over the sampling period. In 2007, the vetch cover crop produced higher soil nitrate levels than the F, O and P, and PV cover crop treatments, but not more than the OV (P = 0.42) (Fig. 4A). Nitrate level of the fallow treatment was similar to the O (P = 0.70) and P (P = 0.95) treatments. Both the OV and the PV treatments had higher soil nitrate levels than the O and P treatments. These data follow similar trends as N accumulation among the cover crops in 2007.
Mean soil nitrate-N concentrations in cover crop treatments without added N fertilizer (A) 2007 and (B) 2008. Cover crop treatments: F, fallow; O, oats; OV, oat–vetch; P, phacelia; PV, phacelia–vetch; V, vetch. Tables below the figures show P values for pairwise comparisons between cover crop treatments.

In 2008, none of the cover crop treatments increased soil nitrate compared with the fallow (Fig. 4B). The addition of the vetch to the cover crop mixtures (OV and PV) increased soil nitrate compared with the oat (P = 0.09) and phacelia (P = 0.05) sole crops. Soil nitrate was reduced in the oat treatment compared with the fallow treatment (P = 0.08), and was less than all other cover crop treatments except phacelia (P = 0.25) (Fig. 4B). Because soil nitrate sampling did not begin until 51 days after soil incorporation of the cover crops in 2007 and 29 days in 2008, an important period of cover crop decomposition and soil mineralization dynamics was missing in this study.
In Denmark, Jensen (Reference Jensen1997) showed reduced soil inorganic N for first 28 days following soil incorporation for both field pea (P. sativum L.) and barley (Hordeum vulgare L.) cover crop residues compared with the control. Soil N levels in the pea treatment were greater than the control for the remainder of the 85-day sampling period; however, barley soil N levels remained below the control treatment during the entire sampling period. In experiments in Italy examining cover crop affects in organic tomato production, Lenzi et al. (Reference Lenzi, Antichi, Bigongiali, Mazzoncini and Tesi2009) compared one legume, pigeon bean (Vicia faba L. var minor) and four non-legume species, including an oat and barley mixture, rye, brown mustard (Brassica juncea L.) and a control. They found increases in soil nitrate only in the legume cover crop plots compared with the other cover crop treatments during one of the 2 yr of the study, with no differences among treatments in the other year. Wyland et al. (Reference Wyland, Jackson and Schulbach1995), comparing a rye cover crop to a fallow plot in California lettuce production, found soil nitrate suppression for up to 61 days after soil incorporation of the rye. Nitrogen immobilization from a rye cover crop was also reported by Rosecrance et al. (Reference Rosecrance, McCarty, Shelton and Teasdale2000).
Broccoli yield
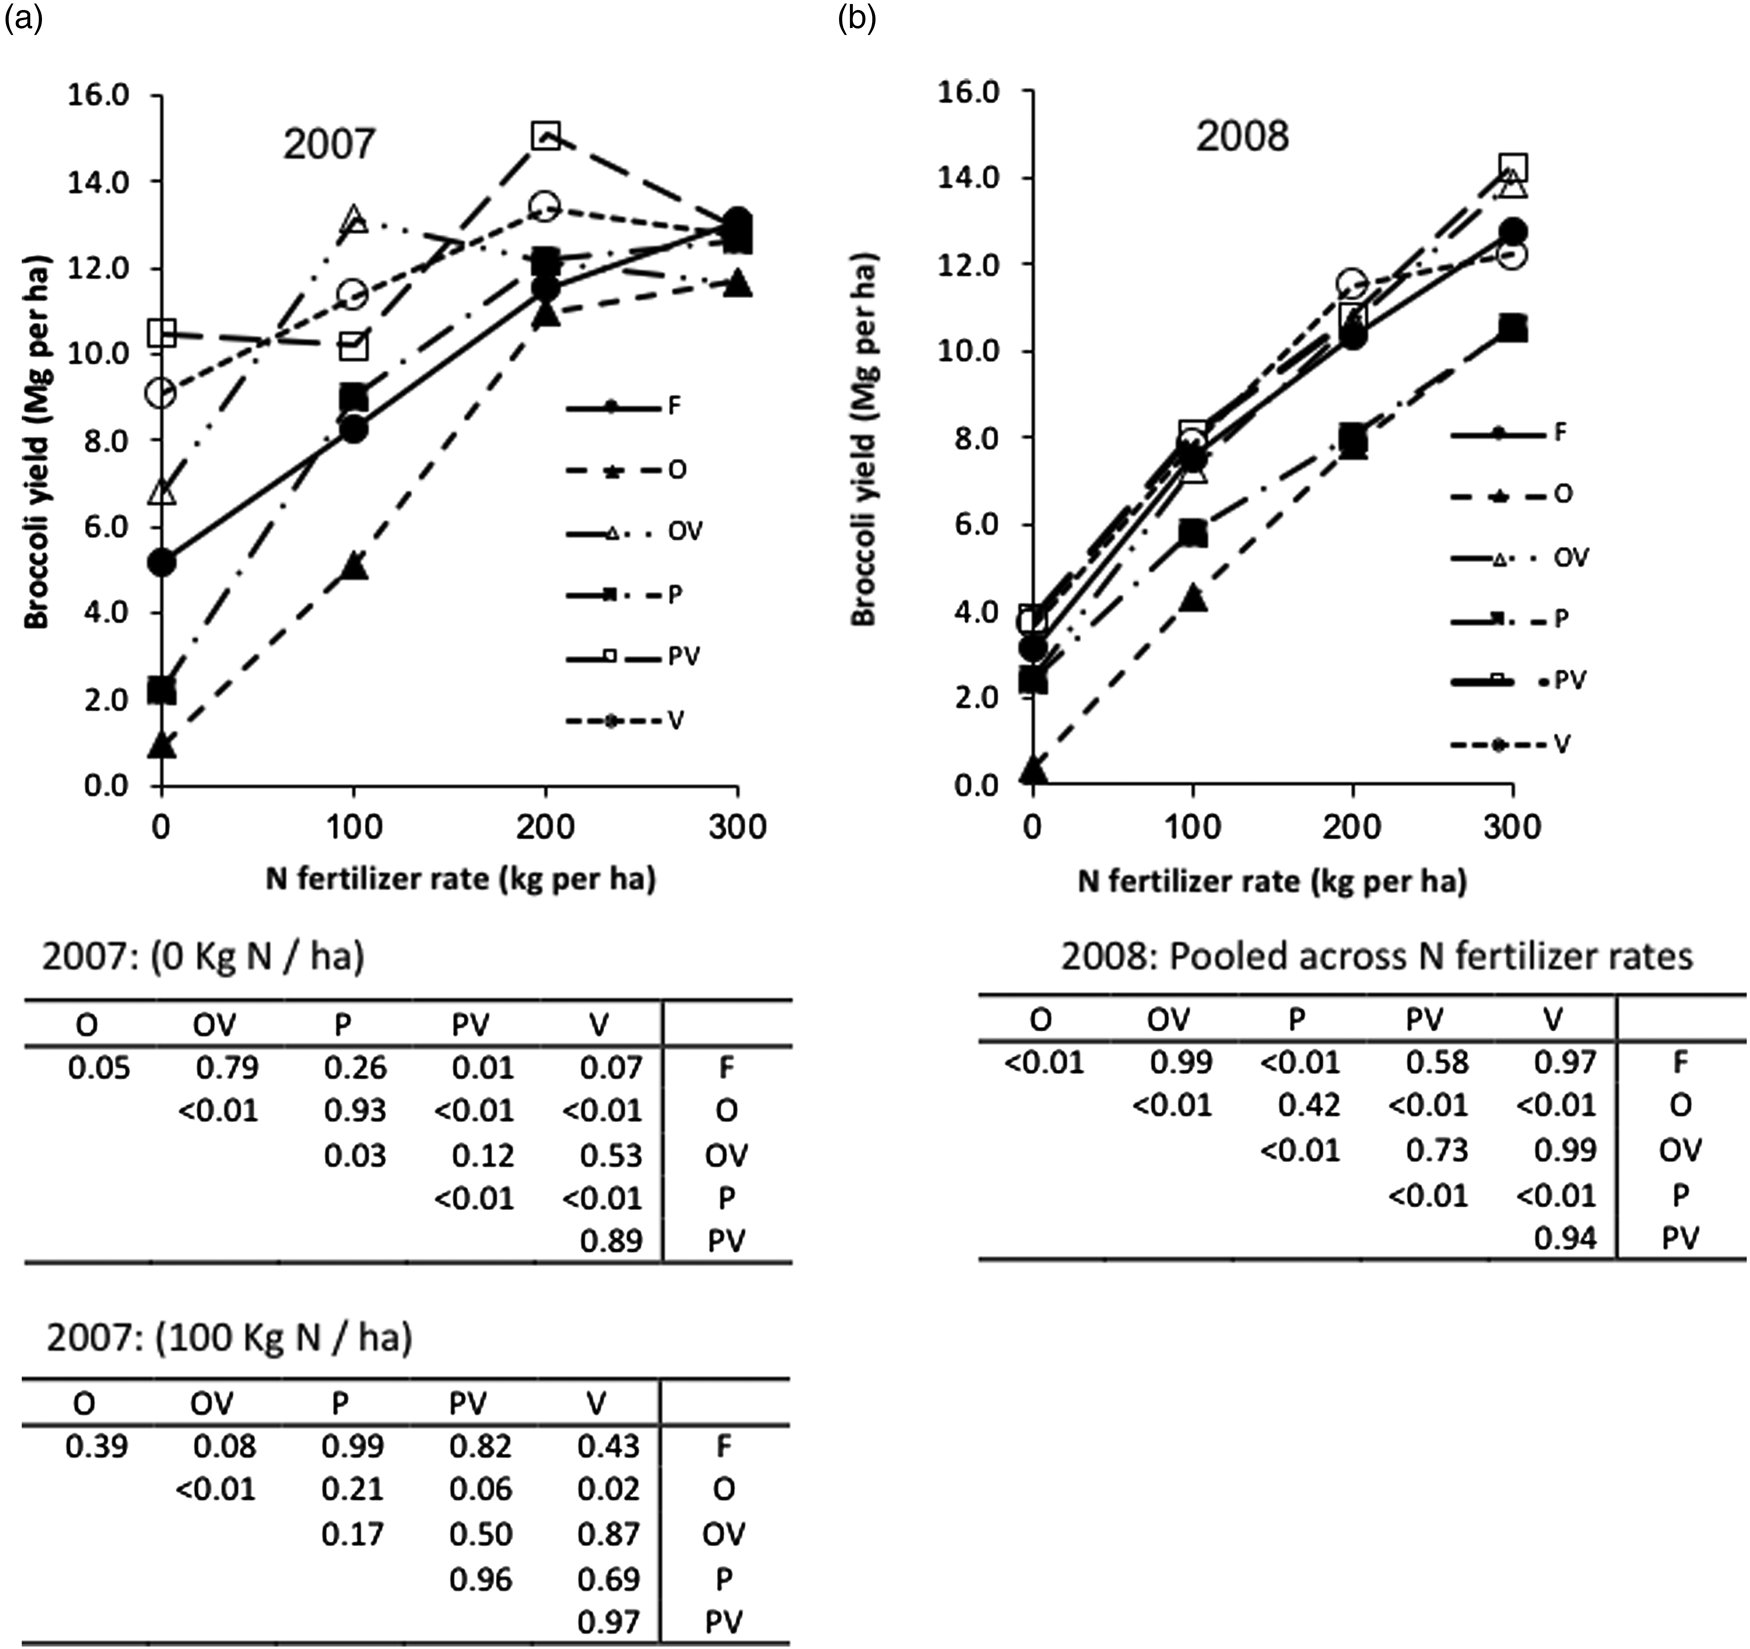
In 2007, both cover crop and N rate treatment effects were significant (P < 0.01), as was the interaction between cover crop treatment and N fertilizer rate (P < 0.01). Therefore, the cover crop and N fertilizer treatment effects were examined separately for each N rate. Significant cover crop effects on broccoli yield were observed only in the 0 and 100 kg N ha−1 treatments (P < 0.01).
At 0 kg N ha−1, broccoli yields were higher for PV and V compared with the fallow (P = 0.01, 0.07), but the OV treatment did not produce yields greater than fallow (P = 0.79) (Fig. 5A). All of the legumes and legume mixtures (V, OV and PV) produced higher broccoli yields than the sole crops O and P (P < 0.01). The oat treatment produced lower broccoli yield than the fallow treatment (P = 0.05), but yields from the phacelia treatment did not differ from the fallow (P = 0.26).
Cover crop and N fertilizer effects on broccoli yield, 2007 and 2008. Cover crop treatments: F, fallow; O, oats; OV, oat–vetch; P, phacelia; PV, phacelia–vetch; V, vetch. Tables below 2007 are the P-values for pairwise comparisons between cover crop treatments at 0 and 100 kg N ha−1. No pairwise comparisons were made for the 200 and 300 kg N ha−1 rates because analysis of variance revealed no significant cover crop effects at these rates. In 2008, no interaction was detected between cover crop treatments and N rates, thus data were pooled across N rates and analyzed for main effects.

At 100 kg N ha−1, only the OV treatment increased broccoli yield compared with the fallow (P = 0.08). The OV, PV and V treatments increased yield compared with the oat treatment (P = 0.01, 0.06, 0.02). Neither O nor P reduced yields compared with the fallow (P = 0.39, 0.99).
In 2008, both cover crop and N rate influenced broccoli yield (P < 0.01); however, no interaction between cover crop and N fertilizer rate was detected (P = .69). Therefore, data were pooled and analyzed by main effects. Nitrogen fertilizer increased broccoli yield at all rates used (Fig. 5B). The OV, PV and V treatments were similar and did not increase yields compared with the fallow treatment (P = 0.99, 0.58, 0.97). However, the legume and legume mixtures increased broccoli yield compared with O and P grown as sole crops (P < 0.01). Both the O and P treatments decreased broccoli yield compared with the fallow (P < 0.01).
NFE values
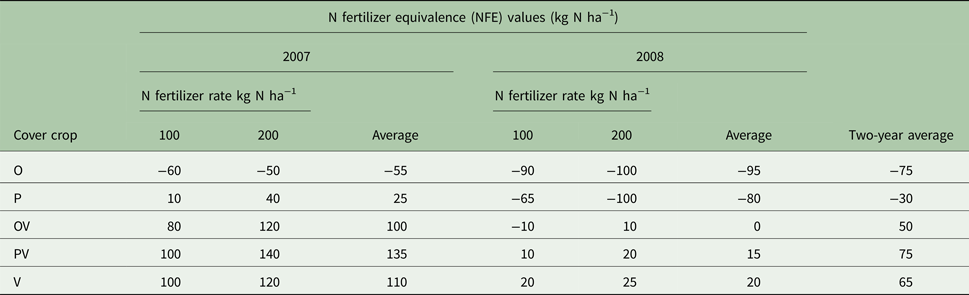
In 2007, NFE values were similar in the V, OV and PV treatments, ranging from 100 to 135 kg N ha−1 (Table 4). However, NFE values for the oat treatment at both the 100 and 200 kg N rates were negative, with an average fertilizer replacement value of −55 kg N ha−1. Negative NFE values suggest that immobilization of N has occurred. In this case, an estimated 55 kg N ha−1 of N fertilizer would be needed following the oat cover crop to bring broccoli yield up to the fallow with zero fertilizer. Phacelia as a sole crop produced an average NFE of 25 kg N ha−1.
Estimated N fertilizer equivalence (NFE) values for cover crop treatments, 2007–2008

Cover crop treatments: F, fallow; O, oats; OV, oat–vetch; P, phacelia; PV, phacelia–vetch; V, vetch. Values are rounded to nearest five. See text for the procedure for calculating NFE.
In 2008, NFE was consistently negative for both O and P treatments, averaging −95 and −80 kg N ha−1, respectively (Table 4). These values reflect the yield-suppressing effect of both cover crops on broccoli yields at all levels of N fertilizer. The OV treatment average NFE was 0 kg N ha−1, whereas the PV treatment produced a positive NFE value of 15 kg N ha−1. Vetch produced an average NFE value of 20 kg N ha−1. Across both years of the study, NFE values for O and P averaged −75 and −30 kg N ha−1 and OV, PV and V treatments averaged 50, 75 and 65 kg N ha−1, respectively.
These NFE values for vetch and vetch mixtures are consistent with the values from other studies (Smith et al., Reference Smith, Frye and Varco1987; Sullivan et al., Reference Sullivan, Parrish and Luna1991; Fageria et al., Reference Fageria, Baligar and Bailey2005; Gaskell and Smith, Reference Gaskell and Smith2007). Other studies in organic production systems have shown no crop yield increases if the cover crop mixtures contain low percentages of legume (Lawson et al., Reference Lawson, Fortuna, Cogger, Bary and Stubbs2013). Kuo and Sainju (Reference Kuo and Sainju1998) suggested that the cover crop mixture should contain at least 40% legume if residues are to increase N availability. High levels of residual N in the soil system from a previous history of organic soil management practices can also reduce legume cover crop impact on cash crop yields (Muramoto et al., Reference Muramoto, Smith, Shennan, Klonsky, Leap, Ruiz and Gliessman2011).
Conclusions
Our findings support many previous studies showing the ability of legumes and legume-based cover crop mixtures to provide substantial quantities of N to subsequent cash crops. In our study, the impact of legume-base cover crops on broccoli yield and NFE varied between years, with NFE values averaging 115 kg N ha−1 in 2007 and 18 kg N ha−1 in 2008. However, broccoli yield was suppressed in both years of our study following the oat grown as a sole crop, with NFE values of −55 kg N ha−1 in 2007 and −95 kg N ha−1 in 2008. These negative NFE values represent the amount of supplemental N fertilizer needed to equal the yield produced in the fallow treatment with zero N applied. The phacelia treatment produced positive NFE values of 25 kg N ha−1 in 2007, but negative NFE values of −80 kg N ha−1 in 2008. In both years of the study, the oat–vetch and phacelia–vetch mixtures improved broccoli yield compared with oats and phacelia grown as sole crops.
Quantities of biomass and N accumulated by the cover crops also varied between years, and had an obvious impact on N contribution to broccoli yield. For example, the oat–vetch mixture accumulated 180 kg N ha−1 in 2007, whereas only 70 kg N ha−1 was accumulated in 2007. The phacelia–vetch mixture accumulated 210 kg N ha−1 in 2007, and 70 kg N ha−1 in 2008. During the first year of our study, fall weather conditions were favorable for cover crop establishment, whereas in the second year, early fall rains interfered with preplant tillage and cover crop seeding. Cool conditions after planting also reduced cover crop emergence and establishment. Because of the need to control seeding rates in our small-plot research trials, broadcast hand-seeding was used both years of the study. Using a grain drill would likely have improved cover crop establishment and stand uniformity. However, regardless of environmental and seeding methods, our data suggest the advantage of legume-based cover crop mixtures over cover crops grown as sole crops. Legume-based cover crops could enhance cash crop yields under favorable environment and establishment conditions, with less or no risk of crop loss during years when weather is less favorable for cover crop growth.
Phacelia may be a promising cover crop for the maritime Pacific Northwest and other climates with relatively mild winters; however, in this study phacelia performed poorly in the second year. However, because it is a small-seeded crop compared with cereal grains, fall establishment and ground cover can take longer, reducing its primary role of covering and protecting the soil. Problems with establishment of other small-seeded cover crops such as clovers and medics were also noted by Cherr et al. (Reference Cherr, Scholberg and McSorley2006). In both years of our study, oats produced more total biomass than did phacelia, although N accumulation was similar. Additional research is needed to evaluate phacelia as an alternative to the more traditionally used cereal grains such as rye and oats.
Acknowledgements
We wish to thank the Oregon State University Department of Horticulture for financial and facilities support, Scott Robbins and Don Heinz-Cook for assistance in field plot preparation and irrigation, and the USDA Sustainable Agriculture Research and Education Program for funding.