Introduction
Mild cognitive impairment (MCI) is a common non-motor symptom of Parkinson's disease (PD) and is a risk factor for dementia (PDD) (Janvin et al., Reference Janvin, Larsen, Aarsland and Hugdahl2006; Broeders et al., Reference Broeders, de Bie, Velseboer, Speelman, Muslimovic and Schmand2013; Pedersen et al., Reference Pedersen, Larsen, Tysnes and Alves2013). Accurately, classifying PD-MCI status may enable clinicians and researchers to predict those PD patients at highest risk for eventual progression to PDD (Hobson and Meara, Reference Hobson and Meara2015) and allow for timely intervention strategies to prevent or delay PDD. A task force employed by the movement disorders society (MDS) recently developed PD-specific MCI criteria, which include a comprehensive neuropsychological assessment (Goldman et al., Reference Goldman, Holden, Ouyang, Bernard, Goetz and Stebbins2015). Strict Level II assessment requires performance information on two tests within five cognitive domains (attention/working memory, executive function, episodic memory, visuospatial, and language). PD-MCI occurs with 2+ impaired test scores (cut-offs range from 1–2 standard deviations (SD)) but preservation of functional ability.
Other generic cognitive scales or dementia screening tests that are less time-consuming may successfully discriminate PD-MCI and PDD, but their usefulness (i.e. compared to a neuropsychological battery) remains irresolute. Two that may be useful include: (a) the Clinical Dementia Rating Scale (CDR) which comprises interviews (with the patient and an informant) that assess the severity of dementia symptoms by evaluating cognitive and functional performance in memory, orientation, judgment, community affairs, home/hobbies, and personal care both objectively and subjectively (Morris, Reference Morris1993) and (b) the Dementia Rating Scale (DRS) which comprises an objective measurement of global cognitive function by assessing attention, initiation/preservation, construction, conceptualization, and memory (Strauss et al., Reference Strauss, Sherman and Spreen2006).
We classified PD and control (normally aging (NA)) participants as cognitively normal (CN), MCI, or demented (D) at three waves using Level II MDS criteria (with 1.5 and 2.0 SD cut-offs), the CDR, and the DRS. In all cases, we assessed (a) diagnosis and conversion rates, (b) the rate of overlap in classification between tests, and (c) the predictive ability of wave 1 classification for a global dementia outcome at wave 3. For MDS criteria, we additionally investigated (a) rate of multi- versus single-domain impairment, (b) cognitive domains most affected, and (c) Neuropsychiatric inventory (NPI) scores to determine the association between neuropsychiatric symptoms, MCI, and dementia (Cummings, Reference Cummings1994; Ismail et al., Reference Ismail2016).
Methods
Participants
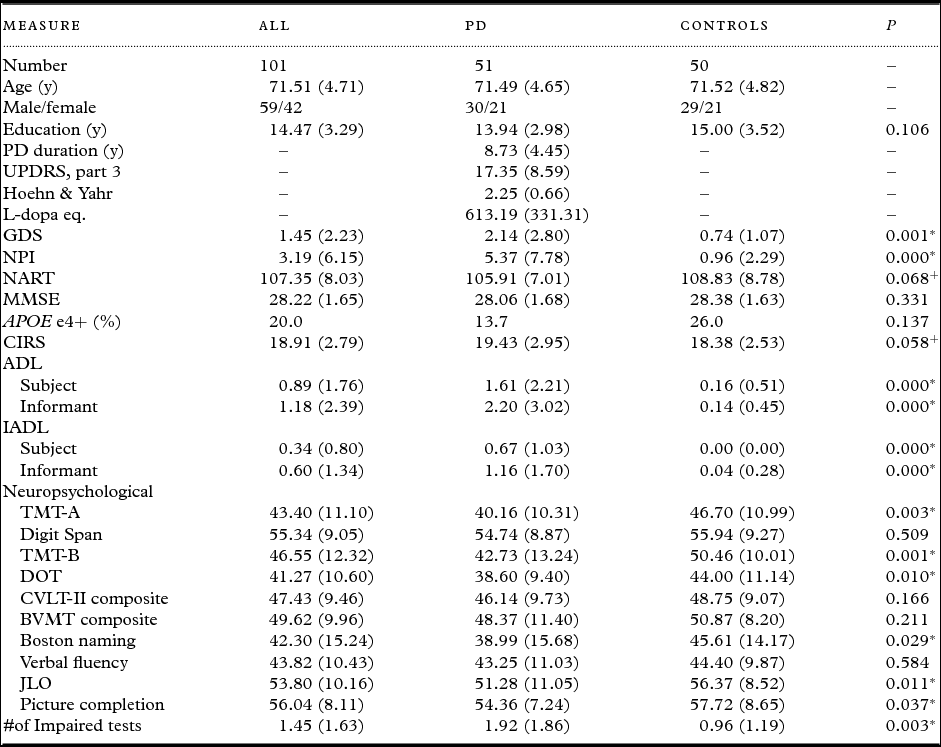
The data derived from a 36-month (3 wave) longitudinal study of 51 diagnosed PD patients and 50 age- and sex-matched healthy controls (Table 1). We confirmed PD diagnosis based on the presence of 2/3 signs of typical PD (rest tremor, bradykinesia, and rigidity) in the absence of atypical features at baseline. As previously described, controls were healthy and free of illnesses that would interfere with cognition or survival. They were recruited via contacts of the patients and from senior centers or clinics. Participants provided written-informed consent and the protocol was approved by the Health Research Ethics Board of the University of Alberta (Camicioli et al., Reference Camicioli2011). At each wave, participants underwent comprehensive neuropsychological testing when in an “on” state (when medications were effective). Five participants dropped out of the study altogether, and an additional two did not complete the neuropsychological battery at follow-up waves.
Baseline demographic and clinical characteristics of Parkinson's disease (PD) and control participants

Note: Neuropsychological test data is in T-scores. χ 2 p value is two-sided.
** p < 0.01; * p < 0.05; + p < 0.10. Abbreviations: PD, adults with Parkinson's disease; UPDRS, Unified PD Rating Scale; GDS, Geriatric Depression Scale; NPI, Neuropsychiatric Inventory; L-dopa, Levodopa; NART, North American Reading Test; MMSE, Mini-Mental State Exam; APOE e4, Apolipoprotein e4; CIRS, Cumulative Illness Rating Scale; ADL, Activities of Daily Living; IADL, Instrumental Activities of Daily Living; TMT-A, Trail Making Test part A; TMT-B, Trail Making Test part B; DOT, Digit Ordering test; CVLT-II, California Verbal Learning Test II; BVMT, Brief Visuospatial Memory Test; JLO, Judgment of Line Orientation.
Cognitive status
Neuropsychological Assessment
We aimed to classify participants as MCI or demented using the optimal testing battery recently recommended by the MDS (Goldman et al., Reference Goldman, Holden, Ouyang, Bernard, Goetz and Stebbins2015). Based on data availability, we used 7/10 recommended tests and substituted three (see Table S1 available as supplementary material attached to the electronic version of this paper at www.journals.cambridge.org/jid_IPG). Attention and working memory: Time taken to complete Trail Making Test, Part A and the total number of trials (forwards and backwards) correct on the Digit Span test (substituted). Executive function: Time taken to complete the Trail Making Test, Part B, and total score on the digit ordering test (substituted). Memory: We used both recommended measures but from slightly different tests: total free recall and long delay free recall on the California Verbal Learning Test II and number of figures correctly drawn and delayed recall on the brief visuospatial memory test (Litvan et al., Reference Litvan2012; Goldman et al., Reference Goldman, Holden, Ouyang, Bernard, Goetz and Stebbins2015). Language: Total score on the Boston naming test and number of unique animal names stated during category verbal fluency. Visuospatial function: Total score on the judgment of line orientation task and total score on the picture completion task (substituted).
Of the PD-MCI criteria proposed by the MDS (Litvan et al., Reference Litvan2012), we forwent the requirement of a subjective cognitive complaint as only memory-specific data (not relevant to PD-MCI (Goldman et al., Reference Goldman, Weis, Stebbins, Bernard and Goetz2012)) was available. Objective cognitive impairment was defined using the neuropsychological battery with two cut-off scores: 1.5 SD or 2.0 SD below age- (and, where possible, education) adjusted norms (see Table S1). MCI diagnosis required 2+ impaired test scores (within or across domains).
PD patients with dementia were excluded from participating in the study at baseline so PDD and NA-D were defined at waves 2–3. At each wave of data collection (independently of neuropsychological testing), a research coordinator and physician determined if participants were non-demented by conducting (a) semi-structured interviews with each patient and an informant and (b) functional scales addressing instrumental and basic activities of daily living. Those with dementia at wave 1 were excluded from the study. For participants classified as PDD with MDS criteria, objective cognitive impairment was defined the same way as MCI; that is, patients were required so show persistent cognitive impairment (2+ impaired test scores within or across domains) we additionally applied the Level II MDS PDD criteria (Emre et al., Reference Emre2007): diagnosis of PD before onset of dementia, MMSE score < 26, no major depression, impacted ADLs, and objective cognitive impairment. Functional impairment was defined as a decline by two or more points from baseline on the 7-item OARS IADL scale (subject and informant). We chose the IADL scale as they are more sensitive than ADLs and likely to be related to cognitive function. Because functional impairment can be initially affected by PD-related motor symptoms but later impairment may reflect cognitive change (Sabbagh et al., Reference Sabbagh2005; Shulman, Reference Shulman2010), we reasoned decline in IADL performance would be a good indicator of cognitive effects on ADL (Abdulaziz et al., Reference Abdulaziz2015).
Clinical Dementia Rating (CDR)
A CDR score of 0.5 is considered appropriate to define PD-MCI (Goldman et al., Reference Goldman and Litvan2011; Wyman-Chick and Scott, Reference Wyman-Chick and Scott2015). Therefore, participants were classified as MCI if they had a CDR (subject) and CCDR (informant) (Morris, Reference Morris1993) score of 0.5, integrating our independent interviews of the patient and informant. A score ≥ 1 is more useful in PDD patients (Wyman-Chick and Scott, Reference Wyman-Chick and Scott2015), therefore participants with a CDR or a CCDR score of 1+ were considered demented.
Dementia Rating Scale (DRS)
Other studies have employed DRS cut-off scores ranging from 137–140 (max. = 144) to classify PD-MCI (Villeneuve et al., Reference Villeneuve, Rodrigues-Brazete, Joncas, Postuma, Latreille and Gagnon2011; Matteau et al., Reference Matteau, Dupre, Langlois, Provencher and Simard2012; Pirogovsky et al., Reference Pirogovsky2014). We employed a cut-off score of 137 (i.e. scores ≤ 137) (Pirogovsky et al., Reference Pirogovsky2014) as we desired a balance between sensitivity and specificity. The DRS has been established as a useful tool for PDD diagnosis with a cut-off of ≤ 123 (Aarsland et al., Reference Aarsland, Andersen, Larsen, Lolk, Nielsen and Kragh-Sorensen2001; Llebaria et al., Reference Llebaria2008).
Neuropsychiatric symptoms
We used the NPI to assess behavioral symptoms (Cummings, Reference Cummings1994). The inventory uses scripted questions to assess the presence of delusions, hallucinations, aggression, dysphoria, anxiety, euphoria, apathy, disinhibition, irritability, abhorrent motor symptoms, night time disturbances, and eating abnormalities based on a care-giver interview. We used total score, which was calculated based on the frequency and severity of each symptom.
Results
Baseline PD and control participant demographic, clinical, and neuropsychological characteristics are presented in Table 1.
Baseline classification and outcome based on MDS 1.5, MDS 2.0, CDR, and DRS criteria
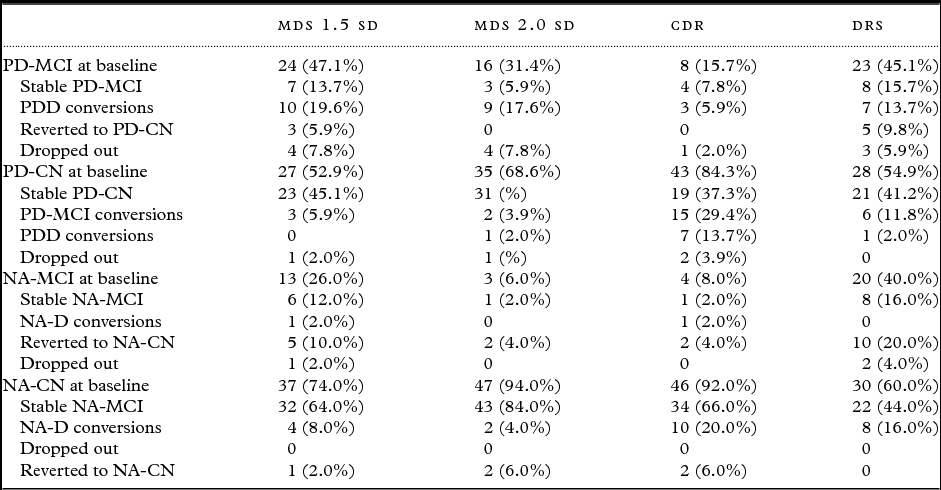
Full results of classification and conversion for each criterion are presented in Table 2. With MDS 1.5 criteria at baseline, 24 PD participants were classified as MCI (seven remained stable, ten declined to PDD, four dropped out, and three reverted to PD-CN), 27 PD participants were PD-CN (23 stable, 3 declined to PD-MCI, 1 dropped out); 13 controls were NA-MCI (five reverted, six stable, one declined, one dropped out), and 37 controls were NA-CN (32 stable, 4 declined to NA-MCI, 1 dropped out). Three-year progression rates from MCI to dementia were 41.7% for PD and 7.7% for NA.
Rates of cognitive status and decline based on classification criteria

Note: Drop-outs include those that dropped out for W2 and W3; five participants dropped out of the study altogether and an additional two did not complete the neuropsychological testing. Those that dropped out at W3 are not included as drop-outs and their cognitive status is noted. Participants that are, for example, CN at W1, MCI at W2, and CN at W3 are considered stable as CN. Abbreviations: MDS, Movement Disorders Society; SD, standard deviation; CDR, Clinical Dementia Rating scale; DRS, Dementia Rating Scale; PD-MCI, Parkinson's disease mild cognitive impairment; PDD, Parkinson's disease dementia; PD-CN, Parkinson's disease cognitively normal; NA-CN, normal aging cognitively normal.
With MDS 2.0 criteria at baseline, 16 PD participants were classified as MCI (three stable, nine declined, four dropped out), 35 PD participants were PD-CN (31 stable, two declined to MCI, one declined to PDD, one dropped out); three controls were NA-MCI (one remained stable and two reverted), and 47 controls were NA-CN (43 stable, two declined to MCI, two dropped out). Three-year progression rates from MCI to dementia were 56.3% for PD and 0% for NA.
With the CDR at baseline, eight PD participants were classified as PD-MCI (four stable, three declined, one dropped out), 43 PD participants were PD-CN (19 stable, 15 declined to PD-MCI, 7 declined to PDD, 2 dropped out); four controls were NA-MCI (one stable, one declined, two reverted), and 46 controls were NA-CN (34 stable, 10 converted to MCI, and 2 dropped out). Three-year progression rates from MCI to dementia were 37.5% for PD and 25.0% for NA.
With the DRS at baseline, 23 PD participants were classified as MCI (eight stable, seven declined, five reverted, three dropped out), 28 PD participants were PD-CN (21 stable, 6 declined to PD-MCI, 1 declined to PDD); 20 controls were NA-MCI (eight stable, ten reverted, two dropped out), and 30 controls were NA-CN (22 stable, 8 declined to MCI). Three-year progression rates from MCI to dementia were 30.4% for PD and 0% for NA.
Classification comparison: MDS, CDR, and DRS
We compared baseline participants classified with MDS criteria (1.5 or 2.0) with that of the CDR and DRS. MDS 1.5 and CDR classified 57% of PD participants the same and 74% of NA participants the same. MDS 1.5 and DRS classified 78% of PD participants the same and 70% of NA participants the same. MDS 2.0 and CDR classified 73% of PD participants the same and 90% of NA participants the same. MDS 2.0 and DRS classified 78% of PD participants the same and 66% of NA participants the same. Wave 2 and 3 classification overlap rates (%) remained similar.
Prediction of MD-diagnosed dementia
As described in the supplementary material (and summarized in Table S2), we additionally tested how well classification with the MDS, CDR, DRS at wave 1 would predict cognitive status at wave 3 using a common outcome (dementia diagnosis by a clinician using modified DSM-IV criteria). Briefly, we found that (a) with MDS 1.5 criteria at wave 1, PD-CN status predicted stability 77.8% of the time and PD-MCI status predicted PDD or attrition 70.8% of the time; (b) with MDS 2.0 criteria at wave 1, PD-CN status predicted stability 80.0% of the time and PD-MCI status predicted PDD or attrition 100.0% of the time; (c) with the CDR at wave 1, PD-CN status predicted stability 60.5% of the time and PD-MCI status predicted PDD or attrition 75.0% of the time; and (d) with the DRS at wave 1, PD-CN status predicted stability 75.0% of the time and PD-MCI status predicts PDD or attrition 69.5% of the time.
MCI subtype classification with MDS criteria
Rate of multi- versus single-domain impairment
For PD-MCI at baseline, multiple domain impairment was more frequent than single domain impairment, occurring in 91.9% (MDS 1.5) and 87.5% (MDS 2.0) of subjects. For NA-MCI at baseline, multiple domain impairment was also more frequent, occurring in 92.3% (MDS 1.5) and 66.7% (MDS 2.0) of subjects.
Cognitive domains most affected
For PD-MCI participants, the two most frequently impaired domains were executive function (91.7% for MDS 1.5 (n = 24) and 75.0% for MDS 2.0 (n = 16)) and language (66.7% for MDS 1.5 and 81.3% for MDS 2.0). For NA-MCI participants classified with MDS 1.5 (n = 17), the two most frequently impaired domains were executive function (69.2%) and language (69.2%). For NA-MCI participants classified with MDS 2.0 (n = 5), the two most frequently impaired domains were attention and working memory (100%) and executive function (66.7%).
Neuropsychiatric Inventory Scores
We first compared average total NPI scores for control and PD participants classified as CN and MCI with MDS 1.5 criteria at Wave 1. PD-MCI participants (n = 24) had an average NPI score of 6.08 (range = 0–29) whereas PD-CN (n = 27) had an average NPI score of 4.74 (range = 0–23). NA-MCI participants (n = 13) had an average NPI score of 0.62 (range = 0–4) whereas NA-CN (n = 37) had an average NPI score of 1.08 (range = 0–13).
Next, we compared NPI scores of PD-MCI participants at baseline with each classification criteria: MDS 1.5 (n = 24) NPI = 6.08 (range = 0–29); MDS 2.0 (n = 16) NPI = 4.81 (range = 0–23); CDR (n = 8) NPI = 7.00 (range = 0–23); and DRS (n = 23) NPI = 5.74 (range = 0–26).
Last, we compared the NPI scores of those participants that remained stable as PD-CN or PD-MCI over three years versus those that declined, as determined with MDS 1.5 criteria. Participants classified as (a) stable PD-CN over three years (n = 23) had an average NPI score of 4.50 (range = 0–23); (b) stable PD-MCI over three years (n = 7) had an average NPI score of 9.71 (range = 0–29); and (c) PD-MCI at baseline but declined to PDD or dropped out over three years (n = 15) had an average NPI score of 5.00 (range = 0–23).
Discussion
Our results highlight the predictive variability resulting from use of different PD-MCI criteria. Notably, we found that cognitive status and outcome are differentially diagnosed depending on both test and cut-off score. Our results imply that diagnostic criteria must be further refined and standardized in research and clinical practice. Among the four screening procedures – MDS 1.5, MDS 2.0, CDR, and DRS – classification agreement ranged from 57%–90% and correct prediction of a global outcome ranged from 57%–100%. Therefore, our results suggest the screening measure used can affect initial cognitive classification (for up to 50% of patients) and predictive ability of the current diagnosis.
Aspects of our study support previous research investigating the PD-MCI phenomenon. We demonstrated that PD-MCI (a) is frequent, (b) increases the risk of PDD, regardless of criteria applied, and (c) affects multiple cognitive domains (Janvin et al., Reference Janvin, Larsen, Aarsland and Hugdahl2006; Pedersen et al., Reference Pedersen, Larsen, Tysnes and Alves2013). Notably, being PD-MCI at baseline increased the risk of PDD: (a) with MDS 1.5 criteria, 41.7% of PD-MCI participants at baseline developed PDD within three years and (b) with MDS 2.0 criteria, 56.3% of PD-MCI participants at baseline progressed to PDD. In these instances, we used persistent impairment by neuropsychological testing along with additional criteria for PDD (Emre et al., Reference Emre2007). Our data also show similar findings using CDR based or DRS based criteria for MCI and dementia. A recent study similarly used MDS criteria to define PD-MCI; they found that only 21% of PD-MCI participants (identified with a 1.5 SD cut-off) converted to PDD within four years (Wood et al., Reference Wood2016). However, the prevalence of PD-MCI in our sample at baseline was higher than we expected based on previous reports on early stage patients (e.g. Broeders et al., Reference Broeders, de Bie, Velseboer, Speelman, Muslimovic and Schmand2013) and may reflect (a) our choice of testing battery, (b) no requirement for subjective cognitive complaints, or (c) the more advanced stage of PD. Furthermore, we examined already established PD patients 65 years of age and older, likely enriching our sample for those at-risk for cognitive decline. In our study, no participants classified as PD-CN at baseline progressed to PDD, implying that cognitively-normal PD patients are likely to remain dementia-free for at least three years.
We investigated the ability of cognitive status at wave 1 – defined by the MDS (1.5 and 2.), CDR, an DRS – to predict a globally defined dementia outcome (diagnosis by a clinician using modified DSM-IV criteria) at wave 3 in PD participants. These are criteria used in our previous published studies (Camicioli et al., Reference Camicioli2011). Our results suggest MDS 2.0 criteria have the most sensitivity and specificity. Specifically, PD-MCI classification at wave 1 predicted PDD three years later 87.5% of the time and PD-CN classification at wave 1 predicted cognitive stability 80.0% of the time. Additionally, there were no participants classified as PD-MCI at wave 1 that reverted at wave 3. Like recent research by Goldman and colleagues (Reference Goldman, Weis, Stebbins, Bernard and Goetz2012, Reference Goldman, Holden, Ouyang, Bernard, Goetz and Stebbins2015), our results suggest that, when a common dementia outcome is used, the Level II MDS optimal testing battery with PD-MCI impairment defined as 2.0 standard deviations below norms in 2+ tests will provide a good estimate of the risk of future dementia.
Of note, we did not formally compare the different approaches to classification (e.g. with a kappa estimation) given our limited sample sizes. With our combined descriptive results, we suggest that either MDS 1.5 or MDS 2.0 criteria seem worthwhile in moving forward with future testing for PD-MCI. The MDS 2.0 criteria are stricter than those suggested in recent research (Hoogland et al., Reference Hoogland2017) but may increase the predictive specificity of PD-MCI diagnosis (Liepelt-Scarfone et al., Reference Liepelt-Scarfone2011). Our findings lend some support for the use of the DRS if resources and time are limited.
NPI results suggest that neuropsychiatric symptoms are very common in patients without dementia but with PD and are related to cognitive status but not necessarily predictive of future cognitive decline. Specifically, we found that neuropsychiatric symptoms are common, and perhaps more common in those with MCI. Previous research has indicated that the majority of PD patients display neuropsychiatric symptoms (Petrovic et al., Reference Petrovic, Stefanova, Ziropadja, Stojkovic and Kostic2016). Leroi and colleagues (Reference Leroi, Pantula, McDonald and Harbishettar2012) specifically looked at the percentage of individuals with an NPI score greater than four (indicating clinically significant neurobehavioral difficulties) and compared the results between PDD, PD-MCI, and PD-CN. The percentage differentiated PDD from PD-CN and PD-MCI but not the latter from each other. However, neurobehavioral difficulties may be more pronounced in PD-MCI patients with memory impairment (Monastero et al., Reference Monastero, Di Fiore, Ventimiglia, Camarda and Camarda2013). Notably, all three studies mentioned here suffer from heterogeneity in PD-MCI cognitive assessment.
Although we could not do reliable statistics given sample heterogeneity and, in some cases, small sample sizes, our results inform further exploration of the overlap between cognitive and behavioral symptoms. Our study and those in the literature support a possible neuropsychiatric prodrome to cognitive decline in PD in parallel to the emerging evidence of neuropsychiatric prodromes to all cause dementia (Ismail et al., Reference Ismail2016). The NPI may not be the ideal inventory for prodromal dementia and other assessment instruments may be better, but require further validation in PD (Ismail et al., Reference Ismail2017). Specifically, the mild behavioral impairment checklist was developed with domain scores in mind so will likely be informative with similar longitudinal data.
Strengths included our (a) comprehensive neuropsychological testing, (b) well-defined and expert-diagnosed PD participants (at baseline), (c) age- and sex-matched control participants, and (d) longitudinal dataset. Limitations include a relatively small sample therefore low power for within group comparisons. Large longitudinal studies to determine optimal and efficient ways of diagnosing cognitive impairment and their relationship to neuropsychiatric symptoms in PD patients are recommended.
In conclusion, our results explore the utility of MDS PD-MCI classification criteria in comparison to global cognitive measures. Our study compares MDS recommended criteria to results that would be obtained using two other approaches (CDR or DRS). These offer practical alternatives to the neuropsychological test-based approach, which have been helpful in dementia prediction in PD (Hoogland et al., Reference Hoogland2017). The MDS 1.5 criteria and the DRS using the cut-off (137) shared similar sensitivity and specificity and could be used together in practice. Alone, MDS 2.0 criteria may be the most specific in predicting risk of PDD. We also examined total neuropsychiatric burden and show that this seems to be common in patients regardless of cognitive status. A unique feature of our study is we are able to contrast findings in PD with community controls. We emphasize the need for further refinement and standardization of such criteria, possibly by accounting for multiple scores (e.g. the MDS and CDR) and neurobehavioral symptoms (e.g. the NPI). Clinical, imaging, and bio-markers and measures that best predict those PD patients at risk of meaningful cognitive decline are needed, but definitions of PD-MCI may require further refinement.
Conflicts of interest
None.
Description of authors’ roles
K. L. McDermott, N. Fisher, and R. Camicioli designed the study. K. L. McDermott conducted the analyses and drafted the manuscript. R. Camicioli and N. Fisher supervised data collection and R. Camicioli supervised analyses. S. Bradford was involved in gathering and processing data. N. Fisher, S. Bradford, and R. Camicioli revised and approved the final version of the manuscript.
Acknowledgments
This work was supported by the Canadian Institutes of Health Research. We acknowledge all of the research assistant and psychometrists who were involved in data gathering and the clinical staff of the Movement Disorders Program for their assistance with recruitment. We also acknowledge Dr. Wayne Martin, the Movement Disorder Program director.
Supplementary material
To view supplementary material for this article, please visit https://doi.org/10.1017/S1041610217002265.