


Since the earliest civilizations, clay has been an essential material for the manufacture of utilitarian objects, pottery and building materials. Worldwide, more than a third of the population still depends on clay-based products due to their robustness, mouldability and versatility (Oumar et al., Reference Oumar, Gilbert François, Bertrand, Nathanael, Constantin, Simon and Jacques2022). The suitability of clay materials for construction and ceramics applications depends on their crystal structure, mineralogical composition, geochemical composition and geotechnical properties (Zghal et al., Reference Zghal, Medhioub and Mhiri2012; Boukili et al., Reference Boukili, Lechheb, Ouakarrouch, Dekayir, Kifani-Sahban and Khaldoun2021; Guin et al., Reference Guin, Singh and De2025; Singh et al., Reference Singh2025). Geological processes such as sedimentation, erosion and diagenesis also generate considerable heterogeneity in their characteristics, requiring extensive characterization to optimize their use (Tarik et al., Reference Tarik, Abdelmjid, Kabbaj, Elkouali, Bennamara, Charrouf and Talbi2014).
Given this global context, the interest in clay materials has also grown in Morocco, where numerous studies have focused on the mineralogical composition, particle-size distribution, plasticity and technological performance of local clays, aiming to improve their quality and enlarge their fields of application (Guerraoui et al., Reference Guerraoui, Zamama and Ibnoussina2009; Laila et al., Reference Laila, Akdim, Akhrif, Lakrim, Omar, Chaouni and Jabrane2013; Javaux et al., Reference Javaux, Fagel, Hatert, Collin, Daoudi, Akodad and El Ouahabi2013; El Ouahabi et al., Reference El Ouahabi, Daoudi, de Vleeschouwer, Bindler and Fagel2014a,Reference El Ouahabi, Daoudi and Fagelb, Reference El Ouahabi, Daoudi, Hatert and Fagel2015; El Boudour El Idrissi et al., Reference El Boudour El Idrissi, Daoudi, El Ouahabi, Balo Madi, Collin and Fagel2016a,Reference El Boudour El Idrissi, Daoudi, El Ouahabi and Fagelb, Reference El Boudour El Idrissi, Daoudi, El Ouahabi, Collin and Fagel2018; Mesrar et al., Reference Mesrar, Lakrim, Akdim, Benmar, Sbai and Jabrane2017; Nasri et al., Reference Nasri, Azdimousa, Hammouti and Abdelilah2017; El Halim et al., Reference El Halim, Daoudi, El Ouahabi, Amekrane and Fagel2018a,Reference El Halim, Daoudi, Rousseau, Cools, El Ouahabi and Fagelb; Habiballah et al., Reference Habiballah, Witam, Ibnoussina and Duc2023b). Such contributions highlight the importance of a thorough characterization approach to support the sustainable development of national resources. As part of this national dynamic, the clay materials in the Safi basin hold particular importance due to their historical role in the development of ceramics, an activity that is emblematic of the region (El Ouahabi et al., Reference El Ouahabi, El Boudour El Idrissi, Daoudi, El Halim and Fagel2019). Despite their economic and heritage significance, scientific research specifically addressing the suitability of the Safi clays for ceramic production remains limited. The existing work has mainly focused on the geological and geomorphological aspects of the Safi basin (Guerraoui et al., Reference Guerraoui, Zamama and Ibnoussina2008; Karim et al., Reference Bennani Karim, Mounir, Hachkar, Bakasse and Yaacoubi2010; El Ouahabi et al., Reference El Ouahabi, El Boudour El Idrissi, Daoudi, El Halim and Fagel2019; Harech et al., Reference Harech, Mesnaoui, Abouliatim, Elhafiane, Benhammou and Abdelmjid2020; Habiballah et al., Reference Habiballah, Witam and Ibnoussina2023a,Reference Habiballah, Witam, Ibnoussina and Ducb), without providing a detailed assessment of the technological potential of the Safi clay materials. Beyond these general geological contributions, a few studies have focused on more specific properties of the Safi clays; however, they remain insufficient to characterize their ceramic suitability. Indeed, some research has focused on very specific aspects, such as their use in adsorption processes (Bennani Karim et al., Reference Bennani Karim, Mounir, Hachkar, Bakasse and Yaacoubi2010), the characterization of Jurassic–Cretaceous clay formations (Echajia et al., Reference Echajia, Hajjaji and Kacim2003) and the mineralogical and physicochemical analysis of certain facies (Elataoui et al., Reference Elataoui, Harech, Qobay, Elbinna, Aouad, Waqif and Saadi2024). However, these previous studies remains fragmentary; they have addressed only a limited range of resources, used a restricted number of samples or investigated very specific uses. To date, no study has proposed an integrated approach combining mineralogical, geochemical and geotechnical analyses to comprehensively assess the suitability of these clays for modern ceramic production. The results of the current study demonstrate the technological potential of Safi clays as valuable raw materials for the ceramics industry while providing practical guidance for artisans and industrial stakeholders in evaluating the suitability and sustainable utilization of local clay resources for ceramic production.
Study area
Location and geological settings
Safi, located at a latitude of 32°19’N and a longitude of 9°14’W, lies along the Atlantic coastline, ∼157 km north-west of Marrakech (Fig. 1a). The study area is characterized by a predominantly flat landscape, with the highest elevations reaching up to 500 m.
Geographical and geological setting of the study area: (a) geographical setting of Morocco and Safi province; (b) geological map.

Figure 1 Long description
A) The map shows the geographical setting of Morocco, highlighting Safi province in red. Safi is located along the Atlantic Ocean, northwest of Marrakech. B) The geological map of Safi displays various formations with a detailed legend. The legend includes categories such as Upper Hauterivian, Hauterivian limestone of Dridrat, Lower Hauterivian brown clay, Upper Jurassic limestone and gypsum, Quaternary lithified dunes, Marine Pliocene sandstone, Villafranchian lithified dunes and others. Sampling sites are marked with symbols like stars and circles, indicating locations such as Safi Mellah, Safi Khella and others. Spatial distribution shows Upper Hauterivian concentrated in the central region, while Quaternary lithified dunes are prevalent along the coast. Marine Pliocene sandstone is found near the coastline and Villafranchian lithified dunes are scattered inland. Sampling sites are distributed across various geological formations.
The Safi sedimentary basin, located along the Atlantic margin of north-western Morocco, belongs to the Moroccan Coastal Meseta and is characterized by Mesozoic to Cenozoic sedimentary formations (Fig. 1b). Comprehensive geological investigations in the Safi basin have allowed the delimitation of six distinct formations, with lateral variation in thickness and facies. The stratigraphic column of the study area (Fig. 1c) comprises, from base to top, the following succession: the evaporitic complex of the Terminal Jurassic (Taj-Eddine et al., Reference Taj-Eddine, Rey and Du Dresney1985) consists of alternating carbonate and gypsum formations, characteristic of a sabkha depositional environment (Witam, Reference Witam1988). This formation is overlain by Upper Jurassic yellow dolomites (Canerot et al., Reference Canerot, Cugny, García-Hernández, López-Garrido, Rey and Vera1982) and by Upper Berriasian–Lower Hauterivian limestones (Witam, Reference Witam1988). The limestones are overlain by a Upper Valanginian–Lower Hauterivian brown clay (Canerot et al., Reference Canerot, Cugny, García-Hernández, López-Garrido, Rey and Vera1982), followed by the Upper Hauterivian Dridrat limestone and the Upper Hauterivian-Barremian red sandy clays. The Plio-Quaternary deposits consist of calcareous sandstones and biodetrital conchiferous limestones (Witam, Reference Witam1988).
Structural context
The structural framework of the Safi basin reflects the superposition of Hercynian and Alpine–Atlasic tectonic events, which controlled its geological evolution. The reactivation of inherited structures resulted in gentle folding, faulting and flexuring, particularly within the Abda–Doukkala plain, where the sedimentary cover exhibits a generally mild tectonic style. These tectonic features influenced the present-day geometry and distribution of the Jurassic–Cretaceous formations exposed in the study area (Michard, Reference Michard1976; Roussel & Bernardin, Reference Roussel and Bernardin1991; Chalouan et al., Reference Chalouan, Michard, Feinberg, Montigny and Saddiqi2001; Michard et al., Reference Michard, Soulaimani, Hoepffner, Ouanaimi, Baidder, Rjimati and Saddiqi2010; Habiballah et al., Reference Habiballah, Witam and Ibnoussina2022).
Materials and methods
Sampling and sample preparation
Ten samples of two different clayey raw materials were collected from 10 studied sites (Fig. 1b), including seven brown clay samples (LF, SA, SB, OC, SKM, CCM) and three red sandy clay samples (SK, SBC, SBK, CB; Fig. 2b). The samples were then blended and quartered into 5 kg aliquots to ensure a representative sample for laboratory analysis, including the identification of clay properties.
Sampling map of the study area: (a) lithostratigraphic cross-section of the study area (Safi basin); (b) location of sampling in the lithostratigraphic column of each site.

Figure 2 Long description
Two labeled parts, a and b, present lithostratigraphic information and sampling positions. The part labeled a contains a vertical reference column with adjacent headings, Age, Formation, Section and Thickness, followed by a boxed heading, LEGEND. The reference column is divided into stacked bands with formation names written inside, including Quaternary, Upper Hauterivien, Lower Hauterivien, Lower Valanginian, Jurassic terminal and Kimmeridgian Oxfordian. The Thickness column shows a vertical scale with tick labels 0 m, 40 m, 80 m, 120 m, 160 m and 200 m. The legend box lists grouped headings, Sedimentary structures, Diagenetic features, Trace fossils, Body fossils and Lithologies, each followed by multiple small symbols or patterned rectangles. The Lithologies list includes the text, Dolomitic marls, Dolomitic limestone, Marly limestone, Sandy limestone, Gypsum breccia, Calcareous sandstone, Red clay and sandstone, Brown limestone, Brown clays, Yellow limestone, Greyish dolomites and Evaporitic complex. The part labeled b shows ten separate measured stratigraphic columns, each titled with a locality name and an approximate thickness written under the name: Sidi Bzquid approximately 100 m, Cued Chaaba approximately 75 m, Sidi Khelil approximately 100 m, Sidi Bel Kerara approximately 40 m, Skgum approximately 40 m, Lalla Fatna approximately 120 m, Sidi Bguetcha approximately 100 m, Cat Beddguza approximately 40 m, Sidi Abdarrahman approximately 60 m and Laakrat approximately 50 m. Each locality column is drawn as a vertical stack of patterned lithologic units with irregular contacts and each column has one or more sample markers placed beside specific layers, with short letter codes next to the markers. The visible sample codes beside the columns include SB, GC, SK, SBK, SKM, LF, SBC, CB, SA and CCM. A boxed key at the bottom labeled, Sample localities, shows the same letter codes paired with marker symbols. Another boxed key labeled, Legend: Lithostratigraphic column, lists stratigraphic intervals and lithology patterns, including Upper Hauterivien, Lower Hauterivien, Lower Valanginian, Jurassic terminal and Kimmeridgian Oxfordian and lithology names including Sandstone limestone, Greyish clays, Discoloured brown clays, Bioturbated brown clay, Ferruginous clay level, Brown clay, Soil, Limestone sandstones, Red sandy clay layers, Dirdrct limestone, Lower limestone, Yellow dolomites and Evaporite complex. The figure presents the reference column and legend together with the set of locality columns so the sample markers can be read against the labeled stratigraphic units and lithology patterns.
Representative samples were well mixed with distilled water under vigorous stirring for 12 h to disaggregate and achieve homogeneous slurries. The slurries were then passed through a 250 μm sieve to remove coarse impurities, including residual organic matter (OM), and allowed to settle for 24 h, after which the supernatant water was carefully poured away. The precipitated clayey pastes obtained were shaped as 2–3 cm balls and dried at 60°C for 48 h. The dried balls were then fine-milled using an agate mortar and passed through a 63 μm sieve to obtain uniform powders, which were used for geochemical, mineralogical and geotechnical characterization (El Ouahabi et al., Reference El Ouahabi, Daoudi and Fagel2014b; El Halim et al., Reference El Halim, Daoudi, El Ouahabi, Amekrane and Fagel2018a).
Analytical techniques
Chemical analysis, using X-ray fluorescence (XRF) spectroscopy, was performed with a PANalytical Axios Advanced PW 4400 XRF spectrometer. The major elements (Si, Al, Ca, Fe, K; Mg, Mn, Na, Ti, P) were determined in samples at 950°C previously heated for 2 h. The diagram proposed by Fiori et al. (Reference Fiori, Fabbri, Donati and Venturi1989) was used to assess the suitability of the clays for various ceramic applications.
Bulk mineralogical composition was determined by X-ray powder diffraction (XRPD) on a PANalytical X’Pert Pro diffractometer, using monochromated Co-Kα radiation (λ = 1.7890 Å), 40 kV and 45 mA, in the range 2.5–35°2θ, with a step size of 0.05°2θ min–1. The <2 µm fraction was separated and analysed in various conditions for each sample: air-dried (N), ethylene glycol-solvated for 24 h (EG) and heated for 4 h at 550°C (H). DIFFRACplus EVA software (Bruker) was used to determine the line location, peak intensity and integrated area after removing background. Semi-quantitative estimation of mineral phases was carried out according to the standard approaches (Biscaye, Reference Biscaye1965; Thorez, Reference Thorez and Lelotte1976; Marsigli & Dondi, Reference Marsigli and Dondi1997; Fagel et al., Reference Fagel, Boski, Likhoshway and Oberhaensli2003; Fagel & Boës, Reference Fagel and Boës2008; Jeridi et al., Reference Jeridi, Hachani, Hajjaji, Moussi, Medhioub and Lopez-Galindo2008). Fourier-transform infrared (FTIR) spectra were recorded using a Bruker Tensor 27 spectrometer over the spectral range of 4000–400 cm–1 with a resolution of 4 cm–1 and 32 scans per sample. The powdered samples were mixed with spectroscopic-grade KBr and pressed into pellets prior to analysis. Band assignment was performed by comparison with published reference spectra.
Several techniques were employed to determine the physical characteristics of the clay materials. Gravimetric water content (wt.%) was calculated by dividing the weight of water by the weight of the clay after drying at 105°C (Gardner, Reference Gardner, Sparks, Page, Helmke, Loeppert, Soltanpour and Tabatabai1986). The total quantity of OM was measured using loss on ignition (LOI) at 550°C for 4 h (Heiri et al., Reference Heiri, Lotter and Lemcke2001). Grain-size distribution was analysed with a Horiba LA300 laser diffraction particle analyser. The texture of the clay components was classified using the Belgian textural categorization scheme. Porosity and permeability were assessed using the McManus triangle diagram (McManus, Reference McManus and Tucker1988).
The Atterberg limits, namely liquid limit (LL), plastic limit (PL) and plasticity index (PI = LL – PL), were determined using the Casagrande method in accordance with the International Organization for Standardization (ISO) standards (BSI, 2018). The clay materials were classified based on their plasticity using the Holtz and Kovacs ternary diagram (Holtz & Kovacs, Reference Holtz and Kovacs1981). The Winkler and Bain diagrams were employed to determine the most suitable ceramic applications based on the consistency limits (Winkler, Reference Winkler1954; Bain, Reference Bain1986). Carbonate content was measured using a Bernard calcimeter, based on the volume of CO2 evolved, following the French Standard NF P 94-048 (Loualbia et al., Reference Loualbia, Sebaibi, Duc, Goual and Feia2017).
Results
Geology and characteristics of the studied clay deposits
The clay deposits studied are mainly associated with the Upper Valanginian brown clays and the Upper Hauterivian–Barremian red sandy clay layers (Fig. 2a,b). The Upper Valanginian brown clays crop out along the Atlantic coast north of Safi and in several inland quarries. This facies includes the SB, OC, SK, SKM, LF, AS and CCM sampling sites. It is composed predominantly of brown clays with massive to laminated structures, with local sandy intercalations observed and a grain size ranging from clay to fine silt, and it reaches a thickness of ∼60 m.
The Upper Hauterivian–Barremian red sandy clay layers are exposed in several inland outcrops and include the SBK, SBC and CB sampling sites. This facies consists of reddish sandy clays characterized by cross-stratification and lenticular bedding. Grain size varies from fine sand to silty clay, with localized sandy intercalations. Fossil fragments, mainly shell debris, are sporadically observed within the sandy horizons, indicating deposition in shallow marine environments. The facies reaches an approximate thickness of 45 m.
The facies classification follows the sedimentological criteria proposed by Miall (Reference A.D1994), following lithology, sedimentary structures, grain size, colour and fossil content. This classification provides a comprehensive description of the studied deposits and highlights the sedimentological variability of the Safi Basin (Fig. 3).
Representative field photographs of the studied clay deposits from the Safi basin, illustrating the two investigated stratigraphic facies: the Upper Valanginian brown clays (SB, OC, SK, SKM, SA, LF and CCM) and the Upper Hauterivian–Barremian red sandy clay layers (SBK, SBC and CB).

Mineralogical characterization
X-ray diffraction analysis
The X-ray diffraction (XRD) analysis of the bulk materials and clay fractions demonstrates comparable mineralogical phase assemblages, with differences mainly in their relative abundancies (Fig. 4a & Table 1). The clayey materials consist of quartz (24–33%), illite (14–37%), kaolinite (9–21%), chlorite (0–8%), feldspar (2–11%), calcite (2–33%) and dolomite (2–20%). Additionally, minor (<5%) hematite, goethite, aragonite and anhydrite are also present. All studied samples, except for CB, consist mainly of illite and quartz, with a moderate amount of kaolinite, classifying them as ‘illitic–kaolinite clays’. However, sample CB, which is rich in calcite and contains large amounts of quartz, illite and kaolinite, is classified as marl.
XRD traces of the studied clay materials: (a) bulk samples; (b) clay fraction of sample SA. EG = ethylene glycol-treated; H 550 = heated at 550°C; N = natural sample.

Figure 4 Long description
Stacked X ray diffraction line traces for multiple samples. The horizontal axis is labeled 2 theta, ranging from 0 to 90 in increments of 10. The vertical axis label and unit are not shown; the plotted quantity is diffraction intensity shown as vertically offset traces. A legend lists sample codes: CB, SBC, OC, LF, SBK, SKM, SB, SK, CCM, SA. Many narrow peaks are marked by small arrows and short mineral labels above the traces. A mineral key lists: Anh: Anhydrite, Ar: Aragonite, Cal: Calcite, Chl: Chlorite, Dol: Dolomite, F: Feldspar, G: Goethite, H: Hematite, I: Illite, K: Kaolinite, Q: Quartz. The traces share many peak positions, while peak heights vary between sample codes. Three stacked X ray diffraction line traces for one sample under three conditions. The horizontal axis is labeled 2 theta, ranging from 2 to 20 in increments of 2. The vertical axis label and unit are not shown; the plotted quantity is diffraction intensity shown as vertically offset traces. A legend lists: H 550, EG, N. Peak position labels are printed at 5.14 degree 2 theta, 9.28 degree 2 theta, 12.35 degree 2 theta and 18.49 degree 2 theta. The three traces show peaks at these same labeled positions, with different peak heights between H 550, EG and N.
Semi-quantitative estimation of the mineralogical composition (%) of the studied clay materials.

Table 1 Long description
Mineral percentages are listed for 10 localities with sample codes SBC, OC, CCM, SA, SB, CB, SK, LF, SKM, and SBK, across 11 minerals: Illite, Kaolinite, Chlorite, Quartz, Feldspar, Calcite, Dolomite, Aragonite, Anhydrite, Hematite, and Goethite. Localities are Sidi Bouchta, Oued Chaaba, Laakarta, Sidi Abderhman, Sidi Bouzid, Cap Bedouza, Sidi Khelil, Lalla Fatna, Skoum, and Sidi Belkerara. Quartz ranges from 24.73 percent at Cap Bedouza to 33.52 percent at Oued Chaaba, with other quartz values between 25.14 and 32.37 percent. Calcite ranges from 1.66 percent at Lalla Fatna to 32.96 percent at Cap Bedouza, while most other localities have calcite between 2.14 and 5.03 percent. Dolomite ranges from 1.83 percent at Cap Bedouza to 19.84 percent at Sidi Khelil, with other dolomite values between 2.16 and 10.45 percent. Kaolinite ranges from 9.27 percent at Cap Bedouza to 21.47 percent at Skoum, and chlorite ranges from 0.65 percent at Cap Bedouza to 8.34 percent at Sidi Abderhman. Feldspar ranges from 2.05 percent at Skoum to 10.68 percent at Cap Bedouza. Minor minerals include aragonite from 0.11 percent at Lalla Fatna to 2.58 percent at Sidi Khelil, anhydrite from 0.09 percent at Lalla Fatna to 1.87 percent at Sidi Khelil, hematite from 0.17 percent at Skoum to 2.23 percent at Oued Chaaba, and goethite from 0.47 percent at Skoum to 4.70 percent at Oued Chaaba.
The XRD traces of the <2 μm fractions show intense peaks at 4.99 and 9.98 Å (N), which remained unchanged when heated to 550°C (H) and ethylene glycol-solvated (EG), indicating the presence of illite and a lack of smectite. The kaolinite peak appears at 7.15 Å under air-dried conditions and after EG solvation, and it disappears after heating at 550°C. The presence of chlorite is confirmed from the peak at 14.19 Å, which is not affected by EG solvation (Fig. 4).
FTIR analysis
The FTIR spectra of the clay samples show the occurrence of quartz, feldspar, clay minerals, carbonates and oxyhydroxide minerals (Fig. 5). The bands at 470 and 535 cm–1 are attributed to Si–O stretching vibrations in quartz. Absorption bands between 600 and 796 cm–1 correspond to Si–O–Si deformation, Si–O–Al bonds and Si–O stretching in feldspars. Absorption bands at 870–874 cm–1 indicate the presence of carbonates, while those at ∼1000–1031 cm–1 indicate Si–O–Si stretching vibrations in clay minerals. Bending vibrations associated with adsorbed water molecules are evident at 1630–1789 cm–1. The broad absorption bands between 3200 and 3500 cm–1 are due to OH stretching modes, associated with physisorbed water. Absorption bands in the 3600–3700 cm–1 range suggest the stretching vibration of structural OH, consistent with the presence of clay minerals such as chlorite, kaolinite and illite. The stretching bands for kaolinite occur at 3621–3697 cm–1 (Adler & Kerr, Reference Adler and P.F1963; White, Reference White1971; Zviagina et al., Reference Zviagina, McCarty, Środoń and Drits2004; Chukanov & Chervonnyi, Reference Chukanov and Chervonnyi2016; Madejová et al., Reference Madejová, Gates, Petit, Gates, Kloprogge, Madejová and Bergaya2017).
FTIR spectra of the studied clay samples.

Figure 5 Long description
A multi-line graph displays FTIR spectra of ten clay samples. The horizontal axis is labeled Wavenumber (cm superscript minus 1) and ranges from 500 to 4000. The vertical axis label is not visible in the image. The legend lists ten series: SK, LF, SA, SB, SC, OKM, CCM, SBC, SBK and CB. Each series is represented by a distinct line and the lines are visually distinguished by different encodings as shown in the legend, though individual line encodings per sample are not reliably readable from the image. Vertical marker lines are drawn at the following wavenumber positions: 470, 535, 600, 796, 870, 874, 1000, 1031, 1630, 1789, 3200, 3500, 3600 and 3700 cm superscript minus 1. These positions are annotated at the top of the graph. All ten spectra show broad absorption features in the region between 3200 and 3700 cm superscript minus 1, with visible variation in band depth across the series. The region around 1000 to 1031 cm superscript minus 1 shows a prominent absorption feature present across all ten series, with some series displaying a deeper trough than others in this range. The region between 1630 and 1789 cm superscript minus 1 shows a shallower feature visible across most series. The bands near 470 and 535 cm superscript minus 1 show short, low-intensity features across all series. The bands near 870 and 874 cm superscript minus 1 show small absorption features visible in several series. Overall, the ten spectra follow a broadly similar pattern, with the most notable variation occurring in the depth of the bands near 1000 to 1031 cm superscript minus 1 and in the 3200 to 3700 cm superscript minus 1 region. The graph compares the spectral profiles of the ten labeled clay samples across the full wavenumber range.
Geochemical characterization
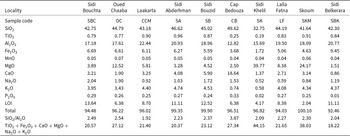
The clays are dominated by SiO2 (33–50%), with the lowest concentration observed in sample SK (32.75%) and the highest concentration observed in sample CB (49.62%; Table 2). The Al2O3 content (12.82–22.44%) is highest in sample CCM, and its minimum value is in sample CB. The Fe2O3 content (1.72–9.45%) is highest in sample SBK and lowest in sample SK. CaO (0.86–18.64%) is present in all samples, with the highest concentration in sample CB (18.64%) and the lowest concentration in sample SBK (0.86%). MgO (1.51–12.52%) is less abundant in most samples, except for samples SKM and SK (24.17–39.77%). K2O varies between 0.58% and 4.74%, with the maximum value observed in sample SA and the minimum observed in sample SK. Na2O (0.52–2.04%) is highest in sample SBC and lowest in sample SK. Additionally, minor oxide components (TiO2, P2O5 and MnO) each exhibit values below 1%. LOI values at 550°C vary from 2.04% to 13.64%, with the higher values (>5%) observed in samples SBC, OC, CCM, SA, SB, LF, CB and SBK and the lower values (<5%) observed in samples SKM and SK.
Chemical composition (wt.%) of the studied clay materials determined by XRF.

Table 2 Long description
Chemical composition in weight percent is listed for 10 localities with sample codes: Sidi Bouchta, SBC; Oued Chaaba, OC; Laakarta, CCM; Sidi Abderhman, SA; Sidi Bouzid, SB; Cap Bedouza, CB; Sidi Khelil, SK; Lalla Fatna, LF; Skoum, SKM; Sidi Belkerara, SBK. SiO2 values are 42.75, 44.79, 43.18, 46.62, 45.02, 49.62, 32.75, 44.19, 41.64, and 42.30. TiO2 values are 0.79, 0.77, 0.90, 0.96, 0.87, 0.25, 0.19, 0.83, 0.91, and 0.84; Al2O3 values are 17.18, 17.61, 22.44, 20.93, 18.96, 12.82, 15.69, 19.50, 18.09, and 20.77. Fe2O3 values are 6.69, 6.61, 6.11, 6.27, 5.59, 3.68, 1.72, 5.06, 4.63, and 9.45; MnO values are 0.05, 0.07, 0.05, 0.05, 0.05, 0.04, 0.04, 0.04, 0.06, and 0.04. MgO values are 3.89, 12.52, 5.81, 3.28, 4.52, 2.50, 39.77, 8.38, 24.17, and 1.51; CaO values are 3.21, 1.90, 3.25, 4.08, 5.90, 18.64, 1.37, 2.71, 3.14, and 0.86. Na2O values are 2.04, 1.90, 0.92, 1.03, 1.72, 1.53, 0.52, 0.59, 0.84, and 1.19; K2O values are 3.95, 3.43, 4.40, 4.74, 4.53, 0.74, 0.58, 4.08, 4.34, and 4.37; P2O5 values are 0.29, 0.26, 0.25, 0.27, 0.24, 0.33, 0.02, 0.27, 0.25, and 0.01. LOI values are 13.64, 6.38, 8.70, 11.11, 12.52, 6.38, 4.17, 8.38, 2.04, and 11.11; Total values are 94.48, 96.22, 96.02, 99.35, 99.90, 96.51, 96.82, 94.03, 100.10, and 92.46. The row labeled, SiO2 Al2O, lists 2.49, 2.54, 1.92, 2.23, 2.37, 3.87, 2.09, 2.27, 2.30, and 2.04. The row labeled, TiO2 plus Fe2O3 plus CaO plus MgO plus Na2O plus K2O, lists 20.57, 27.12, 21.40, 20.37, 23.12, 27.34, 44.15, 21.65, 38.03, and 18.22.
The SiO2/Al2O3 ratio varies between 1.92 and 3.87, with the lowest ratio in sample CCM (1.92) and the highest ratio in sample CB (3.87; Table 2). All samples were positioned along the SiO2–Al2O3 axis, trending towards the SiO2 pole, as illustrated by the SiO2–Al2O3–Fe2O3 triangle diagram (Fig. 6).
(a) Positions of the studied clay materials in the triangular diagram SiO2–Al2O3–Fe2O3. (b) Textural classification of the studied clay materials according to De Forges et al. (Reference De Forges, Feller and Jamagne2008). (c) Porosity and permeability of the clay materials in the triangular diagram after McManus (Reference McManus and Tucker1988). (d) Binary diagram according to Holtz & Kovacs (Reference Holtz and Kovacs1981).

Figure 6 Long description
A ternary scatter diagram of oxide composition. The three axes are labeled Al2O3 percent, SiO2 percent and Fe2O3 percent, with each axis running from 0 to 100. A legend lists SK, LF, SA, SB, OC, SKM, CCM, SBC, SBK and CB. The plotted markers form a tight cluster in the interior near the Al2O3 percent side, with Fe2O3 percent visually low relative to the 0 to 100 scale. The image B showing a ternary scatter diagram for particle size fractions that sum to 100 percent. The axes are labeled Sand percent greater than 20 micrometer, Clay percent less than 2 micrometer and Silt 2 micrometer less than phi less than 20 micrometer. Each axis runs from 0 to 100 with tick labels at 0, 25, 50, 75 and 100. The triangle is subdivided into named textural fields including Heavy sandy clay, Sandy clay, Clay, Heavy clay, Sandy silt, Clayey sand, Silty clay, Light sandy clay, Light silty clay, Silt and Light silt. The same legend as image A is shown. Markers fall within multiple labeled fields, including points in the Silt and Light silt fields, points in the Sandy silt field and points in clay bearing fields such as Silty clay and Sandy clay. The image C showing a ternary scatter diagram using the same three particle size axes and tick labels as image B, with the same legend as image A. The triangle is subdivided into labeled porosity and permeability classes including High porosity low permeability, Low porosity low permeability, Moderately high porosity moderately high permeability, Moderately high porosity moderately low permeability, Moderately low porosity moderately high permeability, Moderately low porosity moderately low permeability and High permeability low porosity. Markers appear across several of these labeled classes, including points in Moderately low porosity moderately low permeability, points in Moderately high porosity moderately low permeability and points in High permeability low porosity. The image D showing a scatter plot of soil plasticity. The x-axis is labeled liquid limit LL percent and the y-axis is labeled plasticity index PI percent. The x-axis shows tick labels from 10 to 140 in increments of 10. The y-axis shows tick labels from 0 to 60 in increments of 10. Vertical dashed separators align with the top labels Low, Medium, High and Very high. Several slanted reference lines are labeled A line, Illite and Attapulgite. Labeled regions include Montmorillonite, Kaolinite, Halloysite, Chlorite and Palygorskite. The same legend as image A is shown. Markers lie between about 20 and 60 on liquid limit LL percent and between about 5 and 30 on plasticity index PI percent, with several markers close to the A line and within the region labeled Montmorillonite.
Physical characterization
Particle-size distribution
The samples exhibit considerable variability in particle-size distribution (Fig. 6 & Table 3). The silt and sand fractions range from 22.77% (CB) to 65.40% (SBC) and from 2.97% (CCM) to 63.82% (CB), respectively. Silt constitutes the most abundant component across all analysed samples, with an average content of 51.9%. The abundances of the average clay and sand fractions were 25% and 23%, respectively. Nonetheless, the SKM, OC and CB samples showed higher sand fractions, ranging from 38.6% to 63.8%. According to the classification proposed by De Forges et al. (Reference De Forges, Feller and Jamagne2008) (Fig. 6b), the major clay materials are silty clays. However, samples CB and SKM are considered heavy sandy silts, while samples CCM and OC are classified as a heavy clay and a light clay, respectively.
Textural, physical and geotechnical properties of the studied clay materials.

Table 3 Long description
Ten clay localities are compared by sample code, colour, texture, particle size fractions, Atterberg limits, organic matter, water content, and carbonates. Localities and sample codes are Oued Chaaba OC, Laakarta CCM, Sidi Abderhman SA, Sidi Bouzid SB, Sidi Khelil SK, Lalla Fatna LF, Dar Si Aissa SKM, Sidi Belkerara SBK, Sidi Bouchta SBC, and Cap Bedouza CB. Colours range from reddish orange at Oued Chaaba to multicoloured at Laakarta and Sidi Abderhman, grey at Sidi Bouzid and Lalla Fatna, brown at Sidi Khelil, light grey at Dar Si Aissa, reddish brown at Sidi Belkerara, red at Sidi Bouchta, and yellowish orange at Cap Bedouza; textures include light clay, heavy clay, silty clay, clay, and heavy sandy silt. Sand values range from 2.97 at Laakarta to 63.82 at Cap Bedouza; silt ranges from 22.77 at Cap Bedouza to 65.4 at Sidi Bouchta; clay ranges from 13.41 at Cap Bedouza to 42.1 at Laakarta. Liquid limit ranges from 31 at Cap Bedouza to 52 at Lalla Fatna; plastic limit ranges from 18 at Cap Bedouza to 28 at Lalla Fatna; plasticity index ranges from 13 at Cap Bedouza to 25 at Laakarta. Organic matter ranges from 0.40 at Cap Bedouza to 2.50 at Laakarta; water content ranges from 2.09 at Cap Bedouza to 15.66 at Sidi Abderhman. Carbonates range from 13 at Sidi Bouzid, Dar Si Aissa, and Sidi Belkerara to 53.5 at Cap Bedouza.
According to the ternary diagram relating porosity and permeability to sand–silt–clay contents (Fig. 6c; McManus, Reference McManus and Tucker1988), samples SK, SBC, SKM, OC and CB exhibit moderately high permeability and, consequently, relatively high porosity, whereas samples CCM, SB, LF, SA and SBK show lower porosity and permeability.
Atterberg limits
The Atterberg limits are presented in the Holtz and Kovacs diagram (Holtz & Kovacs, Reference Holtz and Kovacs1981) (Fig. 6d). The PL ranges from 18% to 28% while the LL ranges from 31% to 52% for samples CB and LF, respectively. The PI ranges from 13% for sample CB to 25% for sample CCM. Most samples are classified as illitic–kaolinitic, with medium plasticity. However, samples LF and CB show high and low plasticity, respectively.
Water content, carbonate content and organic matter
The water content of the investigated clay materials ranges from 2.0% (CB) to 15.6% (SA; Table 3), with an average value of 7.1%. In most of the clay samples, the carbonate content ranges from 13% (SB) to 20% (SBC). An exception is observed in sample CB, which contains a higher carbonate content of ∼53.5%, classifying it as marl. Finally, the OM ranges from 0.40% (CB) to 2.50% (CCM), with an average of 1.63% (Table 3).
Discussion
Relationship between lithology and mineralogical composition
A clear relationship holds between the lithological characteristics of the two investigated facies and their mineralogical assemblages. The Upper Valanginian brown clays (SB, OC, SK, SKM, LF, AS and CCM sampling sites) are characterized by illite and quartz as the dominant phases, with a moderate contribution of kaolinite, classifying them as ‘illitic–kaolinitic clays’. In contrast, sample CB, representing the Upper Hauterivian–Barremian red sandy clay layers, is rich in calcite and contains high amounts of quartz, illite and kaolinite, and it can accordingly be classified as marl. This distinction reflects the contrasting depositional environments of the two facies: the massive to laminated structures of the brown clays suggest quieter, more sustained clay sedimentation, while the reddish sandy clay deposits of the red sandy clay layers, characterized by cross-stratification and lenticular bedding, indicate higher-energy conditions and a greater contribution of detrital material.
The predominant oxides Al2O3 and SiO2 are predominantly associated with feldspar, quartz and clay minerals. Fe2O3 is associated with hematite and goethite in the clays, which are also the sources of the reddish-brown or reddish-yellow colouring (Bukalo et al., Reference Bukalo, Ekosse, Odiyo and Ogola2017, Reference Bukalo, Ekosse, Odiyo and Ogola2018). The K2O and Na2O associated with sodium and potassium feldspars and CaO and MgO are associated with carbonates, calcite and dolomite. Finally, the LOI is linked to the dehydroxylation of clay minerals, the combustion of organic materials and the decomposition of carbonates (Milheiro et al., Reference Milheiro, Freire, Silva and Holanda2005; Baccour et al., Reference Baccour, Medhioub, Jamoussi, Mhiri and Daoud2008). The variation in LOI also suggests the presence of predominantly hydrated minerals such as goethite and clay (Mefire et al., Reference Mefire, Njoya, Fouateu, Mache, Tapon and Nzeugang2015).
The SiO2/Al2O3 ratio, which varies between 1.92 and 3.87, further reflects this mineralogical variability. Sample CCM has the lowest ratio (1.92), implying the predominance of clay minerals (Tsozué et al., Reference Tsozué, Nzeugang, Mache, Loweh and Fagel2017; Pierre et al., Reference Pierre, Jean Pierre, Madi, Basga and Lucien2018). Sample CB shows the highest ratio (3.87). SiO2/Al2O3 ratios >2 indicate the presence of quartz, as well as the chemical maturity of the studied clay materials (Tsozué et al., Reference Tsozué, Nzeugang, Mache, Loweh and Fagel2017; Temga et al., Reference Temga, Madi, Djakba, Zame, Angue and Mache2018).
Relationships between mineralogy, geochemistry and physical properties
The mineralogical and geochemical composition of the Safi clays exerts a strong influence on their physical properties. In the studied materials, illite and kaolinite are the dominant clay phases. These minerals are rich in fluxing and degreasing agents (feldspar and quartz), which facilitate effective fritting, promote water removal and reduce shrinkage issues (Guerraoui et al., Reference Guerraoui, Zamama and Ibnoussina2009). Kaolinite, due to its high fusion temperature and white post-firing colour, is extensively used. Illite (the main component of the clays studied) is widely used as a fluxing agent in traditional ceramics for the production of cooking pots, plates, bricks and stoneware tiles (Ferrari & Gualtieri, Reference Ferrari and Gualtieri2006). The carbonate content acts as a degreasing agent during shaping (Abdelmalek et al., Reference Abdelmalek, Rekia, Youcef, Lakhdar and Nathalie2017). On the other hand, iron oxides, particularly hematite and maghemite, are sensitive to firing conditions and often have an unpredictable effect on the colour and texture of fired clays (Molera et al., Reference Molera, Pradell and Vendrell-Saz1998). Chlorite is responsible for the red colour of bricks during firing (Clifford, Reference Clifford1984). Iron oxide also serves as a fluxing agent (Kornmann, Reference Kornmann2007).
The clays’ particle-size distribution is crucial to determining the characteristics of green pastes and suspensions, such as their viscosity and plasticity, during drying and firing processes (Boussen et al., Reference Boussen, Sghaier, Chaabani, Jamoussi and Bennour2016). The overall clay content is the main factor influencing the plasticity of clay samples. Thus, sample CCM, containing 42% clay, has a higher plasticity than sample CB, which has a clay content of 13.41%. The particle-size distribution confirms these observations, highlighting the combined influence of clay content and particle size on the plasticity of raw clay materials and, consequently, on their rheological properties (Holtz & Kovacs, Reference Holtz and Kovacs1981; de Oliveira Modesto & Bernardin, Reference De Oliveira Modesto and Bernardin2008). Furthermore, the clay and silt fractions increase plasticity, which is particularly beneficial for the extrusion and manual shaping of ceramics.
Particle size has a significant impact on permeability (Díaz-Curiel et al., Reference Díaz-Curiel, Biosca, Arévalo-Lomas, Paredes-Palacios and Miguel2024). The particle-size distribution within the clayey materials studied aligns with this observation. Moderate permeability accelerates and increases the amount of water adsorption by facilitating its entry into the clay. However, sufficient cohesion is required in the ceramic paste. Consequently, high-permeability clays exhibit low cohesion, which leads to extrusion issues. In contrast, clays with low porosity and permeability provide the desired qualities, particularly consistency and workability (Maury Njoya et al., Reference Maury Njoya, Lecomte-Nana, Barry, Njoya, El Hafiane and Peyratout2025).
Water content has a significant influence on the properties of clays, affecting their plasticity, cohesion and permeability while inducing structural changes (Cherblanc et al., Reference Cherblanc, Berthonneau, Bromblet and Huon2016). The water content values observed (2.0–15.6%) confirm the presence of fine clay and silt particles and suggest a correlation with porosity and permeability. While the fine particle sizes of OM do not affect the final ceramic product, larger particles can result in broad pores and carbon markings after firing (Nzeugang Nzeukou et al., Reference Nzeugang Nzeukou, Fagel, Njoya, Beyala Kamgang, Eko Medjo and Chinje Melo2013). The dark colouration observed in some clayey samples (CCM and SA) suggests a significant OM content, as noted by Wilding (Reference Wilding2004). The presence of OM also significantly increases the plasticity of clays (Husein Malkawi et al., Reference Husein Malkawi, Alawneh and O.T1999). Samples CCM and SA in particular highlight the influence of OM on both the colour and plasticity of the clays.
Ceramic suitability of the investigated facies
Previous studies have highlighted that the suitability of raw clay deposits for ceramic applications depends on their physical, mineralogical, chemical and geotechnical properties (Gualtieri, Reference Gualtieri2020; Dondi & Bertolotti, Reference Dondi and Bertolotti2021; Xanthopoulou et al., Reference Xanthopoulou, Iliopoulos and Avramidis2021; Dondi & Gian Paolo, Reference Dondi and Gian Paolo2022). The use of ternary diagrams and multi-criteria analysis confirms the appropriateness of these clay samples for the earthenware industry.
The two investigated stratigraphic facies exhibit distinct lithological and geochemical characteristics that directly influence their ceramic behaviour. The brown clay facies are generally finer-grained and contain higher proportions of clay minerals, particularly illite and kaolinite, resulting in greater plasticity and improved shaping properties. However, their greater clay fraction may also increase drying and firing shrinkage if not properly controlled. In contrast, the red sandy clay layers contain a greater proportion of quartz and coarser particles, which reduce plasticity while improving dimensional stability during drying and firing. These lithological and compositional differences are reflected in their technological behaviour and explain the differences observed in their suitability for various ceramic products.
The particle-size data of the clay raw materials (Table 3) were plotted using the Winkler diagram (Winkler, Reference Winkler1954) (Fig. 7c). The remaining clayey samples, classified as silty clay, have fine particles and do not fit into any specific zone on the Winkler diagram. To make them suitable for production, these samples require pre-treatment, such as the addition of 10% sand (Winkler, Reference Winkler1954).
(a) Suitability of the studied clay samples according to the Winkler ternary diagram (Winkler, Reference Winkler1954). (b) Composition of the studied clay samples in the diagram of Fiori et al. (Reference Fiori, Fabbri, Donati and Venturi1989). (c) Ceramic suitability diagram according to Strazzera et al. (Reference Strazzera, Dondi and Marsigli1997).

Figure 7 Long description
A showing a ternary scatter plot with a triangular grid and several colored point markers. The left side label reads, Silt 2 to 20 micrometer percent. The right side label reads, Clay less than 2 micrometer percent. The bottom label reads, Sand greater than 20 micrometer percent. The triangle corners are labeled 0 and 100, with intermediate tick labels including 25, 50 and 75. Several text labels appear inside the triangle, including, Roofing tiles and masonry bricks, Hollow bricks, Ceramic products, Vertically perforated bricks and Common bricks. The plotted points form a small cluster toward the left half of the triangle and a smaller set of points toward the lower right area. B showing a ternary scatter plot with a triangular grid and several colored point markers. The left side label reads, Al2O3 percent. The right side label reads, SiO2 percent. The bottom label reads, TiO2 plus Fe2O3 plus CaO plus MgO plus Na2O plus K2O percent. The triangle corners are labeled 0 and 100, with intermediate tick labels including 25, 50 and 75. Dashed boundary lines divide the interior into regions labeled A, B, C and D. A legend inside the plot lists, A Tiles, B Stoneware, C and D Porous tiles. Most points cluster near the upper central area of the triangle, with a few points separated toward the right and lower right. C showing a ternary scatter plot with a triangular grid and several colored point markers. The left side label reads, Carbonates percent. The right side label reads, Clay minerals percent. The bottom label reads, Quartz and feldspars percent. The triangle corners are labeled 0 and 100, with intermediate tick labels including 25, 50 and 75. Two outlined oval regions appear within the triangle and a small legend near the upper left labels these ovals as, Clay roofing tiles and Structural clay products. A separate legend box to the right lists sample codes with colored marker symbols, including, SK, LF, SA, SB, OC, SKM, CCM, SBC, SBK and CB. The plotted points include a cluster near the upper middle area and several points spread across the mid and lower parts of the triangle.
The XRF chemical analysis data for the studied clays (Table 2) were plotted on the ternary diagram of Fiori et al. (Reference Fiori, Fabbri, Donati and Venturi1989) (Fig. 7b). Samples SKM, SK and CB are located near regions C–D of the diagram, indicating their suitability for the production of porous roof tiles with minimal pre-treatment. The remaining clay samples plot mainly in region B and are therefore suitable as raw materials for the manufacture of stoneware products.
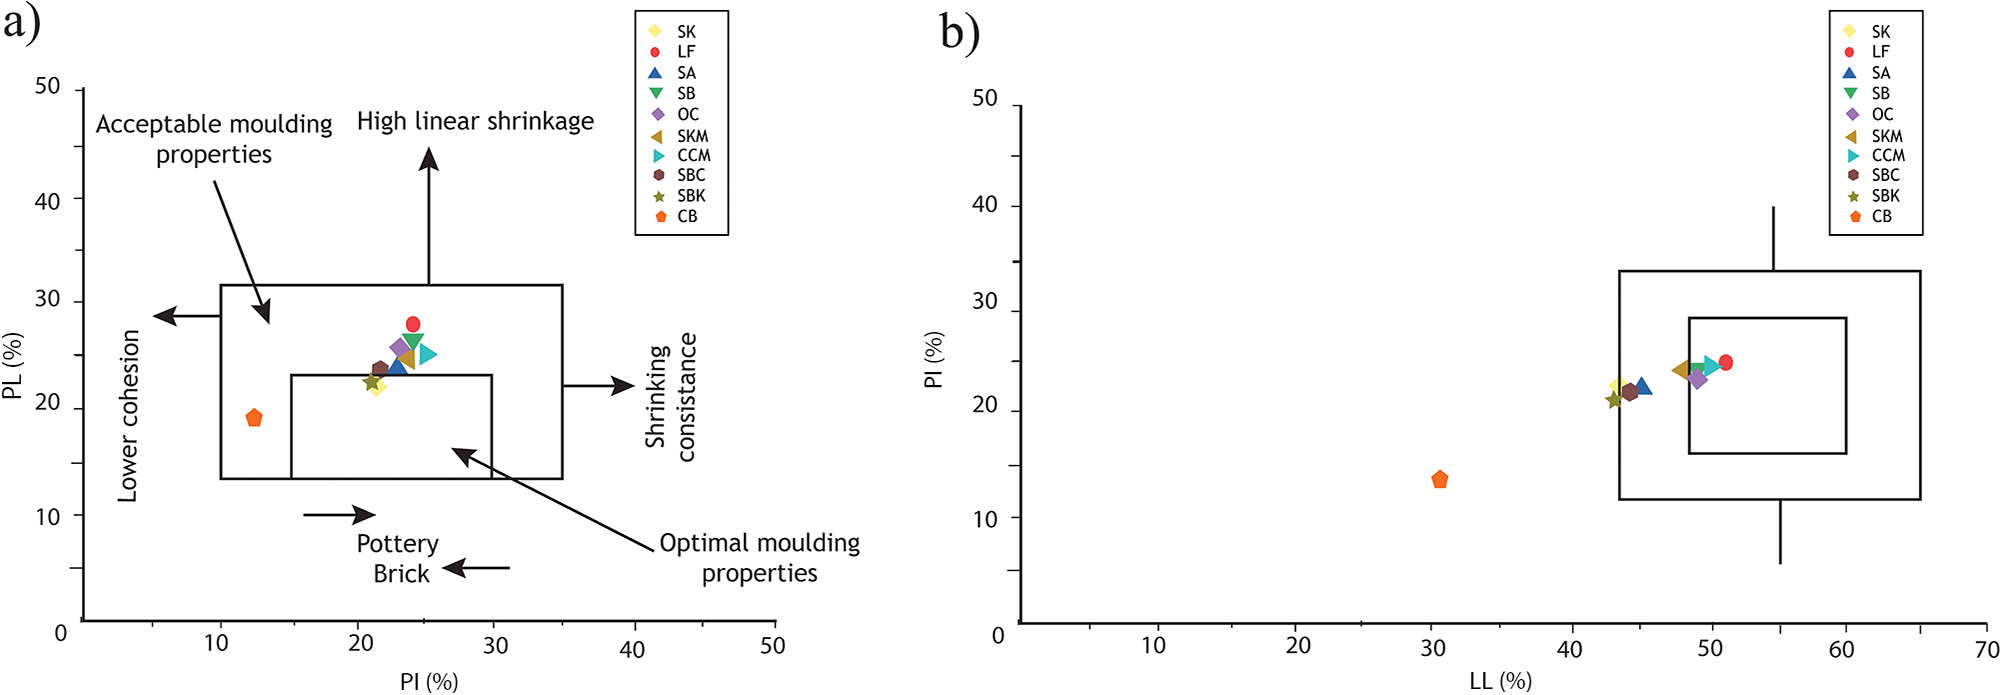
Based on the correlation between the mineralogical composition of clay materials and ceramic applications (Strazzera et al., Reference Strazzera, Dondi and Marsigli1997), the majority of these clay samples are suitable for producing structural clay products (Fig. 7c). Generally, the ultimate rheological characteristics of ceramic products are influenced by their clay content and particle-size distribution, which also determine the plasticity of raw clay materials (Holtz & Kovacs, Reference Holtz and Kovacs1981; de Oliveira Modesto & Bernardin, Reference De Oliveira Modesto and Bernardin2008). The Atterberg limits of the clay samples were plotted graphically on a Bain diagram (Bain, Reference Bain1986) (Fig. 8a) and on a Casagrande diagram (Casagrande, Reference Casagrande1948) (Fig. 8b). The workability diagram, based on the PI and PL, demonstrates that all samples possess adequate moulding properties, being projected within the area of acceptable and optimal moulding properties (Fig. 8).
(a) Workability behaviour for the clayey samples according to Bain (Reference Bain1986). (b) Domains relative to extrusion capability of clays according to Casagrande (Reference Casagrande1948). Samples located within zones A and B have optimal and sufficient properties for extrusion.

Figure 8 Long description
Scatter plot a) presents the horizontal axis labeled Plastic Limit PL (%) ranging from 0 to 50 and the vertical axis labeled Plasticity Index PI (%) ranging from 0 to 40. The plot illustrates the relationship between plastic limit and plasticity index, highlighting areas with acceptable and optimal moulding properties. Points are clustered within a boxed area, indicating samples with suitable properties for pottery and brick. Annotations such as High linear shrinkage and Lower classes are present. The legend identifies different samples using labels like SA, SM, SI, SK, SL, SQ, SR, SS, ST, SU, SV, SW, SX, SY, SZ, with symbols representing each sample. The plot suggests a correlation between higher plasticity index and optimal moulding properties. Scatter plot b) shows the horizontal axis labeled Liquid Limit LL (%) ranging from 20 to 70 and the vertical axis labeled Plasticity Index PI (%) ranging from 0 to 50. This plot demonstrates the relationship between liquid limit and plasticity index, with points concentrated within a boxed area, indicating samples with extrusion capability. The legend is consistent with the previous plot, identifying the same samples. The plot reveals that samples with higher liquid limits tend to have higher plasticity indices, suitable for extrusion. Both plots aim to illustrate the workability and extrusion capabilities of clay samples based on their plasticity and limits.
Almost all of these clay samples can be used for pottery, with the exception of sample CB, which is more suitable for brick production. Almost all of the clay samples can be used for pottery, with the exception of sample CB, which is more suitable for brick production. According to the Casagrande diagram (Reference Casagrande1948) (Fig. 8b), all of the studied clay samples, except CB, fall within the range of optimal properties for extrusion. The low plasticity of the marl sample CB makes it unsuitable for extrusion; however, this can be improved by pre-treatment, such as blending it with a highly plastic material before ceramic production.
The final properties of ceramic products can be influenced by the mineral composition, particularly the relative abundance of clay minerals. There is a strong correlation between a sample’s plastic behaviour and its suitability for pressing (Marsigli & Dondi, Reference Marsigli and Dondi1997). High plasticity is advantageous for hand moulding or the extrusion process (Jeridi et al., Reference Jeridi, Hachani, Hajjaji, Moussi, Medhioub and Lopez-Galindo2008).
Industrial implications
The integrated characterization of the Safi clay deposits highlights their significant potential for ceramic applications. Most samples belong to illitic–kaolinitic clay facies with favourable plasticity and firing characteristics, making them appropriate for producing a wide range of structural ceramic products, including bricks, tiles, pottery and stoneware.
The only exception is the carbonate-rich marl (CB), whose low plasticity requires the incorporation of suitable additives before extrusion. For the silty clay samples that do not fit into the Winkler diagram zones, the simple addition of 10% sand provides a practical and economically viable pre-treatment. These results support the sustainable exploitation of local clay resources and provide practical guidance for ceramics manufacturers and local artisans in the Safi region.
Summary and conclusions
This study provides the first integrated evaluation of the ceramic potential of the Safi clay deposits through a combined mineralogical, geochemical and geotechnical characterization of the two main Lower Cretaceous stratigraphic facies, namely the Upper Valanginian brown clays and the Upper Hauterivian–Barremian red sandy clay layers. By integrating XRD, FTIR, XRF, grain-size distribution, Atterberg limit, carbonate content, porosity and permeability analyses, the study established clear relationships between the geological characteristics of these deposits and their technological behaviour for ceramic applications.
Although the two facies differ in lithology and depositional characteristics, they share a comparable illitic–kaolinitic mineralogical assemblage dominated by quartz, with variable proportions of feldspars, carbonates and accessory minerals. These compositional differences are reflected in their geochemical signatures and physical properties, particularly particle-size distribution, plasticity, porosity and permeability, which control their ceramic performance. The Upper Valanginian brown clays generally exhibit higher plasticity and better workability, whereas the Upper Hauterivian–Barremian red sandy clay layers provide greater dimensional stability because of their higher quartz content. The carbonate-rich marl sample (CB) constitutes a distinct lithology with limited plasticity and therefore requires blending with more plastic clays before extrusion.
The integrated interpretation of the mineralogical, chemical and geotechnical data, supported by complementary ceramic classification diagrams, demonstrates that most of the investigated materials are suitable for manufacturing structural ceramic products, including bricks, roofing tiles, pottery and stoneware. Moreover, simple technological adjustments, such as optimizing the particle-size distribution or blending materials with complementary properties, can further improve the processing behaviour of specific clay deposits and broaden their industrial applicability.
Beyond assessing the ceramic suitability of the Safi clays, this work provides new insights into the influence of lithological variability on the technological performance of Lower Cretaceous clay deposits. The proposed multidisciplinary approach constitutes a robust framework for evaluating ceramic raw materials and may be applied to similar sedimentary basins. The results also provide valuable scientific information for resource assessment and practical guidance for ceramics manufacturers and local artisans in selecting and optimizing locally available raw materials, thereby supporting the sustainable exploitation and valorization of regional clay resources.
Future research should focus on experimental firing tests, thermal analyses and the mechanical characterization of fired products, together with industrial-scale validation, to confirm the technological performance of these materials under production conditions. In addition, extending mineralogical and technological mapping throughout the Safi basin would improve resource evaluation, facilitate selective exploitation of the various clay facies and contribute to the sustainable development of the regional ceramics industry.
Acknowledgements
The authors are grateful to all the anonymous reviewers for their scientific contributions, valuable comments and suggestions, which greatly improved the quality of this paper. We also extend our sincere appreciation to Professor Nathalie Fagel, head of the AGES Laboratory, for her guidance and support. Additionally, we acknowledge the professors and researchers who generously provided access to their facilities, enabling the successful completion of our analyses. Their expertise and collaboration were invaluable to this study.
Competing interests
The authors declare none.





 Open access

