



1 Introduction
We are interested in the control of nominally two-dimensional (2D) flows, which are invariant in the spanwise direction, by three-dimensional (3D) spanwise-periodic perturbations. This type of control has long been used to suppress or attenuate vortex shedding in the wake of bluff bodies with 3D perturbations forced by devices ranging from wrapped helical cables (as discussed, for example, by Zdravkovich (Reference Zdravkovich1981)) to spanwise-periodic indentations of the trailing or leading edges (as shown by Tanner (Reference Tanner1972), Tombazis & Bearman (Reference Tombazis and Bearman1997) and many others), and has long been known to be very efficient and effective even at high Reynolds numbers
 $Re$
(as discussed by Choi, Jeon & Kim (Reference Choi, Jeon and Kim2008)). Suitable 3D perturbations have also been shown to reduce the far-field spreading of turbulent (2D) plane mixing layers up to a factor of two (Bell & Mehta Reference Bell and Mehta1993), stabilize the growth of unstable 2D Tollmien–Schlichting waves in the (2D) Blasius boundary layer (Kachanov & Tararykin Reference Kachanov and Tararykin1987; Cossu & Brandt Reference Cossu and Brandt2002; Fransson et al.
Reference Fransson, Brandt, Talamelli and Cossu2005) and delay transition to turbulence (Fransson et al.
Reference Fransson, Talamelli, Brandt and Cossu2006). They also have been shown to strongly affect the shape of axisymmetric jets (see, for example, Zaman, Reeder & Samimy (Reference Zaman, Reeder and Samimy1994)) and, when forced by azimuthally periodic chevrons, to reduce low-frequency noise emitted by axisymmetric jets (see, for example, Bridges & Brown (Reference Bridges and Brown2004), Zaman, Bridges & Huff (Reference Zaman, Bridges and Huff2011).
A number of recent studies have found that a key factor in the 3D control is the presence of spanwise-periodic and streamwise-elongated regions of alternating high- and low-speed streamwise velocity (see Choi et al. (Reference Choi, Jeon and Kim2008) for a review) – the ‘streamwise streaks’. In the context of wall-bounded shear flows it is known that streamwise streaks can be efficiently forced by low-energy streamwise vortices which fuel their growth through the lift-up effect and that the ratio of the energy of the streaks to that of the forced vortices can be proportional to
 $Re^{2}$
(see, for example, Gustavsson (Reference Gustavsson1991), Schmid & Henningson (Reference Schmid and Henningson2001)). Standard optimization techniques are used to find the optimal shape of the vortices leading to maximum energy amplification in the lift-up effect (see, for example, Schmid & Henningson (Reference Schmid and Henningson2001)). In this way, it has been possible to use minimum-energy input vortices to force the controlling streaks in the Blasius boundary layer (Cossu & Brandt Reference Cossu and Brandt2002, Reference Cossu and Brandt2004), in parallel and non-parallel 2D wakes (Del Guercio, Cossu & Pujals Reference Del Guercio, Cossu and Pujals2014a
,Reference Del Guercio, Cossu and Pujals
b
,Reference Del Guercio, Cossu and Pujals
c
), in a non-parallel axisymmetric wake (Marant, Cossu & Pujals Reference Marant, Cossu and Pujals2017) and in a turbulent pipe (Willis, Hwang & Cossu Reference Willis, Hwang and Cossu2010). In the present study we will follow a similar approach by computing the optimal perturbations of the reference 2D basic flow that will then be used to enforce the 3D control with finite-amplitude streamwise streaks.
That the beneficial effects of 3D control are related to alteration of the growth rates of the most unstable linear modes is known in the case of 3D control of laminar boundary layers (Cossu & Brandt Reference Cossu and Brandt2002, Reference Cossu and Brandt2004). In the case of free shear flows, Gudmundsson & Colonius (Reference Gudmundsson and Colonius2006, Reference Gudmundsson and Colonius2007) have shown that 3D-modulated jets (‘chevron jets’) display growth rates of the most unstable modes which are smaller than those of the reference axisymmetric jet, and have related this to the observed noise reduction (see also Jordan & Colonius (Reference Jordan and Colonius2013) for a discussion). In the case of wakes, where self-sustained oscillations are associated with a global instability driven by a pocket of local absolute instability (Chomaz, Huerre & Redekopp Reference Chomaz, Huerre and Redekopp1988; Monkewitz Reference Monkewitz1988), Hwang, Kim & Choi (Reference Hwang, Kim and Choi2013) have shown that suitable (varicose) spanwise-periodic modulations of the 2D basic flow can reduce the absolute growth rate of standard wake profiles when the spanwise wavelength of the perturbations is in a suitable range. Del Guercio et al. (Reference Del Guercio, Cossu and Pujals2014c
) have shown that the absolute instability can be completely quenched when fully nonlinear streaks forced with optimal perturbations are used. Nonlinear streaks optimally forced with spanwise-periodic blowing and suction on the body skin have then been shown to suppress the linear global instability in the wakes of circular cylinders at least up to
 $Re=100$
(Del Guercio et al.
Reference Del Guercio, Cossu and Pujals2014b
).
An interesting property of the control of 2D instabilities by means of spanwise-periodic (3D) modulations of the basic flow is that the first-order sensitivity of the eigenvalues to the control amplitude is zero and that, in general, at leading order the variation of the eigenvalue with respect to the uncontrolled (2D) case depends quadratically upon the 3D modulation amplitude. This quadratic dependence on the control amplitude was initially shown to apply to absolute growth rates of parallel wakes (Hwang et al. Reference Hwang, Kim and Choi2013), and then later shown to apply to temporal growth rates of parallel wakes (Del Guercio et al. Reference Del Guercio, Cossu and Pujals2014c ) and to the sensitivity of global modes growth rates in non-parallel wakes (Del Guercio et al. Reference Del Guercio, Cossu and Pujals2014a ,Reference Del Guercio, Cossu and Pujals b ). A key issue emphasized in the studies of Del Guercio et al. (Reference Del Guercio, Cossu and Pujals2014a ,Reference Del Guercio, Cossu and Pujals b ) is that, at the finite control amplitudes required to stabilize flows at Reynolds numbers relatively far from the onset of the instability, the quadratic sensitivity of 3D controls, combined with the large amplifications associated with the (inherently 3D) lift-up effect, result in much higher efficiencies of the 3D controls when compared to 2D controls.
Further studies have explicitly computed the second-order sensitivity by asymptotic analyses of a model equation (Cossu Reference Cossu2014) and of the linearized Navier–Stokes equations (Tammisola et al. Reference Tammisola, Giannetti, Citro and Juniper2014; Boujo, Fani & Gallaire Reference Boujo, Fani and Gallaire2015; Tammisola Reference Tammisola2017). In particular, Boujo et al. (Reference Boujo, Fani and Gallaire2015), considering the case of a plane mixing layer, show that the (3D) spanwise-periodic basic-flow distortions maximizing the second-order sensitivity of the Kelvin–Helmholtz instability growth rate coincide with those inducing the maximum energy amplification of streamwise streaks, therefore explaining a posteriori the success of optimally grown streaks for control purposes.
An important issue when dealing with stability analysis of spanwise-periodic 3D-distorted basic flows is the definition of the basic flow itself, which can be classified into two main types of approach:
-
(i) In the first approach, the basic flow is given by experimental measures or direct numerical simulations, and streamwise velocity profiles are of the form
 $U(y,z,X;A)$
, where
$X$
is the selected streamwise station (omitted in some parallel-flow analyses),
$y$
is the cross-stream direction,
$z$
is the spanwise (or azimuthal) direction in which periodic modulations of
$U$
are enforced, and
$A$
is the control or modulation amplitude defined in some suitable way (inclination of chevrons or amplitude of optimal vortices, etc.). This approach has been followed by Cossu & Brandt (Reference Cossu and Brandt2002), Gudmundsson & Colonius (Reference Gudmundsson and Colonius2006), Gudmundsson & Colonius (Reference Gudmundsson and Colonius2007), Del Guercio et al. (Reference Del Guercio, Cossu and Pujals2014a
,Reference Del Guercio, Cossu and Pujals
b
,Reference Del Guercio, Cossu and Pujals
c
), Marant et al. (Reference Marant, Cossu and Pujals2017), among others.
-
(ii) In the second approach, a shape assumption (see, for example, Herbert (Reference Herbert1988)) is made and, typically, the streamwise velocity profiles are postulated in the form
$U_{SA}(y,z,X;A)=U_{2D}(y)+AU_{1}(y,X)\cos (\unicode[STIX]{x1D6FD}z)$
, where
$\unicode[STIX]{x1D6FD}$
is the spanwise (or azimuthal) wavenumber associated with the periodic basic-flow modulations. In this approach, followed by Hwang et al. (Reference Hwang, Kim and Choi2013), Cossu (Reference Cossu2014), Tammisola et al. (Reference Tammisola, Giannetti, Citro and Juniper2014), Boujo et al. (Reference Boujo, Fani and Gallaire2015) and Tammisola (Reference Tammisola2017), only the first spanwise-harmonic of the basic-flow distortion is taken into account; the effects of higher spanwise-harmonics and of the zeroth spanwise-harmonic (the ‘mean flow distortion’) are neglected.




In most of the mentioned studies, especially in the discussion of the results, it is implicitly admitted that the two different approaches lead to similar results, at least qualitatively. A warning against this rationale, however, came from Cossu & Brandt (Reference Cossu and Brandt2002), who, using 3D basic flows given by nonlinear simulations, studied their stabilizing effect on the Tollmien–Schlichting instability in the Blasius boundary layer. They showed that, while the mean flow distortion
 $\overline{\unicode[STIX]{x0394}U}$
(the zeroth spanwise-harmonic component) associated with the 3D basic-flow distortion
 $\unicode[STIX]{x0394}U=U_{3D}-U_{2D}$
had a (leading) stabilizing effect, the spanwise-oscillating part
 $\widetilde{\unicode[STIX]{x0394}U}$
of the 3D basic-flow distortion had a destabilizing effect. In the subsequent analysis of parallel wakes by Del Guercio et al. (Reference Del Guercio, Cossu and Pujals2014c
),
 $\overline{\unicode[STIX]{x0394}U}$
and
 $\widetilde{\unicode[STIX]{x0394}U}$
were found to be both stabilizing and of comparable relevance, and therefore the issue was not further pursued.
In the present study we will therefore address the important issue of the correct definition of the basic flow and try to answer some questions related to it. Can the use of shape assumptions to analyse the influence of 3D spanwise-periodic basic-flow distortions on linear stability provide potentially misleading results in flows other than the Blasius boundary layer? If yes, is this explained by the influence of the (spanwise) mean flow distortion alone or are higher spanwise-harmonics relevant? If shape assumptions are not correct, does this mean that second-order sensitivity analyses systematically provide results which are potentially misleading? Why quadratic sensitivities of the eigenvalues are observed also when the basic flow is computed with fully nonlinear simulations despite the fact that eigenvalues have non-zero first-order sensitivity to mean flow distortions (which are spanwise-uniform)?
We choose, as a test bed for the analysis, the 3D control of the Kelvin–Helmholtz instability developing in the plane (spanwise-uniform) mixing layer with a hyperbolic-tangent profile, whose stability properties have been well known since the investigations of Garcia (Reference Garcia1956), Drazin & Howard (Reference Drazin and Howard1962), Michalke (Reference Michalke1964), and Huerre & Monkewitz (Reference Huerre and Monkewitz1985).
Despite its theoretical and practical relevance as the prototype of inflectional instabilities, the plane mixing layer has not been extensively studied from the theoretical perspective of optimal amplifications of streamwise streaks or of the stabilization by means of spanwise-periodic (3D) flow distortions. Arratia, Caulfield & Chomaz (Reference Arratia, Caulfield and Chomaz2013) have computed the optimal perturbations supported by the
 $\tanh$
mixing layer, not for control purposes, but to analyse the development of instabilities in the transition process. As they were not restricted to streamwise-uniform perturbations, the optimal perturbations found were the unstable ones which were the most amplified. Arratia & Chomaz (Reference Arratia and Chomaz2013) have analytically computed the optimal perturbations of arbitrary shear flow profiles, and in particular that of the erf-profile mixing layer in the inviscid limit. Boujo et al. (Reference Boujo, Fani and Gallaire2015) have addressed the 3D control of mixing layers restricted to streamwise-uniform perturbations. They have developed a second-order sensitivity analysis aimed at finding the most efficient control of the hyperbolic-tangent mixing layer. Among other results, they have computed the most stabilizing streak profiles and find that they almost coincide with the optimal or the suboptimal ones, depending on the spanwise wavenumber. However, as their analysis is based on a shape assumption, we will revisit it by using basic-flow profiles given by fully nonlinear numerical simulations.
This study is organized as follows. After briefly introducing, in § 2, the problem formulation and the theoretical and numerical methods that will be used, we compute, in § 3, the linear optimal (and the leading suboptimal) streamwise-uniform (linearly stable) perturbations which maximize the energy amplification supported by the hyperbolic-tangent profile. Streaky mixing layers are then computed by nonlinear simulations of the response of the mixing layer to optimal perturbations enforced with finite amplitudes. The influence of the enforced 3D modulations (nonlinear streaks) on the temporal growth rate and on the convective–absolute instability thresholds of the Kelvin–Helmholtz instability are described in § 4. A comparison of the results with those obtained under a shape assumption is made in § 5. The self-similarity and the scaling of the mean flow distortion, and its influence on the temporal stability and on the absolute–convective instability thresholds are then discussed. A composite second-order sensitivity formula is finally proposed. The implications of these results are discussed in § 6.
2 Problem formulation and methods
2.1 Problem formulation
We consider parallel mixing layers separating two parallel streams of the same density and velocities
 $U_{a}\boldsymbol{e}_{x}$
and
 $U_{b}\boldsymbol{e}_{x}$
, respectively, for
 $|y|\rightarrow \infty$
, where
 $\boldsymbol{e}_{x}$
is the unit vector along the streamwise direction
 $x$
(
 $y$
and
 $z$
will denote the cross-stream and spanwise coordinates, respectively). The hyperbolic-tangent profile is chosen as a reference two-dimensional (2D) basic flow
 $\boldsymbol{U}_{2D}=U_{2D}(y)\boldsymbol{e}_{x}$
with
 $$\begin{eqnarray}\displaystyle U_{2D}(y)=\frac{1}{2R}+\frac{1}{2}\tanh y, & & \displaystyle\end{eqnarray}$$
where velocities are made dimensionless with respect to
 $|U_{a}-U_{b}|$
, lengths with respect to half the vorticity thickness
 $\unicode[STIX]{x1D6FF}_{\unicode[STIX]{x1D714}}/2$
and the velocity ratio is defined as
 $R=|U_{a}-U_{b}|/|U_{a}+U_{b}|$
.
In the following we will consider essentially perturbations to the reference 2D parallel basic-flow profile
 $\boldsymbol{U}_{2D}$
and to 3D ‘streaky’ parallel basic-flow profiles
 $\boldsymbol{U}_{3D}=U(y,z)\,\boldsymbol{e}_{x}$
. The evolution of incompressible viscous perturbations
 $\boldsymbol{u}^{\prime },p^{\prime }$
to the considered parallel basic flows is ruled by the Navier–Stokes equation in perturbation form:
 $$\begin{eqnarray}\displaystyle & \displaystyle \unicode[STIX]{x1D735}\boldsymbol{\cdot }\boldsymbol{u}^{\prime }=0, & \displaystyle\end{eqnarray}$$
 $$\begin{eqnarray}\displaystyle & \displaystyle \frac{\unicode[STIX]{x2202}\boldsymbol{u}^{\prime }}{\unicode[STIX]{x2202}t}+(\unicode[STIX]{x1D735}\boldsymbol{U})\boldsymbol{u}^{\prime }+(\unicode[STIX]{x1D735}\boldsymbol{u}^{\prime })\boldsymbol{U}+(\unicode[STIX]{x1D735}\boldsymbol{u}^{\prime })\boldsymbol{u}^{\prime }=-\unicode[STIX]{x1D735}p^{\prime }+\frac{1}{Re}\unicode[STIX]{x1D6FB}^{2}\boldsymbol{u}^{\prime }, & \displaystyle\end{eqnarray}$$
where
 $\boldsymbol{U}$
is the considered (2D or 3D) basic flow and the Reynolds number is defined as
 $Re=|U_{a}-U_{b}|\unicode[STIX]{x1D6FF}_{\unicode[STIX]{x1D714}}/2\unicode[STIX]{x1D708}$
, with
 $\unicode[STIX]{x1D708}$
the kinematic viscosity of the fluid. In the linearized stability framework the term
 $(\unicode[STIX]{x1D735}\boldsymbol{u}^{\prime })\boldsymbol{u}^{\prime }$
is neglected. Equations (2.2)–(2.3) are supplemented by the condition that perturbations vanish for
 $|y|\rightarrow \infty$
and that they are periodic in the streamwise and spanwise directions with wavelengths
 $\unicode[STIX]{x1D706}_{x}$
and
 $\unicode[STIX]{x1D706}_{z}$
, respectively (the associated wavenumbers are
 $\unicode[STIX]{x1D6FC}=2\unicode[STIX]{x03C0}/\unicode[STIX]{x1D706}_{x}$
and
 $\unicode[STIX]{x1D6FD}=2\unicode[STIX]{x03C0}/\unicode[STIX]{x1D706}_{z}$
).
2.2 Numerical integration of the Navier–Stokes equations
The Navier–Stokes solutions are numerically integrated with OpenFOAM, an open-source code (see OpenCFD 2007) which is based on a finite-volume spatial discretization of the equations which are advanced in time using the PISO (Pressure Implicit with Splitting of Operators) algorithm. An ‘in-house’ modified version of the code is used, where the Navier–Stokes equations are formulated in perturbation form and can be integrated in the fully nonlinear form or under the linear approximation. This version of the code has been extensively used and validated in the previous studies of Del Guercio et al. (Reference Del Guercio, Cossu and Pujals2014a
,Reference Del Guercio, Cossu and Pujals
b
,Reference Del Guercio, Cossu and Pujals
c
). The flow is solved inside the domain
 $[-L_{x}/2,L_{x}/2]\times [-L_{y}/2,L_{y}/2]\times [-L_{z}/2,L_{z}/2]$
, which is discretized with
 $N_{x}$
and
 $N_{z}$
equally spaced intervals in the streamwise and spanwise directions, respectively.
 $N_{y}$
intervals are used in the
 $y$
(shear) direction using a stretching allowing one to refine the grid in the shear region of the basic flow. Typically, results have been obtained using
 $L_{x}=300$
,
 $L_{y}=20$
,
 $L_{z}=2\unicode[STIX]{x03C0}/\unicode[STIX]{x1D6FD}$
and
 $N_{x}=750$
(corresponding to
 $\unicode[STIX]{x0394}x=0.4$
),
 $N_{y}=102$
(with
 $\unicode[STIX]{x0394}y$
ranging from
 $0.06$
near
 $y=0$
to
 $1.2$
near the free-stream boundaries),
 $N_{z}=24$
for
 $\unicode[STIX]{x1D6FD}=1$
and
 $\unicode[STIX]{x1D6FD}=2$
and
 $N_{z}=16$
for
 $\unicode[STIX]{x1D6FD}=3$
(corresponding to
 $\unicode[STIX]{x0394}z=0.26$
for
 $\unicode[STIX]{x1D6FD}=1$
and
 $\unicode[STIX]{x0394}z=0.13$
for
 $\unicode[STIX]{x1D6FD}=2$
and
 $\unicode[STIX]{x1D6FD}=3$
). In addition to the periodic boundary conditions applied in the streamwise and spanwise directions, zero normal gradients of velocity and pressure have been enforced at the lateral (pseudo-free stream) boundaries (
 $|y|=L_{y}/2$
).
2.3 Optimal and suboptimal streamwise streaks
Similarly to many previous investigations, such as those of Reddy et al. (Reference Reddy, Schmid, Baggett and Henningson1998), Cossu & Brandt (Reference Cossu and Brandt2002), Del Guercio et al. (Reference Del Guercio, Cossu and Pujals2014c
), among others, the first step of the investigation consists in the computation of the optimal (and suboptimal) linear energy growths sustained by the 2D reference mixing layer. As the basic flow is invariant in the streamwise and spanwise directions, Fourier modes
 $\widehat{\boldsymbol{u}}(\unicode[STIX]{x1D6FC},y,\unicode[STIX]{x1D6FD},t)\,\text{e}^{\text{i}(\unicode[STIX]{x1D6FC}x+\unicode[STIX]{x1D6FD}z)}$
of streamwise and spanwise wavenumbers
 $\unicode[STIX]{x1D6FC}$
and
 $\unicode[STIX]{x1D6FD}$
can be considered separately. In particular, in the following we will consider the optimal amplification of streamwise-uniform perturbations (i.e. with
 $\unicode[STIX]{x1D6FC}=0$
) because they are linearly stable and mimic, in the temporal analysis, the steady perturbations that would be spatially forced by passive devices.
We therefore compute the optimal energy growth
 $G=\max _{\widehat{\boldsymbol{u}}_{0}\neq \mathbf{0}}\Vert \widehat{\boldsymbol{u}}\Vert ^{2}/\Vert \widehat{\boldsymbol{u}}_{0}\Vert ^{2}$
, where
 $\widehat{\boldsymbol{u}}_{0}$
is the initial condition and
 $\Vert \widehat{\boldsymbol{u}}\Vert ^{2}=(1/\unicode[STIX]{x1D6FF}_{\unicode[STIX]{x1D714}}\unicode[STIX]{x1D706}_{z})\int _{-\infty }^{\infty }\int _{-\unicode[STIX]{x1D706}_{z}/2}^{\unicode[STIX]{x1D706}_{z}/2}|\widehat{\boldsymbol{u}}|^{2}\,\text{d}y\,\text{d}z$
. As usual, in order to compute the optimal transient growth, the linearized Navier–Stokes equations are recast in terms of the cross-stream velocity and vorticity
 $v^{\prime }-\unicode[STIX]{x1D702}^{\prime }$
. The system satisfied by Fourier modes
 $\widehat{v}(y,t)\text{e}^{\text{i}(\unicode[STIX]{x1D6FC}x+\unicode[STIX]{x1D6FD}z)}$
,
 $\widehat{\unicode[STIX]{x1D702}}(y,t)\text{e}^{\text{i}(\unicode[STIX]{x1D6FC}x+\unicode[STIX]{x1D6FD}z)}$
is the standard Orr–Sommerfeld–Squire system. The optimal energy growth corresponds to the largest singular value of the linearized stability operator (see, for example, Schmid & Henningson (Reference Schmid and Henningson2001)). We will also compute the second-largest singular value and the associated perturbations and, for brevity, denote them ‘suboptimal’ and ‘suboptimal perturbations’. Suboptimal growths and perturbations are computed because in the previous investigations of Del Guercio et al. (Reference Del Guercio, Cossu and Pujals2014a
,Reference Del Guercio, Cossu and Pujals
c
) it was shown that (suboptimal) varicose perturbations were more efficient than the optimal sinuous ones in suppressing vortex shedding in 2D wakes, despite being much less amplified.
Differentiation matrices based on second-order accurate finite differences have been used to discretize the Orr–Sommerfeld–Squire system on a grid of
 $N_{y}$
points uniformly distributed in
 $[-L_{y}/2,L_{y}/2]$
, as in Del Guercio et al. (Reference Del Guercio, Cossu and Pujals2014c
). The optimal and (leading) suboptimal growth supported by the discretized system and the associated perturbations are then computed using standard methods and codes already used in previous investigations (for example, Cossu, Pujals & Depardon (Reference Cossu, Pujals and Depardon2009), Pujals et al. (Reference Pujals, García-Villalba, Cossu and Depardon2009), Del Guercio et al. (Reference Del Guercio, Cossu and Pujals2014c
)). Most of the results have been obtained with
 $N_{y}=201$
and
 $L_{y}=20$
, but it has been verified on selected cases that the results are not significantly affected if the number of points is doubled and/or if
 $L_{y}$
is further increased.
2.4 Nonlinear streaky basic flows
Continuing to follow the approach used in the previous investigations of Reddy et al. (Reference Reddy, Schmid, Baggett and Henningson1998), Cossu & Brandt (Reference Cossu and Brandt2002), Brandt et al. (Reference Brandt, Cossu, Chomaz, Huerre and Henningson2003), Cossu & Brandt (Reference Cossu and Brandt2004), Park, Hwang & Cossu (Reference Park, Hwang and Cossu2011) and Del Guercio et al. (Reference Del Guercio, Cossu and Pujals2014c
), the 3D basic-flow distortions induced by finite-amplitude linear optimal and suboptimal perturbations are computed by using them as initial conditions with finite amplitude
 $A_{0}$
:
 $\boldsymbol{U}_{3D}(y,z;t=0)=\boldsymbol{U}_{2D}(y)+A_{0}\boldsymbol{u}^{(opt)}(y,z)$
, where
 $\boldsymbol{u}^{(opt)}(y,z)=\widehat{\boldsymbol{u}}^{(opt)}(y)\cos (2\unicode[STIX]{x03C0}z/\unicode[STIX]{x1D706}_{z})$
and
 $\Vert \boldsymbol{u}^{(opt)}\Vert =1$
. Fully nonlinear Navier–Stokes simulations with these initial conditions are used to compute a set of streaky mixing layer solutions
 $\boldsymbol{U}_{3D}(y,z,t,A_{0})$
. The amplitude of the streaks associated with these nonlinear solutions is defined as:
 $$\begin{eqnarray}A_{s}=\left.\left[\max _{y,z}(U_{3D}-U_{2D})-\min _{y,z}(U_{3D}-U_{2D})\right]\right/2.\end{eqnarray}$$
As the temporal scale on which the streaky basic flows evolve is viscous (slow and of order
 ${\sim}1/Re$
) while the one associated with the Kelvin–Helmholtz (inflectional, inviscid) instability is convective (fast), it is appropriate to analyse the linear stability of ‘frozen’ streaky profiles. Following the previous investigations mentioned, we will analyse the stability of the streaky basic flows extracted at the time
 $t_{max}$
at which they reach their maximum amplitude
 $A_{s,max}$
. This defines a set of parallel streaky mixing layers
 $\boldsymbol{U}_{3D}(y,z;\unicode[STIX]{x1D6FD},A_{0})$
at the considered Reynolds number.
2.5 Impulse response analysis
The linear impulse response supported by reference (2D) and the streaky (3D) mixing layers is analysed in order to determine their linear stability properties, following Huerre & Monkewitz (Reference Huerre and Monkewitz1990). The mixing layer is linearly stable if the amplitude of the impulse response tends to zero as
 $t\rightarrow \infty$
and unstable otherwise. The instability is absolute if the impulse response amplitude grows in the position of the initial pulse, while it is convective if it eventually tends to zero in the position of the initial pulse despite growing while being advected by the flow (see, for example, Bers (Reference Bers, Rosenbluth and Sagdeev1983), Huerre & Monkewitz (Reference Huerre and Monkewitz1985)).
The linear impulse response is computed by numerically integrating the Navier–Stokes equations (2.2)–(2.3) linearized near the considered basic flow
 $\boldsymbol{U}$
using
 $(u_{0}^{\prime },v_{0}^{\prime },w_{0}^{\prime })=(\unicode[STIX]{x2202}\unicode[STIX]{x1D713}_{0}^{\prime }/\unicode[STIX]{x2202}y,-\unicode[STIX]{x2202}\unicode[STIX]{x1D713}_{0}^{\prime }/\unicode[STIX]{x2202}x,0)$
as initial condition to approach the forcing by a delta function in space, where
 $\unicode[STIX]{x1D713}_{0}^{\prime }=A_{imp}\text{e}^{-(x-x_{0})^{2}/2\unicode[STIX]{x1D70E}_{x}^{2}-(y-y_{0})^{2}/2\unicode[STIX]{x1D70E}_{y}^{2}-(z-z_{0})^{2}/2\unicode[STIX]{x1D70E}_{z}^{2}}$
. This type of initial condition has already been used in a number of previous investigations, such as those of Delbende & Chomaz (Reference Delbende and Chomaz1998) and Del Guercio et al. (Reference Del Guercio, Cossu and Pujals2014c
). The parameters
 $\unicode[STIX]{x1D70E}_{x}=0.83$
,
 $\unicode[STIX]{x1D70E}_{y}=0.83$
and
 $\unicode[STIX]{x1D70E}_{z}=0.3$
for
 $\unicode[STIX]{x1D6FD}=1$
,
 $\unicode[STIX]{x1D70E}_{z}=0.15$
for
 $\unicode[STIX]{x1D6FD}=2$
and
 $\unicode[STIX]{x1D6FD}=3$
have been chosen small enough to reproduce a localized impulse within the limits of good resolution. The impulse is centred in
 $x_{0}=0$
,
 $y_{0}=0.8$
,
 $z_{0}=\unicode[STIX]{x1D706}_{z}/4$
, ensuring that no particular symmetry is preserved by the initial condition. The precise position of the initial pulse affects the initial transients but, in general, has no influence on the asymptotic impulse response.
The temporal and spatio-temporal stability properties of the considered basic-flow profile are retrieved from the numerically computed impulse response using the same techniques and codes used by Brandt et al. (Reference Brandt, Cossu, Chomaz, Huerre and Henningson2003) and Del Guercio et al. (Reference Del Guercio, Cossu and Pujals2014c ), which are the three-dimensional extension of the ones developed by Delbende & Chomaz (Reference Delbende and Chomaz1998) and Delbende, Chomaz & Huerre (Reference Delbende, Chomaz and Huerre1998) for two-dimensional wakes.
Let us summarize the procedure followed by denoting with
 $q^{\prime }(x,y,z,t)$
the generic perturbation variable (which, in this study, is the normal velocity component
 $v^{\prime }$
). In order to extract the temporal growth rate
 $\unicode[STIX]{x1D714}_{i}(\unicode[STIX]{x1D6FC})$
(the imaginary part of
 $\unicode[STIX]{x1D714}$
) from the signal, we first compute the
 $x$
-Fourier transform
 $\tilde{q}(\unicode[STIX]{x1D6FC},y,z,t)$
of
 $q^{\prime }$
and then define the amplitude spectrum of
 $q$
as
 $\widetilde{Q}^{2}(\unicode[STIX]{x1D6FC},t)=\int _{-L_{y}/2}^{L_{y}/2}\int _{-L_{z}/2}^{L_{z}/2}|\tilde{q}|^{2}\,\text{d}y\,\text{d}z.$
For each given streamwise wavenumber
 $\unicode[STIX]{x1D6FC}$
, for sufficiently large times, the leading temporal mode has emerged with a growth rate well approximated by
 $\unicode[STIX]{x1D714}_{i}(\unicode[STIX]{x1D6FC})\sim \text{d}\ln \widetilde{Q}/\text{d}t$
, which is computed using the finite-difference formula
 $\unicode[STIX]{x1D714}_{i}(\unicode[STIX]{x1D6FC})\approx [\ln \widetilde{Q}(\unicode[STIX]{x1D6FC},t_{2})-\ln \widetilde{Q}(\unicode[STIX]{x1D6FC},t_{1})]/(t_{2}-t_{1})$
with suitably chosen times
 $t_{1}$
and
 $t_{2}$
(typically
 $t_{1}=40$
and
 $t_{2}=80$
in our case).
(a) Optimal energy growth curves
 $G(t)$
for three selected spanwise wavenumbers for
 $Re=1000$
. (b) Dependence of the rescaled maximum energy growth
 $G_{max}/Re^{2}$
on the spanwise wavenumber
 $\unicode[STIX]{x1D6FD}$
for optimal sinuous perturbations (S-type, solid line, violet) and suboptimal varicose perturbations (V-type, dashed line, green). Results obtained at three selected Reynolds numbers are shown to verify the accuracy of the
 $Re^{2}$
scaling.

In the spatio-temporal stability analysis the development of the impulse response wave packet is considered along
 $x/t=v_{g}$
rays. To demodulate the wave packet we use the Hilbert transform, which in wavenumber space is defined by
 $\tilde{q}_{H}(\unicode[STIX]{x1D6FC},y,z,t)=2H(\unicode[STIX]{x1D6FC})\tilde{q}(\unicode[STIX]{x1D6FC},y,z,t)$
, where
 $H(\unicode[STIX]{x1D6FC})$
is the Heaviside unit-step function. The (demodulated) signal amplitude
 $Q$
is then defined as
 $Q^{2}(x,t)=\int _{-L_{y}/2}^{L_{y}/2}\int _{-L_{z}/2}^{L_{z}/2}|q_{H}|^{2}\,\text{d}y\,\text{d}z$
, where
 $q_{H}$
is the inverse
 $x$
-Fourier transform of
 $\tilde{q}_{H}$
. According to steepest-descent arguments (e.g. Bers Reference Bers, Rosenbluth and Sagdeev1983)
 $Q(x,t)\propto t^{-1/2}\text{e}^{\text{i}[\unicode[STIX]{x1D6FC}(v_{g})x-\unicode[STIX]{x1D714}(v_{g})t]}$
as
 $t\rightarrow \infty$
, where
 $\unicode[STIX]{x1D6FC}(v_{g})$
and
 $\unicode[STIX]{x1D714}(v_{g})$
represent the complex wavenumber and frequency travelling at the group velocity
 $v_{g}$
. The real part of the exponential
 $\unicode[STIX]{x1D70E}(v_{g})=\unicode[STIX]{x1D714}_{i}(v_{g})-\unicode[STIX]{x1D6FC}_{i}(v_{g})v_{g}$
is the temporal growth rate observed while travelling at the velocity
 $v_{g}$
, and it can be evaluated for large
 $t$
as
 $\unicode[STIX]{x1D70E}(v_{g})\sim \text{d}\ln [t^{1/2}\,Q(v_{g}t,t)]/\text{d}t$
, which is approximated by
 $\unicode[STIX]{x1D70E}(v_{g})\approx [\ln Q(v_{g}t_{2},t_{2})-\ln Q(v_{g}t_{1},t_{1})]/(t_{2}-t_{1})+(1/2)(\ln t_{2}-\ln t_{1})/(t_{2}-t_{1})$
, where
 $t_{1}=60$
and
 $t_{2}=100$
for the presented results.
3 Optimal perturbations of the hyperbolic-tangent mixing layer and associated nonlinear streaky mixing layers
3.1 Optimal linear perturbations
Optimal and suboptimal energy amplifications
 $G(t)$
sustained by the 2D reference mixing layer have been computed, as detailed in § 2.3, for selected spanwise wavenumbers and Reynolds numbers. We find that, for a given Reynolds number, the energy amplifications increase with increasing spanwise wavelengths
 $\unicode[STIX]{x1D706}_{z}$
(decreasing spanwise wavenumbers
 $\unicode[STIX]{x1D6FD}$
) and that the time
 $t_{max}$
at which the maximum energy amplification
 $G_{max}$
is reached also increases with
 $\unicode[STIX]{x1D706}_{z}$
, as exemplified in figure 1(a), where are reported three optimal amplification curves corresponding to three selected spanwise wavelengths at
 $Re=1000$
. From the figure it is also seen that the computed
 $G(t)$
curves typically have a single maximum and tend to zero for large times. The attained maximum energy amplifications can be quite large at the considered
 $Re=1000$
. Our results verify the prediction of Gustavsson (Reference Gustavsson1991) that in the limit of small
 $\unicode[STIX]{x1D6FC}Re$
(which is verified here as we consider
 $\unicode[STIX]{x1D6FC}=0$
perturbations)
 $G_{max}$
and
 $t_{max}$
are proportional to
 $Re^{2}$
and
 $Re$
, respectively. This can be verified in figure 1(b), where the rescaled curves
 $G_{max}/Re^{2}$
obtained for
 $Re=200$
,
 $Re=500$
and
 $Re=1000$
are shown to collapse for all the considered values of
 $\unicode[STIX]{x1D6FD}$
. The same is found for
 $t_{max}/Re$
(not shown). From the same figure it can also be seen how the maximum energy growths
 $G_{max}$
(and the associated
 $t_{max}$
, not shown) increase with
 $\unicode[STIX]{x1D706}_{z}$
(decrease with
 $\unicode[STIX]{x1D6FD}$
) in the range of considered
 $\unicode[STIX]{x1D6FD}$
values, similarly to what was observed by Del Guercio et al. (Reference Del Guercio, Cossu and Pujals2014c
) in parallel wakes. Similar considerations apply to the leading suboptimal perturbations (dotted green curve in figure 1
b), which are amplified one decade less than the optimal ones.
Cross-stream view of the optimal (a) and suboptimal (b) streamwise-uniform perturbations of the hyperbolic-tangent 2D reference mixing layer for
 $Re=1000$
and
 $\unicode[STIX]{x1D6FD}=2$
. The arrows represent the cross-stream velocity components of optimal initial vortices and the contour lines the iso-levels of the streamwise component of the corresponding maximally amplified streak (solid lines correspond to positive levels, dashed lines to negative levels).

Profiles of the hyperbolic-tangent reference basic velocity
 $U_{2D}(y)$
(a) and of the
 $\widehat{v}$
component of the optimal initial (
 $t=0$
) vortices (b,d) and of the
 $\widehat{u}$
component of the corresponding optimally amplified (
 $t=t_{max}$
) streaks (c,e), respectively, corresponding to the optimal sinuous (b,c) and suboptimal varicose (d,e) perturbations for
 $\unicode[STIX]{x1D6FD}=1$
(
 $\unicode[STIX]{x1D706}_{z}=6.3$
, solid, violet),
 $\unicode[STIX]{x1D6FD}=2$
(
 $\unicode[STIX]{x1D706}_{z}=3.1$
, dashed, green) and
 $\unicode[STIX]{x1D6FD}=3$
(
 $\unicode[STIX]{x1D706}_{z}=2.1$
, dotted, dark red) and
 $Re=1000$
.

Optimal initial perturbations are found to correspond to spanwise-periodic streamwise vortices (with negligible streamwise velocity component) while the most amplified perturbations correspond to spanwise-periodic streamwise streaks (with negligible cross-stream velocity components). The most amplified initial condition and response are found to satisfy the following symmetries of the velocity field with respect to the
 $y=0$
plane (see figures 2
a, 3
b and 3
c):
 $\widehat{u}(-y)=\widehat{u}(y)$
,
 $\widehat{v}(-y)=\widehat{v}(y)$
,
 $\widehat{w}(-y)=-\widehat{w}(y)$
. The shape of the computed optimal
 $\widehat{v}(y)$
profile is qualitatively consistent with the solution of Arratia & Chomaz (Reference Arratia and Chomaz2013), which was computed in the inviscid limit for a slightly different basic flow. The (leading) suboptimal perturbations have opposite symmetries (see figures 2
b and 3
d,e). From figure 3 it can also be seen how the size of optimal and suboptimal perturbations increases with
 $\unicode[STIX]{x1D706}_{z}$
in both the spanwise and the normal directions.
3.2 Nonlinear streaky mixing layers
A set of nonlinear streaky mixing layers is computed by integration of the fully nonlinear Navier–Stokes equations using the optimal sinuous and suboptimal varicose perturbations as initial condition with finite initial amplitude
 $A_{0}$
, as explained in § 2.4.
The dependence of the maximum streak amplitude, at which the basic-flow profiles are extracted, on
 $A_{0}$
is shown in figure 4. A substantially linear dependence of
 $A_{s,max}$
on
 $A_{0}$
is observed. Only a slight departure from linearity can be noticed for suboptimal varicose perturbations. The times at which
 $A_{s,max}$
is attained do not depend significantly on the considered amplitude (not shown). Despite the substantially linear
 $A_{s,max}(A_{0})$
behaviour, which is not surprising for the small values of
 $A_{s,max}$
considered, nonlinearity is, however, already fully acting, inducing a nonlinear modification of the spanwise-averaged mean flow that has important consequences, as discussed in § 5.
Dependence of the maximum streak amplitude
 $A_{s}$
on the amplitude
 $A_{0}$
of the optimal initial condition for the optimal sinuous (a) and suboptimal varicose (b) perturbations for three selected spanwise wavenumbers at
 $Re=1000$
.

Cross-stream view of the
 $U_{3D}(y,z)$
iso-contours of the streamwise-uniform streaky basic flows obtained by forcing optimal sinuous perturbations (
 $A_{s}=14.8\,\%$
, a) and suboptimal varicose perturbations (
 $A_{s}=14.6\,\%$
, b) for
 $Re=1000$
and
 $\unicode[STIX]{x1D6FD}=2$
. Solid (dashed) lines correspond to positive (negative) contours.

Two sample nonlinear streaky basic flows, obtained for
 $\unicode[STIX]{x1D6FD}=2$
, with amplitudes
 $A_{s}\approx 15\,\%$
are reported in figure 5. From the figure it can be seen that the forcing of optimal perturbations (a) induces a sinuous distortion of the mixing layer in the cross-stream plane, while suboptimal perturbations (b) induce a varicose distortion. In the following we will therefore mainly refer to optimal perturbations as sinuous perturbations and to the leading suboptimal perturbations as varicose perturbations.
4 Influence of streaks on the stability of the mixing layer
4.1 Influence of nonlinear streaks on the temporal growth rate
We first examine the influence of nonlinear streaks of increasing amplitude on the temporal stability by postprocessing the numerically computed linear impulse responses (as described in § 2.5) of the considered basic flows (described in § 3.2) in order to compute the growth-rate curves
 $\unicode[STIX]{x1D714}_{i}(\unicode[STIX]{x1D6FC})$
. The considered Reynolds number
 $Re=1000$
is sufficiently large for the viscous effects to be almost negligible.
In the absence of streaks (
 $A_{0}=A_{s}=0$
) the known characteristics of the Kelvin–Helmholtz instability developing on the 2D hyperbolic-tangent reference mixing layer are retrieved. The maximum growth rate is
 $\unicode[STIX]{x1D714}_{i,max}=0.09$
, reached for
 $\unicode[STIX]{x1D6FC}_{max}=0.45$
, and the cutoff wavelength (the wavelength separating the unstable waveband with
 $\unicode[STIX]{x1D714}_{i}>0$
from the stable region where
 $\unicode[STIX]{x1D714}_{i}<0$
) is
 $\unicode[STIX]{x1D6FC}_{c}=0.98$
; these values are in reasonable agreement with those (respectively
 $0.095$
,
 $0.44$
and
 $1$
) found in the inviscid limit by Michalke (Reference Michalke1964).
We find that the forcing of the nonlinear sinuous streaks of increasing amplitude has an increasingly stabilizing effect on the Kelvin–Helmholtz instability: both the maximum growth rate and the cutoff streamwise wavenumber are indeed reduced (as shown in figure 6
a, for
 $\unicode[STIX]{x1D6FD}=2$
). The opposite is found for the nonlinear varicose streaks, which have a slightly destabilizing effect associated with a slight increase of the maximum growth rate and with an increase of the cutoff wavenumber (see figure 6
b for
 $\unicode[STIX]{x1D6FD}=2$
). Similar results are obtained for
 $\unicode[STIX]{x1D6FD}=1$
and
 $\unicode[STIX]{x1D6FD}=3$
.
The dependence of the maximum temporal growth rate
 $\unicode[STIX]{x1D714}_{i,max}$
on the streak amplitude is shown in figure 7. In the sinuous case (figure 7
a) the maximum growth-rate reductions show a clear quadratic dependence on the streak amplitude
 $A_{s}$
. In the varicose case (figure 7
b) the increase of maximum growth rates is almost negligible and no quadratic dependence can be clearly established.
Influence of increasing amplitudes of the streaks on the temporal growth rates
 $\unicode[STIX]{x1D714}_{i}(\unicode[STIX]{x1D6FC})$
for optimal sinuous (a) and suboptimal varicose (b) perturbations for
 $\unicode[STIX]{x1D6FD}=2$
and
 $Re=1000$
.

Influence of increasing amplitudes of the streaks on the maximum temporal growth rates
 $\unicode[STIX]{x1D714}_{i,max}$
for optimal sinuous (a) and suboptimal varicose (b) perturbations for selected values of the spanwise wavenumber
 $\unicode[STIX]{x1D6FD}$
at
 $Re=1000$
.

4.2 Influence of nonlinear streaks on spatio-temporal growth rates
The impulse response analysis is then used to retrieve the spatio-temporal growth rates
 $\unicode[STIX]{x1D70E}(v_{g})$
supported by the streaky mixing layers along the rays
 $x/t=v_{g}$
at
 $Re=1000$
. Huerre & Monkewitz (Reference Huerre and Monkewitz1985) had shown that in the inviscid case the hyperbolic-tangent mixing layer is absolutely unstable when
 $R>R_{t}=1.315$
, i.e. when the mean velocity
 $(U_{a}+U_{b})/2$
, made dimensionless with respect to
 $|U_{a}-U_{b}|$
, was less than
 $1/(2R_{t})=0.38$
. In the case of the temporal mixing layer considered here,
 $(U_{a}+U_{b})/2=0$
, and the Kelvin–Helmholtz instability is therefore absolute. Because of the shift-and-reflect symmetry of the basic-flow profile, when
 $U_{b}=-U_{a}$
the wave packet leading and trailing edge velocities are exactly opposite (
 $v_{-}=-v_{+}$
) and coincide with the critical mean velocity necessary to induce a transition from absolute to convective instability (
 $-v_{-}=v_{+}=1/(2R_{t})$
). One can therefore compute
 $R_{t}$
with
 $R_{t}=1/(v_{+}-v_{-})$
(where it must be noted that
 $v_{-}$
and
 $v_{+}$
have been computed in the strictly temporal shift-and reflect symmetric case). In this way, we find that in the absence of streaks (
 $A_{0}=A_{s}=0$
)
 $-v_{-}=v_{+}=0.375$
, and therefore
 $R_{t}=1.33$
, which is in relatively good agreement with the inviscid prediction of Huerre & Monkewitz (Reference Huerre and Monkewitz1985).
When nonlinear streaks are forced, their influence on the onset of the absolute instability is found to be almost the opposite of the one on the maximum temporal growth rates. The influence of nonlinear sinuous streaks of increasing amplitude is to very slightly increase
 $-v_{-}$
and
 $v_{+}$
(see figure 8
a for the case
 $\unicode[STIX]{x1D6FD}=2$
), therefore slightly promoting the onset of the absolute instability, as the critical
 $R_{t}$
is slightly lowered (see figure 9
a). The opposite effect is found for the nonlinear varicose streaks, which induce a decrease of
 $|v_{-}|$
and
 $|v_{+}|$
(see figure 8
b for the case
 $\unicode[STIX]{x1D6FD}=2$
), and therefore delay the onset of the absolute instability, the critical
 $R_{t}$
being increased, as shown in figure 9(b).
These results are different from the ones found by Del Guercio et al. (Reference Del Guercio, Cossu and Pujals2014c ) in parallel wakes, where the influence of both sinuous and varicose nonlinear streaks was stabilizing on both the maximum temporal growth rate and on the absolute growth rate of the inflectional instability.
Influence of increasing amplitudes of the streaks on spatio-temporal growth rates
 $\unicode[STIX]{x1D70E}(v_{g})$
for optimal sinuous (a) and suboptimal varicose (b) perturbations for
 $\unicode[STIX]{x1D6FD}=2$
and
 $Re=1000$
. The wave packet’s leading and trailing edge velocities
 $v_{-}$
and
 $v_{+}$
are given by the left and right, respectively, velocities for which
 $\unicode[STIX]{x1D70E}=0$
. While the shifts of
 $v_{-}$
and
 $v_{+}$
with
 $A_{s}$
are almost negligible in the sinuous case (a), they clearly consist in a reduction of the absolute value of
 $v_{-}$
and
 $v_{+}$
in the varicose case (b).

Influence of increasing amplitudes of the streaks on the critical velocity ratio
 $R_{t}$
separating the convectively and absolutely unstable regimes for optimal sinuous (a) and suboptimal varicose (b) perturbations for selected values of the spanwise wavenumber
 $\unicode[STIX]{x1D6FD}$
at
 $Re=1000$
.

5 Role of the nonlinear flow distortion and second-order sensitivity to the streak amplitudes
5.1 Predictions based on shape assumptions
We have, so far, analysed the stability of streaky mixing layers given by the integration of the fully nonlinear Navier–Stokes equations. In the nonlinear cases considered, therefore, the shape of the flow distortion
 $\unicode[STIX]{x0394}U=U_{3D}-U_{2D}$
in general depends on the amplitude
 $A_{0}$
of the forced vortices (or, equivalently, on the amplitude
 $A_{s}$
of the induced streaks). However, in many previous studies aimed at understanding the stabilizing mechanism, such as, for example, those of Hwang et al. (Reference Hwang, Kim and Choi2013), Tammisola et al. (Reference Tammisola, Giannetti, Citro and Juniper2014) and Boujo et al. (Reference Boujo, Fani and Gallaire2015), a ‘shape assumption’ was made, as discussed in § 1.
Influence of increasing amplitudes of the streaks on the maximum temporal growth rates
 $\unicode[STIX]{x1D714}_{i,max}(A_{s})$
for optimal sinuous (a–c) and suboptimal varicose (d–f) perturbations for
 $\unicode[STIX]{x1D6FD}=1$
(a,d),
 $\unicode[STIX]{x1D6FD}=2$
(b,e),
 $\unicode[STIX]{x1D6FD}=3$
(c,f) at
 $Re=1000$
. The results pertain to the velocity profiles given by nonlinear simulations (black lines, filled circles), profiles under the shape assumption (magenta lines, crosses), the fictitious
 $\widetilde{U}$
(red lines, open circles) and
 $\overline{U}$
(blue lines, open squares) profiles. The predictions of (5.2) are also reported (green lines,
 $\times$
-symbols).

We have therefore repeated the impulse response analysis under the shape assumption using as basic-flow profiles
 $U_{2D}(y)+A_{s}\hat{u} ^{(opt)}(y)\cos (\unicode[STIX]{x1D6FD}z)$
, where
 $\hat{u} ^{(opt)}$
is the streamwise velocity component of the optimal streaks given by the linear theory, to ascertain if the influence on stability can be attributed to the first spanwise-harmonic of
 $\unicode[STIX]{x0394}U$
, the only ingredient under the shape assumption. The results are reported in figures 10 and 11 for the
 $\unicode[STIX]{x1D714}_{i,max}(A_{s})$
and
 $R_{t}(A_{s})$
curves, respectively, and selected values of
 $\unicode[STIX]{x1D6FD}$
. We find that in most of the considered cases the predictions based on shape assumptions (magenta lines with crosses) are the opposite (destabilizing instead of stabilizing, and vice versa) of the ones based on the nonlinear streak profiles (black lines with filled circles).
5.2 Roles of the spanwise-uniform and sinusoidal parts of the basic-flow distortion
The failure of the (single-harmonic) shape assumption discussed in § 5.1 in mimicking the effects of the full nonlinear flow distortion induced by the nonlinear streaks
 $\unicode[STIX]{x0394}U(y,z)=U_{3D}(y,z)-U_{2D}(y)$
could be attributed to the influence of the zeroth spanwise-harmonic or to harmonics higher than one or, less likely, to an important modification of the shape of the first harmonic at finite
 $A_{s}$
. To further investigate this issue, following Cossu & Brandt (Reference Cossu and Brandt2002), we decompose the nonlinear basic-flow distortion
 $\unicode[STIX]{x0394}U$
into its spanwise-averaged part
 $\overline{\unicode[STIX]{x0394}U}(y)$
(the zeroth spanwise-harmonic) and its spanwise-varying part
 $\widetilde{\unicode[STIX]{x0394}U}(y,z)=\unicode[STIX]{x0394}U(y,z)-\overline{\unicode[STIX]{x0394}U}(y)$
(which includes the first and higher spanwise-harmonics). We then repeat the impulse response analysis for two ‘artificial’ basic flows obtained by considering only the spanwise-varying or the spanwise-uniform part of the basic-flow distortion:
 $\widetilde{U}(y,z)=U_{2D}(y)+\widetilde{\unicode[STIX]{x0394}U}(y,z)$
and
 $\overline{U}(y)=U_{2D}(y)+\overline{\unicode[STIX]{x0394}U}(y)$
.
Influence of increasing amplitudes of the streaks on critical velocity ratios
 $R_{t}(A_{s})$
for the onset of the absolute instability for optimal sinuous (a–c) and suboptimal varicose (d–f) perturbations for
 $\unicode[STIX]{x1D6FD}=1$
(a,d),
 $\unicode[STIX]{x1D6FD}=2$
(b,e),
 $\unicode[STIX]{x1D6FD}=3$
(c,f) at
 $Re=1000$
. Same legends as in figure 10.
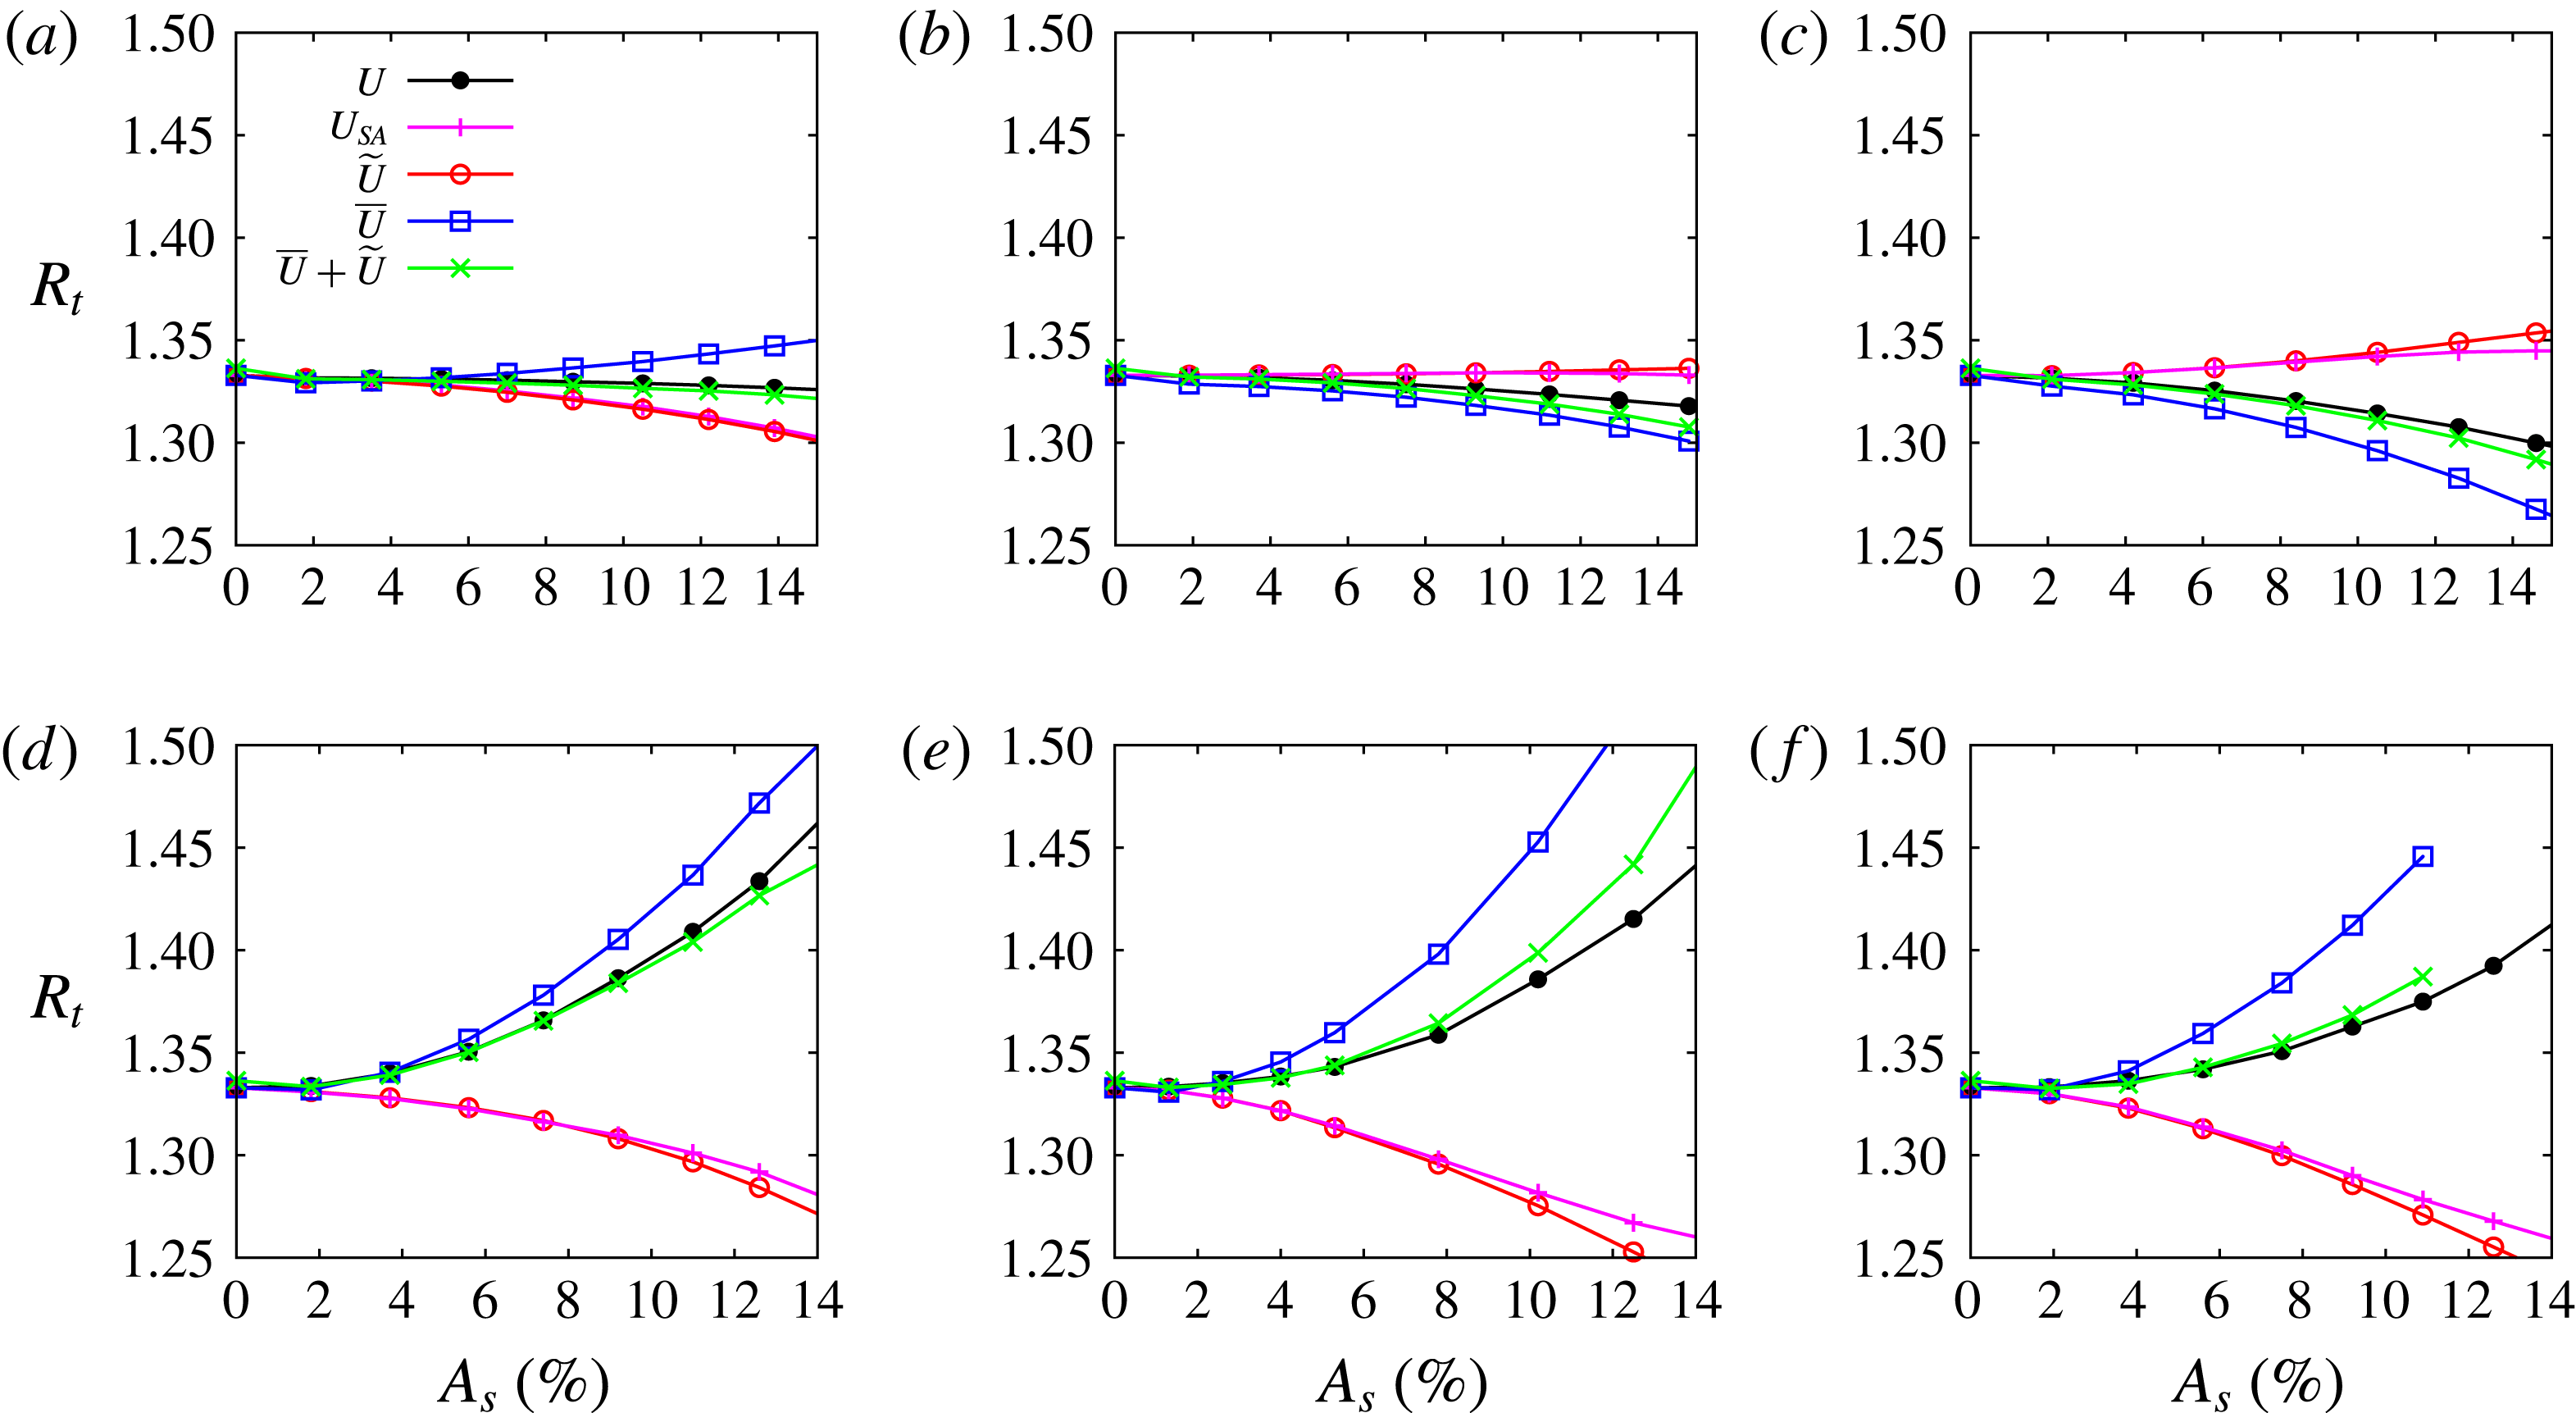
We find that, in all considered cases, the stability properties of the fictitious
 $\widetilde{U}$
profiles (red lines, open circles in figures 10 and 11) almost coincide with those obtained under the shape assumption (magenta lines with crosses). This means that the influences of higher spanwise-harmonics and of the change in shape of the first harmonic are negligible, and therefore not responsible for the qualitative differences between shape assumption and full nonlinear profiles results. On the contrary, the stability properties of the fictitious
 $\overline{U}$
profiles (blue lines, open squares in figures 10 and 11) are, in almost all considered cases, in qualitative (but often not in quantitative) agreement with the ones of the full nonlinear basic-flow profile (black lines with filled circles). This means that
 $\overline{\unicode[STIX]{x0394}U}(y)$
, despite its very small magnitude when compared to
 $\widetilde{\unicode[STIX]{x0394}U}$
(
 $\max _{y}\overline{\unicode[STIX]{x0394}U}$
is at best
 $2\,\%$
or
 $3\,\%$
, depending on the streak symmetries when
 $A_{s}\approx 15\,\%$
), has a stronger effect on the flow stability.
5.3 A composite second-order sensitivity
The results reported in the previous § 5.2, show that the (small amplitude) mean flow distortion
 $\overline{\unicode[STIX]{x0394}U}$
has the leading effect on the stability of the mixing layer while the (larger amplitude) spanwise-varying part of the nonlinear streaks
 $\widetilde{\unicode[STIX]{x0394}U}$
only mitigates or enhances this leading effect. These results must be reconciled with those of Hwang et al. (Reference Hwang, Kim and Choi2013) and Del Guercio et al. (Reference Del Guercio, Cossu and Pujals2014a
,Reference Del Guercio, Cossu and Pujals
b
,Reference Del Guercio, Cossu and Pujals
c
), where it was shown that the sensitivity of the growth rates on the streak amplitudes is quadratic, and with the second-order sensitivity analyses of Cossu (Reference Cossu2014), Tammisola et al. (Reference Tammisola, Giannetti, Citro and Juniper2014), Boujo et al. (Reference Boujo, Fani and Gallaire2015) and Tammisola (Reference Tammisola2017). The cornerstone of those analyses is that if the most unstable direct and adjoint modes of the 2D undisturbed basic flow are 2D (spanwise-uniform) and the basic-flow distortion
 $\widetilde{\unicode[STIX]{x0394}U}$
is spanwise sinusoidal then the first-order sensitivity of the leading growth rates to the 3D distortion amplitude (the streak amplitude
 $A_{s}$
) is zero and the leading-order dependence is quadratic. However, we have just found that the leading effect on the stability of mixing layers is given by the spanwise-uniform mean flow distortion term
 $\overline{\unicode[STIX]{x0394}U}$
, which, therefore, has non-zero first-order sensitivity, apparently in contrast to the findings and/or the assumptions of those previous investigations.
The apparent paradox can, however, be removed by an analysis of the scaling of
 $\overline{\unicode[STIX]{x0394}U}$
. The equation for the evolution of
 $\overline{\unicode[STIX]{x0394}U}$
is easily obtained, under the (already made) assumptions that the reference basic flow has components
 $\{U(y),0,0\}$
and the perturbations are uniform in the streamwise direction, by averaging in the spanwise direction the streamwise component of (2.3):
 $$\begin{eqnarray}\frac{\unicode[STIX]{x2202}\unicode[STIX]{x0394}\overline{U}}{\unicode[STIX]{x2202}t}=-\frac{\unicode[STIX]{x2202}\overline{u^{\prime }v^{\prime }}}{\unicode[STIX]{x2202}y}+\frac{1}{Re}\frac{\unicode[STIX]{x2202}^{2}\unicode[STIX]{x0394}\overline{U}}{\unicode[STIX]{x2202}y^{2}}.\end{eqnarray}$$
Equation (5.1) is a standard Reynolds-averaged equation except for the fact that the average is performed in the spanwise direction, and not in time or the streamwise direction as usual. This equation clearly shows that
 $\overline{\unicode[STIX]{x0394}U}$
is generated by the Reynolds stress, which in our case is associated with the transient growth leading from the streamwise vortices to the streamwise streaks. If the viscous stress is neglected, which seems reasonable at the considered high
 $Re=1000$
, the amplitude of the mean flow distortion can therefore be expected to be proportional to the product of the characteristic amplitude of the vortices
 $A_{0}$
and that of the streaks
 $A_{s}$
. In the considered case, however,
 $A_{s}$
is almost proportional to
 $A_{0}$
(see figure 4), and therefore one can expect the mean flow distortion to scale proportionally to
 $A_{s}^{2}$
(or equivalently to
 $A_{0}^{2}$
). This is verified to be indeed the case, as shown in figure 12, where the profiles
 $\unicode[STIX]{x0394}\overline{U}$
obtained for different amplitudes of the initial conditions for
 $\unicode[STIX]{x1D6FD}=2$
are virtually superposed and indistinguishable when rescaled by
 $A_{s}^{2}$
for both the optimal sinuous and the suboptimal varicose perturbations (similar results, not shown, are found for the other considered spanwise wavenumbers).
Mean flow distortion rescaled by the square of the streaks amplitude
 $\overline{\unicode[STIX]{x0394}U}(y)/A_{s}^{2}$
corresponding to the forcing of the optimal sinuous (a) and suboptimal varicose (b) streaks with
 $\unicode[STIX]{x1D6FD}=2$
at
 $Re=1000$
. The profiles obtained for the three amplitudes
 $A_{s}\approx 5\,\%$
,
 $A_{s}\approx 10\,\%$
and
 $A_{s}\approx 15\,\%$
are reported in order to appreciate the accuracy of the scaling.

We are now ready to determine, in two steps, the leading-order modification (sensitivity) of the generic eigenvalue
 $\unicode[STIX]{x1D707}$
of the linear stability operator with respect to a modification
 $\unicode[STIX]{x0394}U=\overline{\unicode[STIX]{x0394}U}+\widetilde{\unicode[STIX]{x0394}U}$
(an equivalent but more systematic derivation is presented in appendix A). In the first step the reference basic flow is distorted only by the mean flow distortion
 $\overline{\unicode[STIX]{x0394}U}$
. As
 $\overline{\unicode[STIX]{x0394}U}$
is spanwise-uniform, the leading-order variation of
 $\unicode[STIX]{x1D707}$
depends, in general, linearly on the amplitude of
 $\overline{\unicode[STIX]{x0394}U}$
, and can be computed either by a linear fitting of the computed eigenvalues or explicitly, as detailed by Hill (Reference Hill1992), Chomaz (Reference Chomaz2005) and Giannetti & Luchini (Reference Giannetti and Luchini2007). As discussed above, however, the mean flow distortion is well approximated by
 $\overline{\unicode[STIX]{x0394}U}=A_{s}^{2}\overline{F}(y)$
, i.e. the amplitude of the mean flow distortion depends quadratically on the streak amplitude
 $A_{s}$
. At this stage, therefore,
 $\unicode[STIX]{x1D707}-\unicode[STIX]{x1D707}_{2D}\approx A_{s}^{2}\overline{\unicode[STIX]{x0394}\unicode[STIX]{x1D707}}$
. In the second step the (intermediate fictitious) 2D basic flow
 $\overline{U}=U_{2D}(y)+\overline{\unicode[STIX]{x0394}U}$
is distorted with the spanwise-periodic
 $\widetilde{\unicode[STIX]{x0394}U}$
to give the actual total distorted flow
 $U_{3D}(y,z)$
. In a first approximation
 $\widetilde{\unicode[STIX]{x0394}U}=A_{s}\widetilde{F}(y,z)$
if a shape assumption for the spanwise-periodic part of the distortion is made (this is justified by the discussion in § 5.2). As the distortion of the basic flow is now spanwise-periodic, the first-order sensitivity of
 $\unicode[STIX]{x1D707}$
to this distortion is zero and the leading-order term is the second-order term
 $A_{s}^{2}\widetilde{\unicode[STIX]{x0394}\unicode[STIX]{x1D707}}$
. The second-order sensitivity
 $\widetilde{\unicode[STIX]{x0394}\unicode[STIX]{x1D707}}$
can be computed by quadratic fitting of the computed eigenvalues or by an explicit second-order sensitivity analysis, as detailed by, for example, Tammisola et al. (Reference Tammisola, Giannetti, Citro and Juniper2014) and Boujo et al. (Reference Boujo, Fani and Gallaire2015). The combined result of the two-step asymptotic analysis is therefore that the eigenvalue
 $\unicode[STIX]{x1D707}$
of the linear stability operator pertaining to the streaky basic flow
 $U_{3D}(y,z)\approx U_{2D}(y)+\overline{\unicode[STIX]{x0394}U}(y)+\widetilde{\unicode[STIX]{x0394}U}(y,z)$
can, at leading order, be approximated by
 $$\begin{eqnarray}\unicode[STIX]{x1D707}-\unicode[STIX]{x1D707}_{2D}=A_{s}^{2}\widetilde{\unicode[STIX]{x0394}\unicode[STIX]{x1D707}}+A_{s}^{2}\overline{\unicode[STIX]{x0394}\unicode[STIX]{x1D707}},\end{eqnarray}$$
where
 $\unicode[STIX]{x1D707}_{2D}$
pertains to the (unperturbed) 2D profile,
 $\widetilde{\unicode[STIX]{x1D707}}$
is the second-order sensitivity to
 $A_{s}\widetilde{F}(y,z)$
, and
 $\overline{\unicode[STIX]{x1D707}}$
is the first-order sensitivity to
 $A_{s}^{2}\overline{F}(y)$
.
A qualitative assessment of the validity of (5.2) has been obtained by comparing, in figures 10 and 11, the value of
 $\unicode[STIX]{x1D707}$
given by the analysis of the full nonlinear
 $U_{3D}$
profile (black lines with filled circles) to
 $\unicode[STIX]{x1D707}_{2D}+A_{s}^{2}\widetilde{\unicode[STIX]{x0394}\unicode[STIX]{x1D707}}+A_{s}^{2}\overline{\unicode[STIX]{x0394}\unicode[STIX]{x1D707}}$
(green lines,
 $\times$
-symbols), where
 $A_{s}^{2}\widetilde{\unicode[STIX]{x0394}\unicode[STIX]{x1D707}}$
and
 $A_{s}^{2}\overline{\unicode[STIX]{x0394}\unicode[STIX]{x1D707}}$
are obtained from the analyses of the fictitious profiles
 $\overline{U}$
and
 $\widetilde{U}$
. From the figures it can be seen that the agreement is fairly good for small streak amplitudes (
 $A_{s}\lesssim 6\,\%$
) and, for all but two cases, acceptable even at quite higher streak amplitudes.
These results confirm that the variation of the eigenvalues remains quadratic at leading order even when the effects of the nonlinear mean flow distortion are taken into account. Taking into due account the mean flow distortion in sensitivity analyses, therefore, is not inconsistent with the quadratic variations of the eigenvalues with the streak amplitudes reported by Del Guercio et al. (Reference Del Guercio, Cossu and Pujals2014a ,Reference Del Guercio, Cossu and Pujals b ,Reference Del Guercio, Cossu and Pujals c ), who used the fully nonlinear streaks as basic flow.
6 Conclusions
In this study we have computed the optimal (3D) spanwise-periodic and streamwise-uniform perturbations associated with the optimal and suboptimal energy amplifications sustained by the (2D) hyperbolic-tangent mixing layer. The computed optimal perturbations have then been forced with finite amplitudes to analyse their influence on the Kelvin–Helmholtz instability, which is the prototype of inflectional inviscid instabilities. The respective roles of the spanwise-periodic and spanwise-uniform components of the basic-flow distortion have been finally analysed to address the long-standing issue of the appropriateness of using shape assumptions in this kind of analysis. We briefly summarize and discuss these three sets of results separately.
6.1 Optimal perturbations and energy growths
Concerning optimal energy growths, we find that the parallel hyperbolic-tangent mixing layer can sustain very large transient growths of 3D streamwise-uniform perturbations that are linearly stable and that:
-
(i) For all the considered spanwise wavenumbers, ranging from
$\unicode[STIX]{x1D6FD}=0.6$
to
$\unicode[STIX]{x1D6FD}=3.2$
, and Reynolds numbers, ranging from
$Re=100$
to
$Re=1000$
, optimal perturbations are symmetric, in the
$y-z$
cross-stream plane, with respect to the mixing layer (anti)symmetry plane and induce a sinuous (in the
$y$
–
$z$
plane) deformation of the mixing layer. Leading suboptimal perturbations have opposite symmetries and induce varicose deformations of the mixing layer. -
(ii) The optimal and suboptimal initial perturbations consist of streamwise vortices (most of the energy is in the cross-stream velocity perturbations), while the most amplified (optimal and suboptimal) perturbations consist of streamwise streaks (most of the energy is in the streamwise velocity perturbation). The spanwise and cross-stream extension of these structures both increase with increasing spanwise wavelengths.
-
(iii) The optimal and suboptimal energy growths are proportional to the square of the Reynolds number and present a single maximum in time. The time at which maximum energy growths are obtained is proportional to the Reynolds number.
-
(iv) The maximum amplifications of sinuous (optimal) and varicose (suboptimal) perturbations are an increasing function of their spanwise wavelength with
$G_{max}$
in the considered
$\unicode[STIX]{x1D6FD}$
range, and the gap between the two increases significantly with
$\unicode[STIX]{x1D706}_{z}$
.


These results are, in many respects, similar to the ones found in most parallel shear flows (see, for example, Schmid & Henningson (Reference Schmid and Henningson2001) for a review) and, in particular, to those found in parallel wakes by Del Guercio et al. (Reference Del Guercio, Cossu and Pujals2014c ). The symmetries of the optimal and suboptimal perturbations also agree with those found by Boujo et al. (Reference Boujo, Fani and Gallaire2015).
The large amplification of sinuous perturbations can probably also be related to the experimental findings of Bell & Mehta (Reference Bell and Mehta1993), who observe a strong far-field sensitivity of turbulent spatial mixing layers to the forcing of sinuous counter-rotating vortices on the splitter plate. In an averaged sense, indeed, the (upstream forced) vortices of the spatial case are reminiscent of the optimal (initial) vortices and the (far-field) streaky flow distortion is reminiscent of the optimal response (at later times) to the optimal forcing. In both cases, also, the vortices decay while the streaks are transiently amplified, and the fact that the streaky distortions are observed in the far field is reminiscent of the relatively large times (at high
 $Re$
) required for the streaks to amplify.
6.2 Influence of nonlinear streaks on the Kelvin–Helmholtz instability
When forced with finite amplitude, optimal and suboptimal perturbations lead to nonlinearly distorted 3D mixing layers. These nonlinear streaky basic-flow distortions have an influence on the Kelvin–Helmholtz instability which depends on the symmetry of the forced 3D perturbations: sinuous optimal perturbations have a stabilizing effect on the maximum temporal growth rates but slightly reduce the critical velocity ratio
 $R_{t}$
required for the onset of absolute instability; almost opposite trends are found for varicose suboptimal perturbations, which are slightly destabilizing for the maximum temporal growth rates but which delay the onset of absolute instability to higher critical velocity ratios
 $R_{t}$
.
The stabilizing influence of sinuous optimal perturbation on the maximum growth rate of the inflectional instability is consistent, in an averaged sense, with the reductions of the growths observed by Bell & Mehta (Reference Bell and Mehta1993) in far-field sinuously streaky mixing layers; it is also consistent with the stabilization of inflectional instabilities found by Gudmundsson & Colonius (Reference Gudmundsson and Colonius2006, Reference Gudmundsson and Colonius2007) in ‘chevron jets’ (sinuously streaky jets).
An intriguing result is that almost opposite effects on stability are found for the two different symmetries (sinuous or varicose) and for temporal and absolute growth rates, contrary to the case of wakes, where Del Guercio et al. (Reference Del Guercio, Cossu and Pujals2014c ) found that both symmetries had a stabilizing role both on maximum growth rates and the absolute instability. This might be related to the opposite symmetries of the mixing layer and wake reference 2D velocity profiles, but further analysis of this issue is probably required.
6.3 Shape assumptions, the role of the mean flow distortion and consistent second-order sensitivity analyses
We have further investigated the nature of the (de)stabilizing influence of the 3D nonlinear basic-flow distortion
 $\unicode[STIX]{x0394}U$
on the Kelvin–Helmholtz instability by comparing it with the effects that would have been obtained using a shape assumption on
 $\unicode[STIX]{x0394}U$
and by separating the effects of the spanwise-oscillating part
 $\widetilde{\unicode[STIX]{x0394}U}$
from those of the spanwise-uniform part
 $\overline{\unicode[STIX]{x0394}U}$
(the mean flow distortion) of
 $\unicode[STIX]{x0394}U$
. The main findings can be summarized as follows:
-
(i) If a shape assumption is made, by distorting the 2D reference basic-flow profile only with the single spanwise-harmonic linear optimal streak profile, then results opposite to the ones found with the nonlinear profiles are obtained, in almost all analysed cases, for the maximum growth rates and convective–absolute instability thresholds. The results obtained under the shape assumption are, however, consistent with those obtained under the same assumption by Boujo et al. (Reference Boujo, Fani and Gallaire2015) (sinuous optimal perturbations reduce the maximum temporal growth rate only for
$\unicode[STIX]{x1D6FD}\lesssim 1.5$
and that the varicose suboptimal perturbations reduce it for all the considered
$\unicode[STIX]{x1D6FD}\gtrsim 0.4$
). -
(ii) If the 2D reference basic-flow profile is distorted with the whole spanwise-oscillating part
$\widetilde{\unicode[STIX]{x0394}U}$
of the nonlinear basic-flow distortion (first an higher spanwise-harmonics, but not the zero harmonic), then the obtained results are almost identical to those obtained with the shape assumption. -
(iii) The leading influence on the variation of the maximum growth rate
$\unicode[STIX]{x1D714}_{i,max}$
and of the absolute–convective instability critical value
$R_{t}$
is given by the spanwise-uniform part
$\overline{\unicode[STIX]{x0394}U}$
(the mean flow distortion) of the nonlinear basic-flow distortion. This effect is the opposite to that of
$\widetilde{\unicode[STIX]{x0394}U}$
in almost all considered cases. -
(iv) The mean flow distortion is found to be proportional to the square of the streak amplitude
$\overline{\unicode[STIX]{x0394}U}=A_{s}^{2}\overline{F}(y;\unicode[STIX]{x1D6FD})$
. -
(v) If the effects of the mean flow distortion are included in the prediction of the variation of eigenvalues induced by the 3D spanwise-periodic streaks, the dependence of the variation on the streak amplitude remains quadratic at leading order:
$\unicode[STIX]{x1D707}-\unicode[STIX]{x1D707}_{2D}\sim A_{s}^{2}(\widetilde{\unicode[STIX]{x0394}\unicode[STIX]{x1D707}}+\overline{\unicode[STIX]{x0394}\unicode[STIX]{x1D707}}).$
-
(vi) It is verified that the variations of
$\unicode[STIX]{x1D714}_{i,max}$
and
$R_{t}$
obtained by combining those induced by
$\widetilde{\unicode[STIX]{x0394}U}$
with those induced by
$\overline{\unicode[STIX]{x0394}U}$
are in quantitative agreement with those induced by the whole nonlinear basic-flow distortion for
$A_{s}\lesssim 6\,\%$
. An acceptable agreement is often found for even higher
$A_{s}$
values.






These results emphasize the necessity of including the mean flow distortion in the theoretical analyses of the (de)stabilization of mixing layers by 3D streaky flow distortions. In this respect they are similar to those found by Cossu & Brandt (Reference Cossu and Brandt2002) in boundary layers. The new key point of the present study is that the observed relevance of the mean flow distortion is explained by the fact that, while the sensitivity of eigenvalues to the
 $O(A_{s})$
spanwise-oscillating part
 $\widetilde{\unicode[STIX]{x0394}U}$
of the flow distortion is quadratic, their sensitivity to the mean flow distortion
 $\overline{\unicode[STIX]{x0394}U}$
is linear, but the amplitude of
 $\overline{\unicode[STIX]{x0394}U}$
is
 $O(A_{s}^{2})$
and, therefore, at leading order the variation of the eigenvalues induced by
 $\overline{\unicode[STIX]{x0394}U}$
is of the same quadratic order as the one induced by
 $\widetilde{\unicode[STIX]{x0394}U}$
. This could have been directly recognized, as detailed in appendix A, by using a consistent fully second-order sensitivity analysis based on the expansion
 $\unicode[STIX]{x0394}U=A_{s}\widetilde{F}(y,z)+A_{s}^{2}\overline{F}(y,z)$
(which is a sort of ‘order-by-order’ shape assumption).
Another important point is that, as the mean flow distortion
 $\overline{\unicode[STIX]{x0394}U}$
is mainly determined by the Reynolds stresses generated during the streak generation process (see (5.1)), it is not simply determined by the final shape of the first spanwise-harmonic (the ‘streaks’). Therefore, it would be in principle possible to obtain different mean flow distortions
 $\overline{\unicode[STIX]{x0394}U}$
for the same final shape of the first-order harmonic (the ‘streak’) by altering its generation processes. If, for instance, one is able to enforce an initial condition (or upstream forcing) directly consisting of the optimal (single, first-harmonic) streaks (i.e. with zero cross-stream velocity perturbations), then the
 $-\overline{u^{\prime }v^{\prime }}$
Reynolds stress would remain zero and there would be no mean flow distortion. In this hypothetical case (where, however, one would spend
 $O(Re^{2})$
more energy directly forcing the streaks instead of forcing the optimal vortices) the results obtained using the shape assumption would probably apply. An important conclusion is that in theoretical analyses of instability control by 3D streaky flow distortions one has to specify not only the shape of the first harmonic of the flow distortions (the linear streaks’) but also how they are generated in order to compute the mean flow distortion induced in the process. An interesting line of research, which is currently actively pursued, therefore consists in finding which types of forcing would obtain the maximum combined stabilizing influence of the streaks and the mean flow distortion induced in the process of their generation.
Acknowledgements
We gratefully acknowledge the financial support of Groupe PSA and an anonymous referee for suggesting to use the formulation discussed in appendix A.
Appendix A. A consistent second-order sensitivity analysis
In this appendix we develop, in a more standard way, the composite second-order sensitivity which was derived heuristically in § 5.3. The key point is that, in the case of spanwise-periodic perturbations of the basic flow associated with zero first-order sensitivity, second-order perturbations of the basic flow should be included from the start in the perturbation analysis for the sake of consistency (see, for example, Tammisola (Reference Tammisola2017)).
Using the notation of Cossu (Reference Cossu2014) we therefore consider the generic eigenvalue problem:
 $\unicode[STIX]{x1D707}\unicode[STIX]{x1D713}={\mathcal{L}}\unicode[STIX]{x1D713}$
, where the linear operator
 ${\mathcal{L}}$
is given by a reference linear operator
 ${\mathcal{L}}_{0}$
perturbed to
 ${\mathcal{L}}={\mathcal{L}}_{0}+\unicode[STIX]{x1D700}{\mathcal{L}}_{1}+\unicode[STIX]{x1D700}^{2}{\mathcal{L}}_{2}$
. In this expansion,
 $\unicode[STIX]{x1D700}$
is understood as proportional to the streak amplitude
 $A_{s}$
, the perturbation
 $\unicode[STIX]{x1D700}{\mathcal{L}}_{1}$
is associated with perturbation of the basic flow due to the first spanwise-harmonic and
 $\unicode[STIX]{x1D700}^{2}{\mathcal{L}}_{2}$
is associated with the perturbation of the basic flow due to the zeroth spanwise-harmonic (the mean flow distortion) as discussed in § 5.3. In the limit
 $\unicode[STIX]{x1D700}\ll 1$
, the eigenvalue
 $\unicode[STIX]{x1D707}$
and the corresponding eigenfunction
 $\unicode[STIX]{x1D713}$
can be developed as:
 $\unicode[STIX]{x1D707}=\unicode[STIX]{x1D707}_{0}+\unicode[STIX]{x1D700}\unicode[STIX]{x1D707}_{1}+\unicode[STIX]{x1D700}^{2}\unicode[STIX]{x1D707}_{2}$
and
 $\unicode[STIX]{x1D713}=\unicode[STIX]{x1D713}_{0}+\unicode[STIX]{x1D700}\unicode[STIX]{x1D713}_{1}+\unicode[STIX]{x1D700}^{2}\unicode[STIX]{x1D713}_{2}$
. These expansions lead, when replaced in the eigenvalue problem, to the zeroth, first- and second-order problems:
 $$\begin{eqnarray}\displaystyle & \displaystyle \unicode[STIX]{x1D707}_{0}\unicode[STIX]{x1D713}_{0}={\mathcal{L}}_{0}\unicode[STIX]{x1D713}_{0}, & \displaystyle\end{eqnarray}$$
 $$\begin{eqnarray}\displaystyle & \displaystyle \unicode[STIX]{x1D707}_{0}\unicode[STIX]{x1D713}_{1}+\unicode[STIX]{x1D707}_{1}\unicode[STIX]{x1D713}_{0}={\mathcal{L}}_{0}\unicode[STIX]{x1D713}_{1}+{\mathcal{L}}_{1}\unicode[STIX]{x1D713}_{0}, & \displaystyle\end{eqnarray}$$
 $$\begin{eqnarray}\displaystyle & \displaystyle \unicode[STIX]{x1D707}_{0}\unicode[STIX]{x1D713}_{2}+\unicode[STIX]{x1D707}_{1}\unicode[STIX]{x1D713}_{1}+\unicode[STIX]{x1D707}_{2}\unicode[STIX]{x1D713}_{0}={\mathcal{L}}_{0}\unicode[STIX]{x1D713}_{2}+{\mathcal{L}}_{1}\unicode[STIX]{x1D713}_{1}+{\mathcal{L}}_{2}\unicode[STIX]{x1D713}_{0}. & \displaystyle\end{eqnarray}$$
The zeroth-order problem is simply the unperturbed problem, for which the solution is known. If
 ${\mathcal{L}}_{0}^{\dagger }$
is the adjoint of
 ${\mathcal{L}}_{0}$
with respect to the inner product
 $\langle \,,\,\rangle$
, to each eigenvalue
 $\unicode[STIX]{x1D707}_{0}$
of
 ${\mathcal{L}}_{0}$
corresponds an eigenvalue of
 ${\mathcal{L}}_{0}^{\dagger }$
which simply is the complex conjugate of
 $\unicode[STIX]{x1D707}_{0}$
and whose corresponding eigenfunction is denoted by
 $\unicode[STIX]{x1D713}_{0}^{\dagger }$
. The first-order sensitivity is easily found to be
 $\unicode[STIX]{x1D707}_{1}=\langle \unicode[STIX]{x1D713}_{0}^{\dagger },{\mathcal{L}}_{1}\unicode[STIX]{x1D713}_{0}\rangle /\langle \unicode[STIX]{x1D713}_{0}^{\dagger },\unicode[STIX]{x1D713}_{0}\rangle$
by projecting equation (A 2) on
 $\unicode[STIX]{x1D713}_{0}^{\dagger }$
and making use of the identity
 $\langle \unicode[STIX]{x1D713}_{0}^{\dagger },\unicode[STIX]{x1D707}_{0}\unicode[STIX]{x1D713}_{1}\rangle =\langle \unicode[STIX]{x1D713}_{0}^{\dagger },{\mathcal{L}}_{0}\unicode[STIX]{x1D713}_{1}\rangle$
(see, for example, Bottaro, Corbett & Luchini (Reference Bottaro, Corbett and Luchini2003), Chomaz (Reference Chomaz2005)). However, when spanwise uniform basic flows are perturbed with spanwise-periodic perturbations,
 $\unicode[STIX]{x1D707}_{1}=0$
because
 $\langle \unicode[STIX]{x1D713}_{0}^{\dagger },{\mathcal{L}}_{1}\unicode[STIX]{x1D713}_{0}\rangle =0$
, as remarked by Hwang & Choi (Reference Hwang and Choi2006), Hwang et al. (Reference Hwang, Kim and Choi2013), Del Guercio et al. (Reference Del Guercio, Cossu and Pujals2014a
,Reference Del Guercio, Cossu and Pujals
c
). In this case, an expression for
 $\unicode[STIX]{x1D707}_{2}$
can be retrieved by projecting the second-order equation (A 3) on
 $\unicode[STIX]{x1D713}_{0}^{\dagger }$
and making use of the identity
 $\langle \unicode[STIX]{x1D713}_{0}^{\dagger },{\mathcal{L}}_{0}\unicode[STIX]{x1D713}_{2}\rangle =\langle \unicode[STIX]{x1D713}_{0}^{\dagger },\unicode[STIX]{x1D707}_{0}\unicode[STIX]{x1D713}_{2}\rangle$
:
 $$\begin{eqnarray}\unicode[STIX]{x1D707}_{2}=\frac{\langle \unicode[STIX]{x1D713}_{0}^{\dagger },{\mathcal{L}}_{1}\unicode[STIX]{x1D713}_{1}\rangle }{\langle \unicode[STIX]{x1D713}_{0}^{\dagger },\unicode[STIX]{x1D713}_{0}\rangle }+\frac{\langle \unicode[STIX]{x1D713}_{0}^{\dagger },{\mathcal{L}}_{2}\unicode[STIX]{x1D713}_{0}\rangle }{\langle \unicode[STIX]{x1D713}_{0}^{\dagger },\unicode[STIX]{x1D713}_{0}\rangle },\end{eqnarray}$$
which, recalling that
 $\unicode[STIX]{x1D707}=\unicode[STIX]{x1D707}_{0}+\unicode[STIX]{x1D700}^{2}\unicode[STIX]{x1D707}_{2}$
, is equivalent to (5.2) with
 $\unicode[STIX]{x1D700}=A_{s}$
,
 $\unicode[STIX]{x1D707}_{0}=\unicode[STIX]{x1D707}_{2D}$
,
 $\overline{\unicode[STIX]{x1D707}}=\langle \unicode[STIX]{x1D713}_{0}^{\dagger },{\mathcal{L}}_{2}\unicode[STIX]{x1D713}_{0}\rangle /\langle \unicode[STIX]{x1D713}_{0}^{\dagger },\unicode[STIX]{x1D713}_{0}\rangle$
,
 $\widetilde{\unicode[STIX]{x1D707}}=\langle \unicode[STIX]{x1D713}_{0}^{\dagger },{\mathcal{L}}_{1}\unicode[STIX]{x1D713}_{1}\rangle /\langle \unicode[STIX]{x1D713}_{0}^{\dagger },\unicode[STIX]{x1D713}_{0}\rangle$
. The first-order eigenfunction correction
 $\unicode[STIX]{x1D713}_{1}$
can be retrieved from (A 2), which, when
 $\unicode[STIX]{x1D707}_{1}=0$
, reduces to the singular linear system
 $({\mathcal{L}}_{0}-\unicode[STIX]{x1D707}_{0})\unicode[STIX]{x1D713}_{1}=-{\mathcal{L}}_{1}\unicode[STIX]{x1D713}_{0}$
, which can be solved as discussed by Cossu (Reference Cossu2014), Tammisola et al. (Reference Tammisola, Giannetti, Citro and Juniper2014), Boujo et al. (Reference Boujo, Fani and Gallaire2015) and Tammisola (Reference Tammisola2017).



