I. INTRODUCTION
Conventional alloys generally have a single element as the principal constituent with other minor elements added to improve the properties and performance. By contrast, high-entropy alloys (HEAs), as first introduced by Cantor et al. Reference Cantor, Chang, Knight and Vincent1 and Yeh et al., Reference Yeh, Chen, Lin, Gan, Chin, Shun, Tsau and Chang2 are multicomponent alloys containing five or more elements in equal atomic proportions. Although HEAs contain a large number of principal elements, they are often simple solid solutions with crystal structures of body-centered cubic (bcc) or face-centered cubic (fcc), rather than intermetallic compounds or complex phases due to the very high configurational entropy. Reference Cantor, Chang, Knight and Vincent1–Reference Murty, Yeh and Ranganathan4 The interesting nature of HEAs, including their simple structure, severe lattice distortion, and sluggish diffusion, Reference Zhang, Zuo, Tang, Gao, Dahmen, Liaw and Lu3,Reference Murty, Yeh and Ranganathan4 leads to many promising mechanical properties, such as high strength, excellent resistance to high-temperature softening and creep, high fatigue strength, and good tribological properties. Reference He, Liu, Wang, Wu, Liu, Nieh and Lu5–Reference Senkov, Scott and Senkova7 Since the properties of HEAs are not determined by a single principal element as in conventional alloys, major emphasis has been placed over the last decade in finding new compositions of HEAs demonstrating the most desirable mechanical properties. Reference Murty, Yeh and Ranganathan4
Among many HEAs available to date, one of the most studied materials is an equiatomic CoCrFeNiMn alloy. Because this HEA has a single phase fcc structure involving many active slip systems at ambient temperature, it generally exhibits excellent ductility in addition to superior mechanical properties Reference Zhu, Lu and Nieh8–Reference Stepanov, Tikhonovsky, Yurchenko, Zyabkin, Klimova, Zherebtsov, Efimov and Salishchev14 and accordingly many studies have been conducted to analyze the microstructure and mechanical properties of the CoCrFeNiMn HEA system. For example, Zhu et al. Reference Zhu, Lu and Nieh8 reported that the activation energy and volume for the onset of plasticity in this alloy were relatively higher than in conventional fcc metals. The estimated activation volumes correspond to a vacancy-mediated heterogeneous dislocation nucleation involving cooperative motions of several atoms so that these values are higher than in conventional fcc metals having direct traditional exchanges between atoms and vacancies. Otto et al. Reference Otto, Dlouhý, Somsen, Bei, Eggeler and George9 systematically investigated the deformation behavior of this HEA in the temperature range of 77–1073 K and reported an increased work hardening and enhanced ductility even at cryogenic temperatures. Moreover, this study demonstrated that there were strong temperature dependences of yield strength and flow stress in this alloy which are not typical of conventional fcc metals.
It is now well accepted that nanocrystalline (nc) metals and alloys with average grain sizes, d, typically smaller than 100 nm exhibit much improved mechanical properties by comparison with their coarse-grained (cg) counterparts. Reference Gleiter15–Reference Zhu and Li19 This enhancement is due to the large fraction of grain boundaries (GBs) which play important roles in the plastic deformation and fracture of nc alloys. Reference Meyer, Mishra and Benson17,Reference Dao, Lu, Asaro, De Hosson and Ma18,Reference Choi, Kim, Seok, Yoo, Kim, Wang and Jang20
To incorporate both the advantages of HEA and an nc structure to maximize the mechanical performance, some efforts have been made to synthesize nc HEAs by various routes. To date, the two most popular procedures are magnetron sputtering (MS) Reference Ma, Peng, Wen and Zhang21 and mechanical alloying (MA). Reference Ji, Wang, Wang, Zhang, Wang, Zhang and Fu13,Reference Zhang, Fu, Zhang, Shi, Wang, Wang, Wang and Zhang22–Reference Praveen, Murty and Kottada Ravi24 However, because the volume of the sample synthesized is limited in MS, Reference Ma, Peng, Wen and Zhang21 MA is generally more attractive for producing bulk nc HEAs. Reference Ji, Wang, Wang, Zhang, Wang, Zhang and Fu13,Reference Zhang, Fu, Zhang, Shi, Wang, Wang, Wang and Zhang22–Reference Praveen, Murty and Kottada Ravi24 In addition, MA is known to introduce improved solid solubility and structural homogeneity. Nevertheless, the production of nc HEAs by powder metallurgy processes including MA requires additional steps of consolidation such as hot compression or spark plasma sintering (SPS) and this may introduce undesirable grain growth. Reference Ji, Wang, Wang, Zhang, Wang, Zhang and Fu13,Reference Praveen, Murty and Kottada Ravi24 In addition, MA processing invariably leads to some residual porosity.
By contrast, the use of severe plastic deformation (SPD) processing, such as equal-channel angular pressing (ECAP) Reference Valiev and Langdon25 and high-pressure torsion (HPT), Reference Zhilyaev and Langdon26 provides an opportunity for directly achieving excellent grain refinement in fully-dense solids without requiring any additional steps. Reference Langdon27 Despite this clear advantage, there have been only very limited efforts, including a very recent report on an Al0.3CoCrFeNi HEA, Reference Tang, Huang, Huang, Liao, Langdon and Dai28 to investigate the SPD processing of HEAs.
By comparison with ECAP, HPT processing has the advantage of introducing higher plastic strains and producing materials with both smaller grains Reference Zhilyaev, Kim, Nurislamova, Baró, Szpunar and Langdon29,Reference Zhilyaev, Nurislamova, Kim, Baró, Szpunar and Langdon30 and higher fractions of high-angle GBs. Reference Wongsa-Ngam, Kawasaki and Langdon31 During HPT, the equivalent strain εeq imposed on the disk is given by the relationship Reference Valiev, Ivanisenko, Rauch and Baudelet32 :
 $${\varepsilon _{{\rm{eq}}}} = {{2\pi Nr} \over {\sqrt 3 t}}\quad ,$$
where r and t are the radius and thickness of the disk, respectively, and N is the number of torsional revolutions. It is readily apparent from Eq. (1) that in HPT the strain varies locally across the disk. Therefore, the microstructure and mechanical properties are expected to be inhomogeneous depending on the distance from the center of the disk where r = 0, thereby implying that the influence on the mechanical properties of different levels of straining may be observed across a disk diameter within a single HPT disk.
Accordingly, the present research was initiated to produce an nc CoCrFeNiMn HEA through HPT processing. It is demonstrated that the nc structure is readily achieved in the very early stage of HPT processing and the results are discussed in terms of the applied torsional stress during HPT. Thereafter, the nanomechanical behavior and the structural stability of the nc HEA were systematically explored through a series of experiments using nanoindentation and transmission electron microscopy (TEM).
II. EXPERIMENTAL PROCEDURES
The HEA system investigated in the present study was prepared by arc-melting a mixture of pure metals (purity > 99 wt%) having a nominal composition of Co20Cr20Fe20Mn20Ni20 (in at.%) in a Ti-gettered high-purity Ar atmosphere. The ingots were re-melted at least four times to promote chemical homogeneity. Finally, the melted alloys were drop-cast into a mold to give a square bar with dimensions of 10 mm × 10 mm × 60 mm.
The as-cast alloy was cut and machined into disks having a radius, r, of 5 mm and a thickness, t, of 0.83 mm using electrical discharge machining. The HPT processing was conducted at room temperature (RT) under quasi-constrained conditions. Reference Figueiredo, Cetlin and Langdon33,Reference Figueiredo, Pereira, Aguilar, Cetlin and Langdon34 The disks were processed for totals of 1/4, 1/2, 1, and 2 turns under a pressure of 6.0 GPa and using a rotational speed of 1 rpm. The distribution of the Vickers hardness across the diameter of each disk was recorded using HMV-2 equipment (Shimadzu, Tokyo, Japan) at a peak load P max of 980 mN. The evolution in crystal structure through HPT processing was examined by x-ray diffraction (XRD) analysis using D/Max-2500 (Rigaku-Denki, Tokyo, Japan).
The microstructures of the specimens were examined using an optical microscope (CK40M, Olympus, Tokyo, Japan), an electron backscattered diffraction (EBSD) instrument (FEI XL30 FEG, Philips, Cambridge, UK), and TEM (Tecnai F20, FEI Co., Hillsboro, OR). For the optical microscopy observations, the samples were mechanically polished to a mirror-like finish and etched with aqua regia solution which is a mixture of nitric acid and hydrochloric acid in a volume ratio of 1:3. The samples for the EBSD measurements were prepared by careful mechanical polishing with 0.05 μm colloidal silica and subsequent electrolytic polishing at 58 V for 20 s in a mixture of 90% acetic and 10% perchloric acid at RT. Focused ion beam (FIB; Nova 200 NanoLab, FEI Co, Hillsboro, OR) milling was performed to obtain TEM samples at the vertical cross-sections of the HPT-processed disks. A thin layer was milled by FIB in the through-thickness direction at the edges of the processed HEA disks and lifted to provide TEM micrographs for detailed microstructural analysis.
Nanoindentation tests were performed at the edge of each electrolytically polished disk using Nanoindenter-XP (formerly MTS; now Agilent, Oak Ridge, TN) with a three-sided pyramidal Berkovich indenter. The specimens were loaded to P
max of 100 mN at constant indentation strain rates
 ${\dot \varepsilon _{\rm{i}}}$
[=h
−1(dh/dt) which is equal to 0.5P
−1(dP/dt)
Reference Lucas and Oliver35
] of 0.01, 0.025, 0.05, and 0.1 s−1. More than 30 measurements were conducted for each condition to provide statistically validated hardness data. Thermal drift was maintained below 0.1 nm s−1 in all experiments.
To estimate the torsional stresses produced during HPT, a finite-element analysis (FEA) simulation was performed using ABAQUS (HKS Inc., Pawtucket, RI) software. The geometries of the anvils were based on the quasi-constrained HPT conditions Reference Figueiredo, Cetlin and Langdon33 and meshes were generated with 46,620 elements in the disk having initial t and r of 0.8 and 5.0 mm, respectively. A force of ∼471,239 N, corresponding to a pressure of 6.0 GPa on the HPT disk, was applied to the sample and the bottom anvil was programmed to rotate for concurrent torsional straining. A high friction coefficient of 0.7 was applied between the anvil and the disk to maintain a reasonable sticking condition. Reference Figueiredo, Cetlin and Langdon33 The material parameters used for the present simulation were based on a flow curve reported for the HEA. Reference Wu, Liu, Wang, Ma, Stoica, Nieh, He and Lu11
III. RESULTS
A. Hardness distributions after HPT
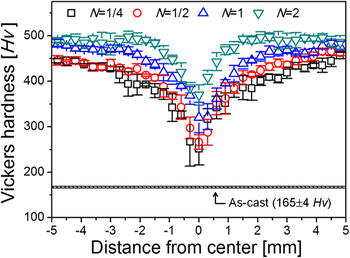
The values of the Vickers hardness, Hv, were measured along diameters of the HEA disks processed by HPT for N = 1/4, 1/2, 1, and 2 turns and the distributions of hardness are shown in Fig. 1, where Hv of 165 ± 4 for the as-cast HEA is designated with a horizontal line. For each measurement position, the average value of Hv was determined from four separate measurements recorded at uniformly separated points displaced from the selected position by a distance of 0.15 mm Reference Kawasaki and Langdon36 and the standard deviations of Hv are described by error bars for each measurement position in each processed disk.
Variations in Vickers hardness with distance from the center of the HPT-processed HEA disks.

These results demonstrate four important characteristics in the hardness variation of the HEA after HPT. First, the Hv values of all processed disks across the disk diameters are higher than in the as-cast specimen. Second, the Hv values of the processed disks increase significantly with increasing distance from the centers toward the peripheries. In practice, even at the earliest stage of HPT, after 1/4 turn, the Hv values at the edges of the disks increase to ∼457 ± 7 Hv which is almost three times higher than in the as-cast specimen, whereas the Hv values at the centers are ∼251 ± 36 Hv. Third, with further increasing of N, the Hv values throughout the disks increase moderately and a maximum value of ∼486 ± 15 was achieved at the disk edges after 2 turns with Hv ∼ 370 ± 22 Hv at the disk center. Fourth, the difference in Hv between the centers and the peripheries is reduced with increasing N, thus demonstrating the trend of hardness evolution toward homogeneity throughout the HEA disk surfaces with increasing N.
These results suggest that this alloy experiences a significant hardening in the early stage of HPT processing and the strengthening continues gradually as N increases under the processing conditions. This strain hardening behavior toward hardness homogeneity with increasing HPT turns is in agreement with experimental results reported from conventional metals and alloys after HPT. Reference Kawasaki37
B. Microstructural evolution
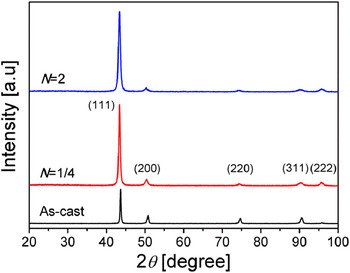
Figure 2 shows the XRD patterns of, from the bottom, HEA in an as-cast condition and the HPT-processed HEA disks for 1/4 and 2 turns. Both the as-cast sample and the HPT-processed disks have an fcc single phase with a lattice parameter, a, of 3.60 Å which is in a good agreement with the reported value of ∼3.61 Å Reference Liu, Wu, He, Nieh and Lu10 thereby indicating an absence of any phase transformation during the HPT processing.
Typical XRD patterns for the HEA, from the bottom, in the as-cast condition and after HPT for N = 1/4 and 2 turns.

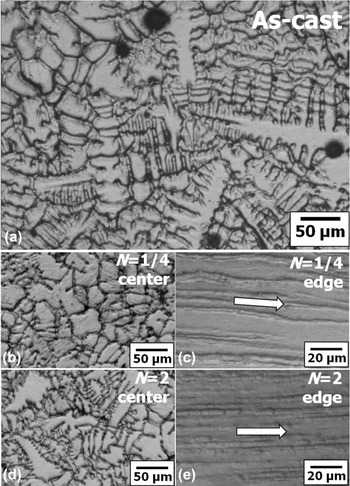
The inhomogeneous distribution of Hv within each HPT disk in Fig. 1 implies that there is a significant microstructural gradient depending on the distance from the center of the disk. It follows from Eq. (1) that microstructural evolution should be most significant in the peripheral regions of the HEA disks after HPT. Figure 3 shows optical micrographs of (a) the as-cast sample and the HPT-processed disks for (b, c) 1/4, and (d, e) 2 turns. As shown in Fig. 3(a), the as-cast HEA sample consists of a dendritic microstructure which is typical of cast HEAs. It was reported for an HEA with the same composition that the dendritic areas are slightly enriched with Co, Cr, and Fe, whereas the interdendritic areas have slightly higher Ni and Mn. Reference Salishchev, Tikhonovsky, Shaysultanov, Stepanov, Kuznetsov, Kolodiy, Tortika and Senkov38 After HPT for 1/4 turn, there is almost no change in microstructure at the disk center as shown in Fig. 3(b) but at the periphery, the initial dendritic structure disappears and instead the structure is elongated in the shear direction to form a band structure due to the high imposed strain. These trends are maintained up to 2 turns except there are finer interdendritic spaces at the disk center as shown in Fig. 3(d) and a finer spacing in the band structure at the disk edge as shown in Fig. 3(e).
Representative optical micrographs of (a) as-cast sample and (b) and (c) for 1/4 turns and (d) and (e) after 1/2 turns by HPT: (b) and (d) were taken at the disk center and (c) and (e) were taken at the disk edge. Inserted arrows show shear directions.

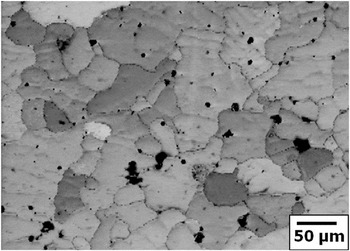
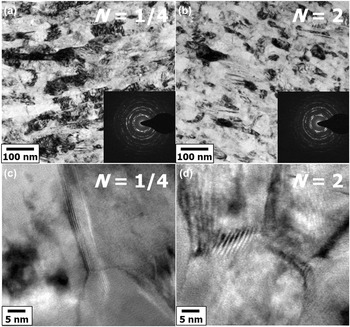
To acquire information on the true grain size instead of the dendrite size, EBSD analysis was conducted on the as-cast sample and the relative band contrast image is shown in Fig. 4 where the dendrites are less visible but instead the GBs are clearly defined. Using this procedure, the average grain size was determined as ∼40 μm. It was necessary to use TEM analysis to measure the grain sizes at the edge regions in the HPT disks and Figs. 5(a) and 5(b) show bright-field (BF) images and selected area diffraction (SAD) patterns of the disk edges for N = 1/4 and 2 turns, respectively. These micrographs show there are equiaxed fine grains with average sizes of ∼59 and ∼38 nm at the edges of the disks after 1/4 and 2 turns, respectively. The SAD patterns for both samples exhibit ring patterns indicating that grain refinement was achieved without preferred crystallographic orientation. In addition, higher magnification TEM images for the disks after 1/4 and 2 turns are shown in Figs. 5(c) and 5(d), respectively, suggesting that almost no twins develop in the HPT-induced nc structure. From these results, it is concluded that the HEA developed a nc structure in the very early stages of HPT processing and then the grain size further decreased gradually with increasing N.
Typical EBSD image of the as-cast HEA sample.

Representative BF TEM images and SAD patterns (inset) taken at the edges of the HPT disks after (a) 1/4 and (b) 2 turns. High resolution TEM images are provided in (c) and (d) for 1/4 and (b) 2 turns, respectively.

C. Nanoindentation behavior
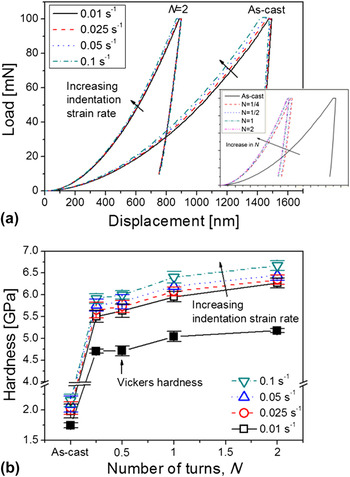
Nanoindentation tests were performed at the edges of both the as-cast sample and the processed disks to investigate the changes in mechanical behavior of the nc HEA after HPT. Figure 6(a) provides representative load–displacement (P–h) curves recorded from nanoindentations performed at four different
 ${\dot \varepsilon _{\rm{i}}}$
for the as-cast specimen and the processed disk after N = 2 turns. The solid arrows superimposed on the P–h curves for each sample show the effect of increasing indentation strain rate. The inset of Fig. 6(a) shows typical P–h curves taken at a fixed
 ${\dot \varepsilon _{\rm{i}}}$
of 0.025 s−1 for all five samples including the as-cast sample and the disk edges after HPT for 1/4, 1/2, 1, and 2 turns. There are two important conclusions from Fig. 6(a). First, it is apparent from the inset that, at a constant
 ${\dot \varepsilon _{\rm{i}}}$
, the processed samples show much smaller values of displacement at the peak load, h
max, than the as-cast sample and the values of h
max for the processed disks become smaller with higher N as indicated by the solid arrow on the P–h curves. The same trends were attained for all specimens at different values of
 ${\dot \varepsilon _{\rm{i}}}$
. Second, it is evident for both the as-cast and processed HEA samples that h
max decreases as
 ${\dot \varepsilon _{\rm{i}}}$
increases although the rate dependency becomes relatively small after deformation through HPT.
Results of nanoindentation experiments: (a) Representative P–h curves obtained at different indentation rates for the as-cast condition and N = 2 turns with inset image showing the variation in the curve with N at a fixed strain rate of 0.025 s−1 and (b) change in nanoindentation hardness as a function of N.

The nanoindentation hardness values, H, were estimated from the P–h curves according to the Oliver–Pharr method.
Reference Oliver and Pharr39
The variations in H as a function of N at four different
 ${\dot \varepsilon _{\rm{i}}}$
are summarized in Fig. 6(b) for the as-cast sample and the disks after HPT up to 2 turns where the as-cast condition was plotted as N = 0 turns. For comparison purposes, the measured Vickers hardness at the edges of the samples shown in Fig. 1 is also included in the plot after conversion to Mayer's hardness which is equivalent to P
max divided by the projected area instead of the surface area. Although the tendency of the change in H is almost the same for both sets of measurements, it is apparent that higher values were recorded for H compared with Hv. This may be due to an indentation size effect which is manifest as an increase in H with decreasing P (and depth h) for a sharp indentation; thus, a P
max of 100 mN for a measurement of H is lower than ∼980 mN for measuring Hv. Additionally, as expected from the P–h curves in Fig. 6(a), the estimated H for each HEA specimen is unambiguously rate-sensitive and increases with
 ${\dot \varepsilon _{\rm{i}}}$
where the trend is indicated with an arrow in the plot. It should be noted that this trend of a change in nanohardness with increasing N is not always the same but is dependent upon the nature of the material; e.g., a ZK60 magnesium alloy demonstrated a strain hardening behavior,
Reference Choi, Lee, Ahn, Durst, Kawasaki, Langdon and Jang40
whereas a Zn–22% Al eutectoid alloy showed a strain softening behavior.
Reference Choi, Kim, Ahn, Kawasaki, Langdon and Jang41
D. Nanocrystalline HEA beneath the indentation
An important issue concerns the stability of the nc structure in the HEA under conditions of severe external stresses such as beneath the indenter. To explore the microstructural stability of the nc HEA after HPT, the microstructure underneath the indenter was examined at the disk edge after N = 2 turns where a severe stress condition was created by the indentation.
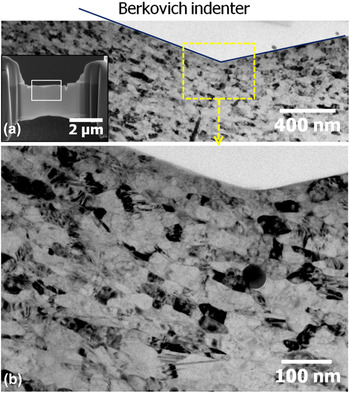
Figure 7(a) shows the BF image for the region near the hardness impression where an image of the FIB milling process during the sample preparation is provided as an inset, and Fig. 7(b) shows a magnified view of the dashed box in Fig. 7(a). The subsurface region underneath the hardness impression exhibits an average grain size d of ∼32 nm, which is reasonably consistent with the undeformed region in the same sample with d ≈ 38 nm as shown in Fig. 5(b). Thus, the observation suggests that the nc structure of the HPT-processed HEA demonstrates excellent microstructural stability under severe stress conditions.
TEM micrographs of the indentation region taken at a vertical cross-section of the disk edge after N = 2 turns: (a) A BF image of the subsurface region underneath the hardness impression with inset showing FIB milling process and (b) enlarged image of the dashed box in (a).

IV. DISCUSSION
A. Microstructural evolution in HPT processing
The XRD patterns in Fig. 2 show that the crystal structure of the alloy remains unchanged during HPT processing although it is evident from Figs. 4 and 5 that processing by HPT promotes significant grain refinement to the nanometer range. Some efforts have been made to synthesize nc HEAs through MA followed by consolidation. Reference Ji, Wang, Wang, Zhang, Wang, Zhang and Fu13,Reference Zhang, Fu, Zhang, Shi, Wang, Wang, Wang and Zhang22–Reference Praveen, Murty and Kottada Ravi24 Recently, Ji et al. Reference Ji, Wang, Wang, Zhang, Wang, Zhang and Fu13 investigated the microstructural evolution of the same component HEA during MA followed by SPS and reported that nc HEA samples prepared by this powder metallurgy procedure consisted of two different groups of grains of ∼100–200 nm with twins and ∼50 nm without twins. This is a consequence mainly of the structural coarsening during consolidation by SPS at 800 °C. By contrast, in the present study, the average grain sizes of the alloys processed by HPT were within the range from ∼59 nm after 1/4 turn to ∼38 nm after 2 turns and with no evidence for twinning within the grains, thereby confirming the ability to synthesize exceptionally fine nc HEA through HPT. Additionally, the nc structure after HPT processing maintains an initial fully-dense state which contrasts with the residual porosity in microstructures produced by a powder metallurgy process.
HEAs are well known to exhibit sluggish diffusion because there is no principal diffusion element and thus cooperative diffusion of the constituent atoms is required and this produces a high energy barrier for diffusion. Reference Tsai, Tsai and Yeh42,Reference Chang, Li, Huang, Hsu, Yeh and Lin43 Due to this sluggish diffusion effect, HEAs show slow grain growth and an increased recrystallization temperature Reference Wu, Liu, Wang, Ma, Stoica, Nieh, He and Lu11,Reference Bhattacharjee, Sathiara, Zaid, Gatti, Lee, Tsai and Yeh44 which leads to enhanced microstructural stability at elevated temperatures. In this respect, it is interesting to note that HPT processing rapidly produced an nc structure even after only 1/4 turn.
Recent studies demonstrated an enhanced diffusion in metals subjected to ECAP Reference Amouyal, Divinski, Estrin and Rabkin45–Reference Divinski, Reglitz, Rösner, Estrin and Wilde48 and HPT processing Reference Oh-ishi, Edalati, Kim, Hono and Horita49,Reference Ahn, Zhilyaev, Lee, Kawasaki and Langdon50 and therefore a similar enhancement is anticipated in the present alloy during HPT. The diffusion coefficient, D, of the as-cast alloy is given by the conventional Arrhenius equation:
 $$D = {D_0}\exp \left( { - {Q \over {RT}}} \right)\quad ,$$
where D 0 is the pre-exponential factor, Q is the activation energy, T is the absolute temperature, and R is the gas constant. When a torsional stress, τt, is applied during HPT processing, the activation energy barrier is lowered through the work done by the stress. Thus, Q of Eq. (2) is replaced by (Q–τ t V d*) where V d* is the activation volume for diffusion and is generally estimated as the average molar volume of the constituent elements. Reference Oh-ishi, Edalati, Kim, Hono and Horita49,Reference Minamino, Yamane and Shimomura51 For example, Minamino et al. Reference Minamino, Yamane and Shimomura51 determined V d* by evaluating the pressure dependence of diffusion coefficient and revealed that the value is similar to molar volume. Considering the small temperature increase from T 1 (corresponding to RT) to T 2 by adiabatic heating during HPT, Reference Figueiredo, Pereira, Aguilar, Cetlin and Langdon34,Reference Edalati, Miresmaeili, Horita, Kanayama and Pippan52,Reference Pereira, Figueiredo, Huang, Cetlin and Langdon53 the degree of diffusive enhancement may be expressed using an enhanced diffusion coefficient, D HPT:
 $${{{D_{{\rm{HPT}}}}} \over D} = {{{D_0}\exp \left( { - {{Q - {\tau _{\rm{t}}}V_{\rm{d}}^*} \over {R{T_2}}}} \right)} \over {{D_0}\exp \left( { - {Q \over {R{T_1}}}} \right)}} = \exp \left[ {{{Q\left( {{T_2} - {T_1}} \right) + {\tau _{\rm{t}}}V_{\rm{d}}^*{T_1}} \over {R{T_1}{T_2}}}} \right]\quad .$$
In the HEA examined in this study, the values of D of each constituent element decrease in the sequence of Mn, Cr, Fe, Co, and Ni Reference Tsai, Tsai and Yeh42 so that Ni is expected to determine the reaction rates of any diffusion-related processes. Therefore, it is reasonable to estimate the value of Eq. (3) based on the diffusion-related parameters for Ni. The value for Q of Ni in this alloy is 317.5 kJ mol−1 (Ref. Reference Tsai, Tsai and Yeh42) and V d* is estimated as ∼7 × 10⁻⁶ m3 mol−1 which is the average molar volume of the constituent elements.
For an estimation of the value of τt in Eq. (3), an FEA simulation was conducted and the estimated variations in τt along radial directions from the center of the disk are plotted in Fig. 8. For simplicity, the simulation was performed for a rotation angle, θ, of 70° which is close to 1/5 turn in HPT. At the top in Fig. 8, the distributions of τt in the disk surfaces are illustrated through a series of colors representing the different listed stresses. As shown in Fig. 8, τt is negligible at the initial compression stage so that τt = 0 throughout the disk diameter and increases significantly with increasing distance from the center after 1/5 turn where τt = 0 at the disk center where r = 0. It should be noted that the peripheral regions receive a limited torsional stress which is due to the restriction of metal flow around the edge of the disk near the outflow region. Reference Kim54 Thus, from the simulation, it follows that τt ≈ 3.26 GPa which is the highest measured stress at the edge of the disk as applied in Eq. (3).
Simulated torsional stress versus the distance from the center of disks after only compression and HPT for ∼1/5 turn. As inset provides distributions of torsional stresses represented by different colors over the semicircle disk surfaces after only compression and ∼1/5 turn.

An additional parameter in Eq. (3) is the HPT-induced temperature increase for the disks, corresponding to T 2. A recent report estimated the temperature rise in samples in the early stages of HPT given by ΔT = 0.22σω, where σ is the flow stress in MPa and ω is the rotation rate in rad/s. Reference Pereira, Figueiredo, Huang, Cetlin and Langdon53 The equation for temperature rise during HPT was derived both empirically and computationally by taking into account the heat capacity of the materials. Thus, applying an experimental value of σ ≈ 250 MPa for the HEA Reference Wu, Liu, Wang, Ma, Stoica, Nieh, He and Lu11 and ω ≈ 0.10 rad/s which is equivalent to 1 rpm, a value of ΔT ≈ 10 K was estimated for the HEA. Taking T 1 = 298 K and T 2 = 308 K in Eq. (3), the enhancement of diffusivity by HPT processing was estimated as ∼4.75 × 10⁵ for ∼1/4 turn. From this calculation, it is concluded that the large enhancement in the diffusion coefficient during HPT processing, especially by the torsion stress, may play an important role in producing the nc HEA even when the torsional straining is conducted through only 1/4 turn. It is noteworthy that recent reports showing a significant enhancement in diffusivity during HPT considered the effects of severe compressive pressure Reference Oh-ishi, Edalati, Kim, Hono and Horita49,Reference Ahn, Zhilyaev, Lee, Kawasaki and Langdon50 and the high population of lattice defects. Reference Oh-ishi, Edalati, Kim, Hono and Horita49 By contrast, the present study demonstrates the significance of torsional straining through the HPT procedure for producing nc materials. Thus, it follows that the true atomic diffusivity may be even faster than in the present estimate under compression and concurrent torsional straining.
B. Strain-rate sensitivity, activation volume, and deformation mechanism
The strain-rate sensitivity (SRS), m, is an important material property which permits a better understanding of thermally activated plastic deformation mechanisms and is often determined at a give strain ε and T by relating the uniaxial flow stress σf and strain rate
 $\dot \varepsilon$
Reference Choi, Kim, Wang, Ramamurty and Jang55
through the expression:
 $$m = {\left( {{{\partial {\rm{ln}}{\sigma _{\rm{f}}}} \over {\partial {\rm{ln}}\dot \varepsilon }}} \right)_{\varepsilon ,T}}\quad .$$
In the case of indentation, σf may be estimated by the well-known Tabor empirical relationship of σf = H/C where C is a constraint factor of ∼3 for fully plastic deformation.
Reference Shim, Jang and Pharr56
Applying the empirical relation between
 $\dot \varepsilon$
and the indentation strain rate of
 $\dot \varepsilon \approx 0.01{\dot \varepsilon _{\rm{i}}}$
,
Reference Wang, Lai, Huang and Nieh57
the value of m is estimated for each material from the slope of a double logarithmic plot of H/3 versus
 ${\dot \varepsilon _{\rm{i}}}$
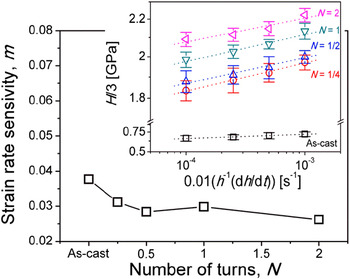
as shown in the inset of Fig. 9 and the changes in m with increasing N are summarized for the HEA samples in the main figure where the as-cast condition is set at N = 0 turn.
Variation in SRS with increasing N. Inset showing stress versus strain rate.

The value of m for the as-cast HEA sample was determined as ∼0.038, which is almost ten times higher than for general cg fcc metals (e.g., for pure Ni m ≈ 0.0028 Reference Dalla Torre, Spätig, Schäublin and Victoria58 ). In Fig. 9, the estimated m is slightly reduced to ∼0.031 through 1/4 turn and thereafter remains reasonably constant as N increases to 2 turns. Thus, the change in m is almost negligible for the HEA through HPT, and since a high value of m often corresponds to a higher capacity to produce plasticity, the trend shown in Fig. 9 implies that the remarkable increase in strength observed after HPT processing does not seriously affect the plasticity. It should be noted also that the values of m after HPT are at least similar to, or even higher than, those of nc metals having an fcc structure (e.g., m ≈ 0.015–0.034 for nc Ni having d < 100 nm Reference Schwaiger, Moser, Dao, Chollacoop and Suresh59–Reference Wang, Hamza and Ma62 ). Thus, the nc HEA in this investigation exhibits reasonably high plasticity even though significant strengthening is achieved during the HPT process.
The detailed plastic deformation mechanism may be estimated from the value of the activation volume, V p*, which is given by:
 $${V_{\rm{p}}}^* = \sqrt 3 kT\left( {{{\partial {\rm{ln}}\dot \varepsilon } \over {\partial {\sigma _{\rm{f}}}}}} \right) = \sqrt 3 kT\left( {{{\partial {\rm{ln}}\dot \varepsilon } \over {\partial \left( {{H \mathord{\left/ {\vphantom {H C}} \right. \kern-\nulldelimiterspace} C}} \right)}}} \right) = {{C\sqrt 3 kT} \over {mH}}\quad ,$$
where k is the Boltzmann's constant. It was shown earlier that the value of V p* varies by orders of magnitude for different rate-limiting processes Reference Zhu, Li, Samanta, Kim and Suresh63 with typical values of V* in the ranges of ∼100b 3 to 1000b 3 for dislocation glide of fcc metals, Reference Conrad64 ∼10b 3 for GB sliding Reference Conard65 and ∼b 3 to 10b 3 for diffusion either along the GB or through the crystalline lattice. Reference Conrad64,Reference Frost and Ashby66
Using Eq. (5), the value of V
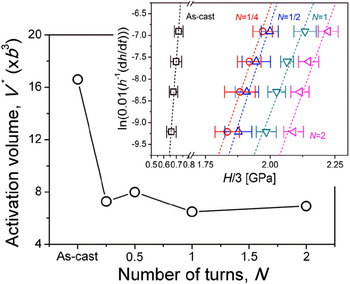
p* was determined from the slope of the linear fit of logarithmic strain rate versus linear flow stress shown in the inset of Fig. 10 for the HEA sample with the as-cast condition set as N = 0 and datum points shown up to 2 turns. The changes in the V
p* values are summarized in the main plot of Fig. 10 where the Burgers vector for the alloy was calculated as
 $b = a \times {{\sqrt 2 } \sol\mathord{\left{\vphantom {{\sqrt 2 } 2}} \right\kern-\nulldelimiterspace} 2} \approx 2.25 \times {10^{ - 10}}\,{\rm{m}}$
, where a is the lattice parameter. For the as-cast sample, the value calculated for V
p* is ∼16b
3 which is smaller than V
p* for conventional metals for the forest dislocation cutting mechanism.
Reference Zhu, Li, Samanta, Kim and Suresh63,Reference Conrad64
This result is due to the severely distorted lattice which is an inherent feature of fcc HEAs leading to stronger Peierls barriers than in conventional metals.
Reference Otto, Dlouhý, Somsen, Bei, Eggeler and George9,Reference Wu, Bei, Pharr and George67
Change in activation volume with increasing N. Logarithmic strain rate versus linear stress is also given as inset.

In conventional nc metals, V p* for dislocation-mediated flow is known to be reduced through grain refinement since GBs begin to play important roles in the plastic flow by both interacting with dislocations and introducing dislocations. Reference Wang, Hamza and Ma62,Reference Ma68 A similar trend is apparent in Fig. 10 where the value of V p* decreases to ∼7b 2 in the early stage of HPT through 1/4 turn and thereafter retains a reasonably constant value of V p* ≈ 6–8b 3 with no dependence on N in further processing. The difference in V p* between the as-cast sample with ∼16b 3 and the HPT-processed disks with ∼6–8b 3 indicates that the predominant deformation mechanism in the HPT-processed disks may be different from the as-cast sample. Furthermore, since V p* for the nc HEA is smaller than ∼10b 3, it appears that the deformation mechanism is similar to conventional nc metals as in GB-mediated dislocation activities. Reference Dao, Lu, Asaro, De Hosson and Ma18,Reference Asaro and Suresh69 Thus, it is concluded that the predominant deformation mechanisms of the present alloy transforms to GB-mediated plasticity as the grain size is reduced to within the nanoscale regime.
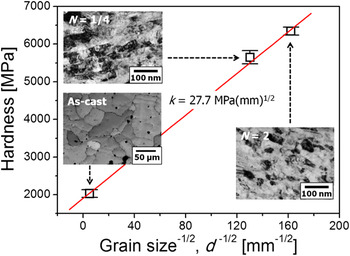
To investigate the significance of grain refinement, the variations in H as a function of the average grain size, d, are summarized in Fig. 11 in the form of hardness versus the inverse square-root of the grain size. Within the observed grain size range, the H values closely follow the Hall–Petch (HP) relationship given by
 $$H = {H_0} + {k_{{\rm{HP}}}}{d^{{{ - 1} \mathord{\left/ {\vphantom {{ - 1} 2}} \right. \kern-\nulldelimiterspace} 2}}}\quad ,$$
where H 0 is the intrinsic hardness of the HEA and k HP is a material constant which is often referred to as the locking parameter or HP coefficient. The inset images in Fig. 11 are micrographs from Fig. 4 and Figs. 5(a) and 5(b) for samples in the as-cast condition and after N = 1/4 and 2 turns, respectively. The value of k HP for the alloy may be calculated from the slope of the linear relation denoted by a red line in Fig. 11 and estimated as ∼27.7 MPa mm1/2. The reasonable agreement between the calculated value of k HP and the reported value for this HEA of ∼21.8 MPa mm1/2 (Ref. Reference Liu, Wu, He, Nieh and Lu10) leads to the conclusion that the significant hardening by HPT is mainly due to grain refinement rather than by any other strengthening mechanism including dislocation strengthening enhanced by the increased dislocation density. It should be noted also that the value of k HP for the present fcc HEA is higher than for conventional fcc metals where the upper bound value of k HP is ∼19.0 MPa mm1/2. Reference Wu, Zhang, Huang, Bei and Nieh70
Change in hardness as a function of grain size in the HEA system.

C. The stability of the nc HEA
Several earlier studies reported that rapid grain growth may occur in nc metals during plastic deformation at RT or even at cryogenic temperatures and this is especially apparent for metals having fcc structures, such as Cu and Al, due to the large excess free energy associated with the significant volume fraction of GBs. Reference Jin, Minor, Stach and Morris71–Reference Zhang, Weertman and Eastman73 This dynamic grain growth is understood as a microstructural evolution toward equilibrium driven by stresses during plastic deformation Reference Dao, Lu, Asaro, De Hosson and Ma18 and it is known to decrease the hardness and strength of nc metals.
By contrast, in the present study, and despite the significant volume fraction of GBs in the nc structure, the alloy demonstrated excellent stability under severe stress conditions (Fig. 7). Thus, although the detailed mechanism is not fully understood, it is reasonable to suggest that the source of this excellent microstructural stability lies in the nature of the nc HEA and especially the associated sluggish diffusion. Nevertheless, this explanation appears inconsistent with the dramatic grain refinement occurring in the as-cast HEA system through HPT. Indeed, Liao et al. Reference Liao, Kilmametov, Valiev, Gao, Li, Mukherjee, Bingert and Zhu74 reported that grain growth occurs even during HPT in electrodeposited nc Ni. Therefore, another possibility is that the stress-induced change in diffusivity of the HEA is dependent upon the loading type such that it becomes more pronounced under torsional straining. It is also constructive to note that there are other external parameters which may be important, including the compressive stress, rotation speed, and processing temperature, and thus it is not generally feasible to identify the predominant mechanism that characterizes the microstructural stability of the nc HEA under the present experimental conditions. Therefore, additional systematic experiments and simulations are now required, including on other HEA systems, to confirm the present trend and to provide information on the precise mechanism of microstructural stability in nc HEAs.
V. SUMMARY AND CONCLUSIONS
-
(1) A CoCrFeNiMn HEA was processed by HPT under 6.0 GPa at RT up to 2 turns. Nanoindentation measurements were conducted to measure hardness and to estimate the SRS and activation volume of the nc HEA with increasing HPT turns. Microstructural changes were observed by TEM to evaluate the evolution through HPT and the stability of the nc structure under severe stress.
-
(2) Processing by HPT refined the grain size of the HEA from an initial value of ∼40 µm to ∼40 nm through 2 turns of HPT leading to a significant increase in hardness. The nc structure was evident even in the early stage of HPT processing and this is attributed to the enhanced atomic diffusion due to the severe torsional stresses.
-
(3) The microstructural and hardness evolution demonstrated an excellent agreement with the Hall–Petch relationship. It is concluded that the significant hardening in the nc HEA is mainly due to the grain refinement from HPT processing.
-
(4) The SRS remained reasonably constant between the as-cast condition and after HPT processing. The results suggest that GB-mediated dislocation activities are the predominant deformation mechanism in the nc HEA where this trend differs from the as-cast sample but is consistent with conventional nc metals.
-
(5) Despite the significant volume fraction of GBs in the nc HEA, it is shown by TEM that the nc microstructures after HPT demonstrate an excellent stability under the severe stress conditions introduced by nanoindentation.
ACKNOWLEDGMENTS
The research of JIJ and DHL was supported in part by the National Research Foundation of Korea (NRF) grant funded by the Korea government (MSIP) (No. 2013R1A1A2A10058551), and in part by the Human Resources Development program of the Korea Institute of Energy Technology Evaluation and Planning (KETEP) grant funded by the Korea government (MOTIE) (No. 20134030200360). The work of MK was supported in part by the NRF Korea funded by MoE under Grant No. NRF-2014R1A1A2057697. The work of TGL was supported by the National Science Foundation of the United States under Grant No. DMR-1160966 and by the European Research Council under ERC Grant Agreement No. 267464-SPDMETALS.