Introduction
Sainfoin (Onobrychis viciifolia Scop.) as a forage crop from the Leguminosae family originated from Central and East Central Asia as well as Mediterranean areas. The Onobrychis genus is a valuable pasture and fodder species with good stability against environmental conditions in semi-arid regions (Poudel et al., Reference Poudel, Bhattarai, Singer, Biligetu and Acharya2023). The Onobrychis genus includes more than 100 annual and perennial herbaceous species that are scattered in Mediterranean areas, especially in the Middle East. In Iran, there are about 56 species of sainfoin, of which 27 species are exclusive, so the species of the genus are valuable as fodder and pastures regarding palatability (Javadi et al., Reference Javadi, Jafari, Yeganeh and Amirkhani2017). According to global warming and climate changes, one of the most important challenges of agricultural production systems in arid and semi-arid regions is the provision of water sources for the irrigation of crops. Therefore, cultivation of crops without irrigation and under rainfed conditions is one of the climate-smart agronomic management options and can be considered an adaptation measure to widespread water shortage (Rastegaripour et al., Reference Rastegaripour, Tavassoli, Babaeian, Fernández-Gálvez and Caballero-Calvo2024). Sainfoin, like other leguminous crops, can produce satisfactory yield in conditions of water shortage because it is equipped with deep and developed roots that can penetrate up to 2m deep (Carbonero et al., Reference Carbonero, Mueller-Harvey, Brown and Smith2011), whereas its straight and long roots with secondary branches provide its survival ability in dry conditions (Irani et al., Reference Irani, Majidi, Mirlohi, Zargar and Karami2015). This good adaptability to rain-fed agriculture makes sainfoin a desirable forage crop for cultivation in rain-fed areas and pastures, and it grows well in upland areas, especially in soils that are intermittently irrigated (Porqueddu et al., Reference Porqueddu, Ates, Louhaichi, Kyriazopoulos, Moreno, Del Pozo and Nichols2016).
The harvested area of sainfoin is much less than alfalfa and clover worldwide but its adaptability to stresses is caused by its performance in areas with less than 300 mm rainfall is acceptable. Fresh forage sainfoin is soft and palatable to foraging livestock with high protein content, nutritious stalks better than alfalfa, less leaf fall and its general nutritional value is reported to be equal to the alfalfa (Bhattarai et al., Reference Bhattarai, Coulman and Biligetu2016). Also, sainfoin can be produced in fields that are not able to produce alfalfa and clover obtaining an acceptable forage yield (Sheppard et al., Reference Sheppard, Cattani, Ominski, Biligetu, Bittman and McGeough2019). The new growth of sainfoin perennial forage legume in the spring commences earlier than alfalfa and unlike alfalfa stays green throughout the summer due to its low water requirement, so sainfoin is a good candidate for improving degraded pastures, feeding livestock and wild animals (Sowiński and Adamczewska-Sowińska, Reference Sowiński, Adamczewska-Sowińska, Meena and Kumar2022). Sainfoin can be cultivated to improve pastures and control erosion whereas it is tolerant to poor soil conditions and can grow in soils with very low phosphorus (Khatiwada et al., Reference Khatiwada, Acharya, Larney, Lupwayi, Smith, Islam and Thomas2020).
Awareness of the genetic diversity and the relationships of traits with forage yield can provide the basis for faster and more accurate selection of suitable populations with high performance. The investigations about the diversity of quantitative and qualitative traits on sainfoin indicated the existence of remarkable diversity in this crop. The variation and relationships among morphological and qualitative traits between 12 populations of sainfoin indicated significant differences for most morphological measured traits, and the first four principal components explained 88% of variation as crop density, quality, seed and biomass components (Mohajer et al., Reference Mohajer, Jafari, Mat-Taha, Syafawati-Yaacob and Saleh2013). Zarrabian et al. (Reference Zarrabian, Majidi and Ehtemam2013) investigated the genetic diversity of sainfoin landraces using morphological and molecular markers and showed that there is a significant difference among the landraces which were divided into three distinct groups based on morphologic traits. Tadayyon and Rafieiolhossaini (Reference Tadayyon and Rafieiolhossaini2013) observed significant differences in terms of fresh and dry weight, protein content, fibre percentage and seed yield of 12 sainfoin ecotypes. There is relatively little information about sainfoin; therefore, the purpose of this research was to investigate the diversity of morphological characteristics, forage yield performance and seed yield in different populations of some Iranian sainfoin genotypes. Thus, to identify landraces with high-yield performance genotype grouping should be done using statistical tools.
Materials and methods
Trials
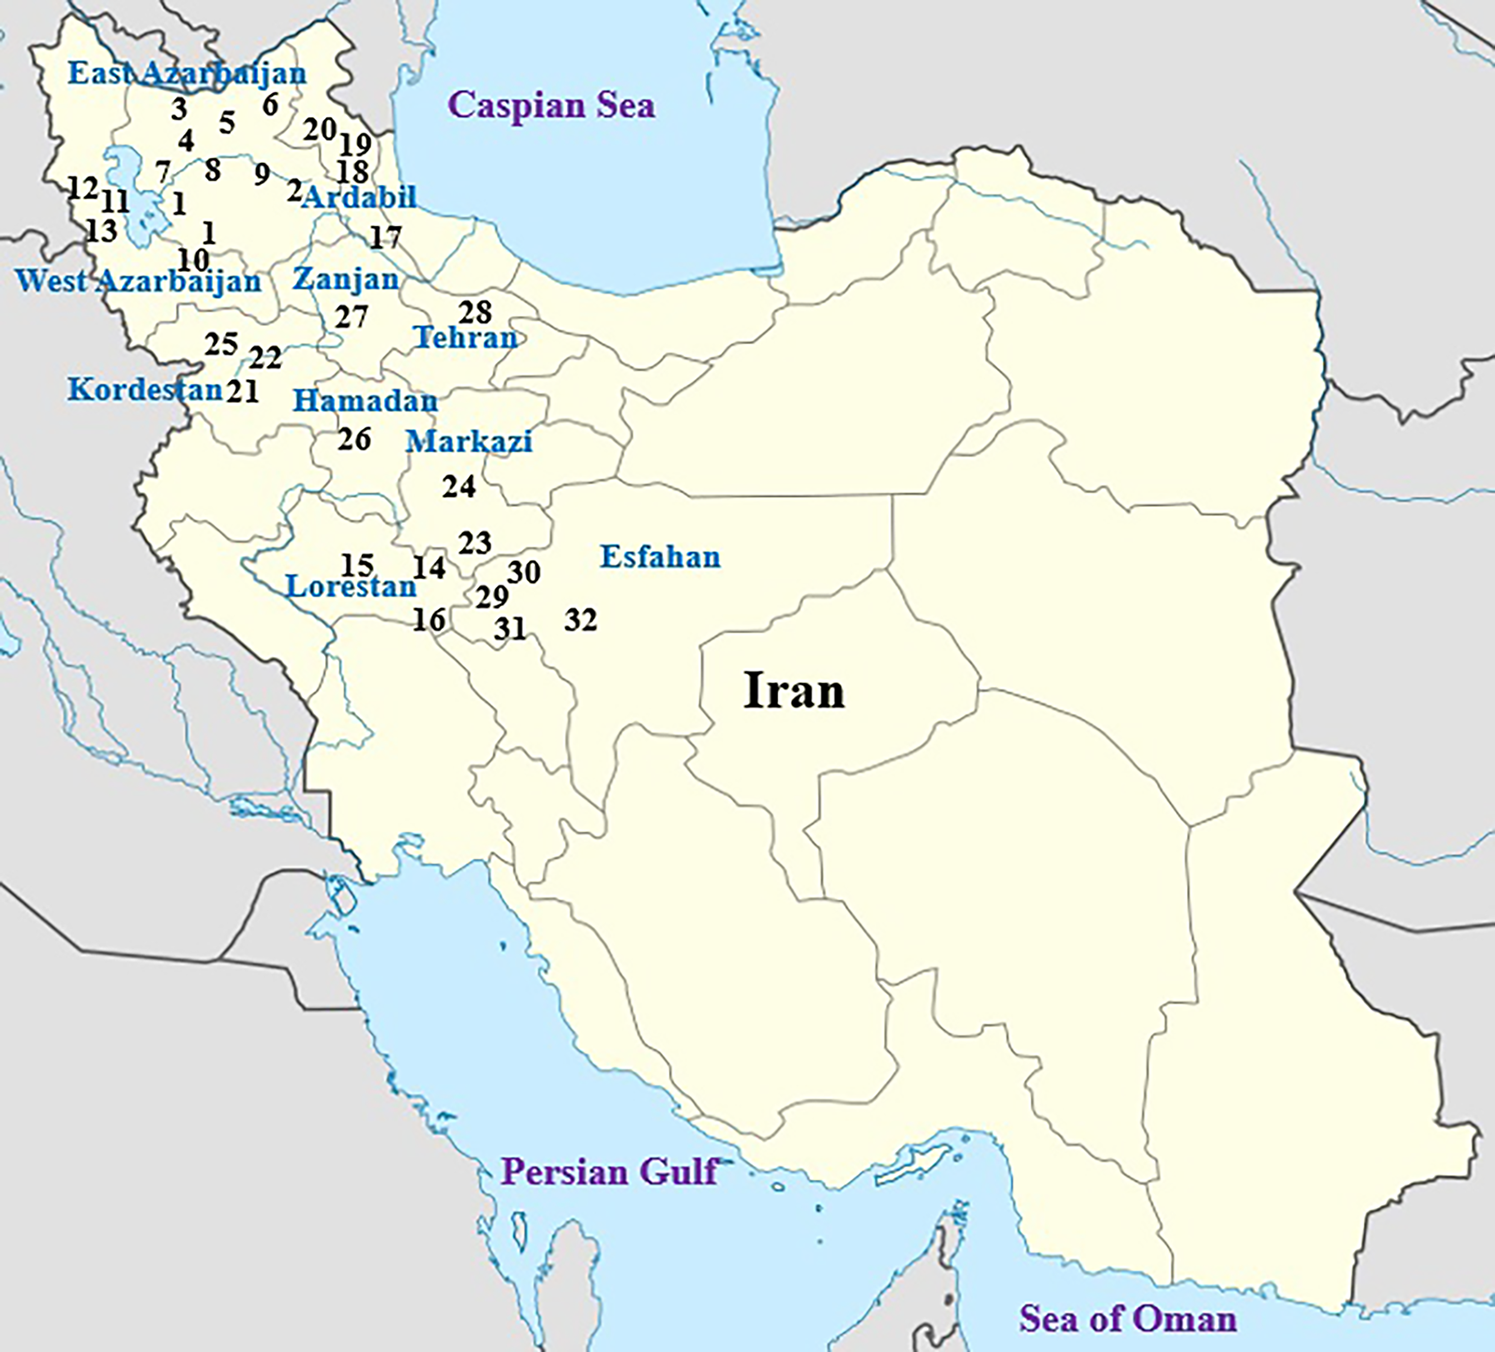
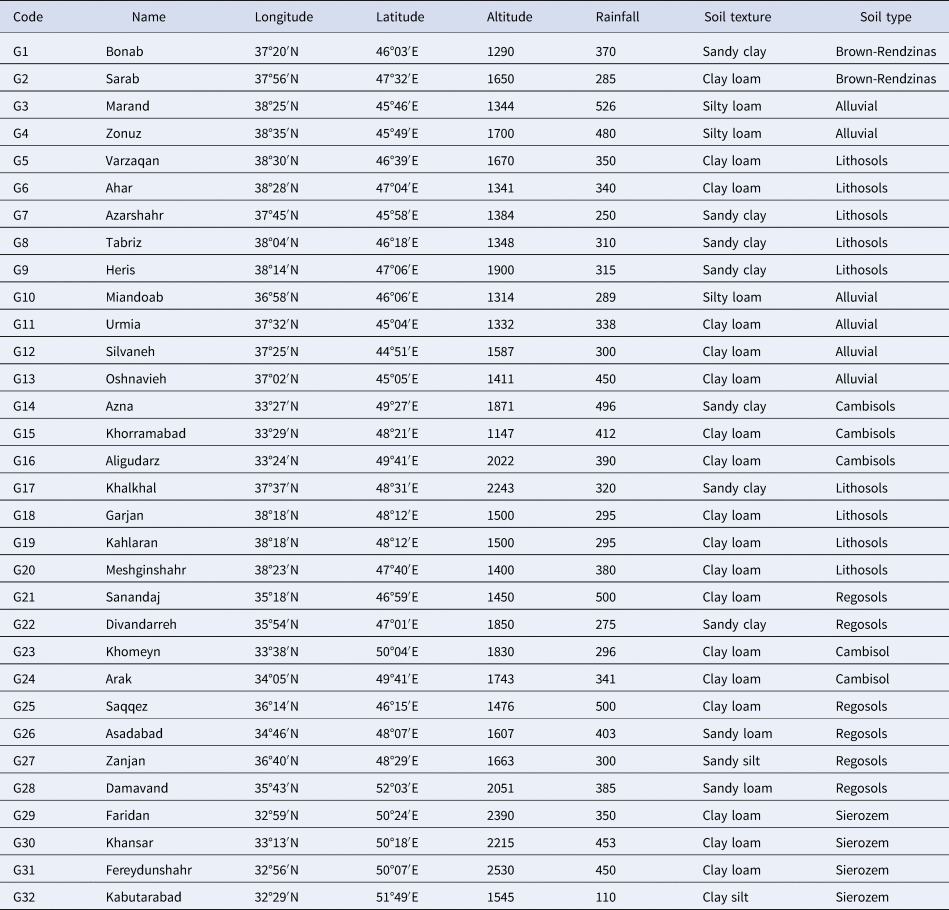
This research was performed during the 2021–2023 cropping seasons at the research farm at the University of Maragheh (37°23′N; 46°14′E). The seed of 32 local landraces were obtained as local landraces from various geographic regions of Iran (Fig. 1), from the East Azerbaijan Agricultural and Natural Resources, Tabriz, Iran. The names of the studied sainfoin landraces are given in Table 1. The experiment was conducted in the form of a randomized complete block scheme with four replicates. After ploughing, levelling and plotting the field, the seeds were planted in the second half of 22nd April 2021. Each experimental plot consisted of four lines with 0.25 m intervals while each line length was 2 m. The amount of cultivated seed was determined based on the thousand seed weight, 300 seeds per square meter. Irrigation and fertilizing were done according to the needs of the plant based on local experience and weed control was done manually.
Geographical positions of some of 32 sainfoin genotypes in the map of Iran.

Name, geographical coordinates and some properties of origins of 32 sainfoin genotypes

Traits
The first year (2021) was the year of crop establishment and in the second and third years (2022 and 2023) the landraces were evaluated in terms of forage yield and other morphological-related traits. Since the crop was cultivated in 2021, a fixed day (20th of March) was chosen as the starting point for measuring the days to flowering (DF) and days to seed filling (DSF). The other studied characteristics of sainfoin were measured from 15 randomly selected plants from each plot as stem number per plant (SNP), node number per main stem (NNMS), longest stem height (LSH), peduncle height (PH), inflorescence height (IH), internode number per main stem (INMS), distance between internodes (DI), leaves number per main stem (LNMS), leaves number per plant (LNP), leaflets number per leaf (LNL), leaves number per stem (LNS), per cent of powdery mildew (PPM), fresh weight of stems (FWS), fresh weight of leaves (FWL), fresh weight of inflorescences (FWI), dry weight of stems (DWS), dry weight of leaves (DWL), dry weight of inflorescences (DWI), ratio of dry leaf to dry stem (RLS), floret number per inflorescence (FNI), seed number per inflorescence (SNI), stem diameter (SD) and inflorescence number (IN). Also, plant number per area (PNA), fresh yield (FY), dry yield (DY), the ratio of dry yield to fresh yield (RDF), thousand seed weight (TSW) and seed yield (SY) were measured in each plot from central rows. Forage yield was harvested at the stage of development at 50% flowering from three harvests and seeds were harvested at final maturity from the fourth harvest.
Statistical analysis
Analysis of variance (ANOVA) was undertaken for the characteristics that were measured according to the general linear model based on a randomized complete block scheme model via SAS 9.1 statistical package (SAS Institute Inc., Cary), and before ANOVA, the normality of the distribution of deviations for all of the measured characteristics was tested and confirmed. Also, for the homogeny test of the error variance from yearly ANOVA following Hartley's Fmax test, the error variances were homogeneous for all the characteristics. The broad sense heritability (H2BS), across both years, was calculated according to the consideration of genotypic and GY interaction effects and genetic advance (GA) or potential for crop genetic improvement was computed at 10% selection intensity with K = 1.76, whereas K is the selection differential. Also, the GA as % of the mean (GAM) is computed as its ratio. To group the examined sainfoin landraces, a cluster analysis was performed using the correlation matrix of the standardized data for all characteristics using the least variance method of Ward and squared Euclidean distance measure. The multivariate ANOVA was used to determine the appropriate place to cut-off point in the dendrogram. The SAS assisted JMP Pro 17.0 (SAS, NC, USA) and IBM-SPSS version 24.0 (IBM-SPSS, NY, USA) computer applications were used to analyse data and draw graphs.
Results
Analysis of variance
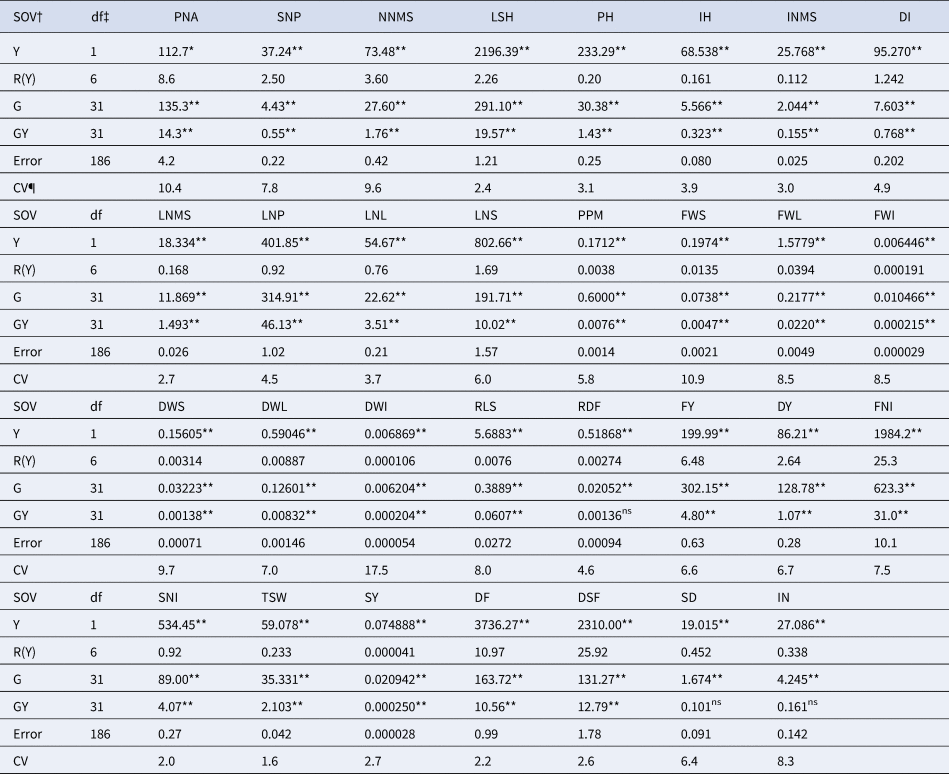
Thirty-two sainfoin landraces were evaluated for the variability, genetic advance, broad sense heritability (H2BS) and association of their 31 characteristics during the 2022 and 2023 growing seasons. Table 2 indicates the combined ANOVA results, so for all characteristics other than the PNA, the variance resulting from years differed significantly among landraces at P < 0.01, while for PNA, the years were significantly different at P < 0.05. All characteristics other than the RDF, SD and IN showed meaningful differences (P < 0.01) across landraces and their interactions by year (Table 2). Considering significant GY interaction in most characteristics of sainfoin showed that ranking of the landraces indicated differences from 2022 to 2023. The coefficient of variation (CV) for the combined experimental design ranged from 2.2 in DF to 17.5% in DWI, so the magnitudes of the model's residuals or pooled error mean squares were in an acceptable range, and the validity of yearly trials can be verified.
Combined analysis of variance for measured traits of 32 sainfoin genotypes across 2022 and 2023 years

† SOV, source of variation including year (Y), replication within year (R/Y), genotype (G), genotype by year interaction (GY) and error terms; ‡df, degrees of freedom; ¶CV, coefficient of variation.
Traits are: PNA, plant number per area; SNP, stem number per plant; NNMS, node number per main stem; LSH, longest stem height; PH, peduncle height; IH, inflorescence height; INMS, internode number per main stem; DI, distance between internodes; LNMS, leaves number per main stem; LNP, leaves number per plant; LNL, leaflets number per leaf; LNS, leaves number per stem; PPM, per cent of powdery mildew; FWS, fresh weight of stems; FWL, fresh weight of leaves; FWI, fresh weight of inflorescences; DWS, dry weight of stems; DWL, dry weight of leaves; DWI, dry weight of inflorescences; RLS, ratio of dry leaf to dry stem; RDF, ratio of total dry weight to total fresh weight; FY, fresh yield; DY, dry yield; FNI, floret number per inflorescence; SNI, seed number per inflorescence; TSW, thousand seed weight; SY, seed yield; DF, days to flowering; DSF, days to seed filling; SD, stem diameter; and IN, inflorescence number.
Coefficient of variation
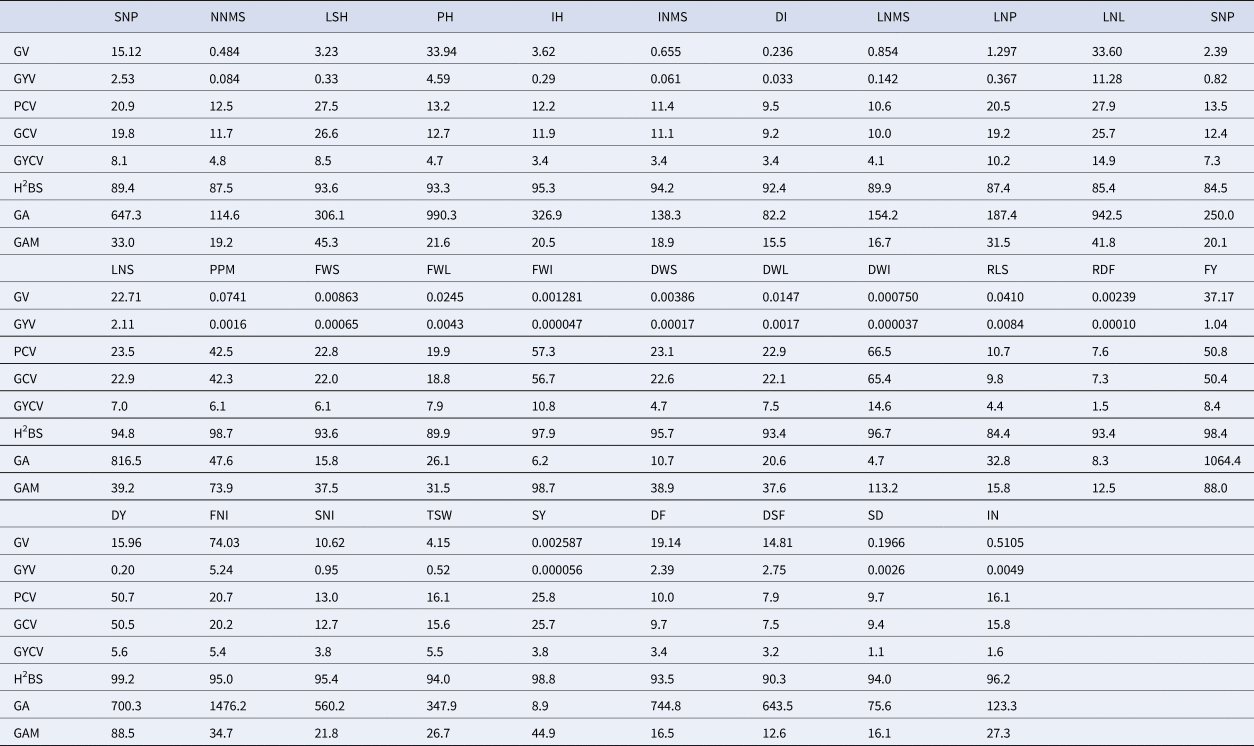
The magnitude of phenotypic CV (PCV), genotypic CV (GCV), genotype by year interaction CV (GYCV), H2BS (the ratio of genetic factors in the control of a characteristic) and genetic advance (GA), which shows the gain amount in special selective condition, are presented in Table 3. Thus, genetic advance indicates how much gain may be attained from phenotypic selection for a trait. The PCV and GCV values below 20%, 20–40% and above 40% were considered low, moderate and high, so PCV and GCV were high for DWI, FY, DY, PPM and FWI while their amounts were moderate for LSH, LNL, LNS, FWS, DWS, DWL, FNI and SY (Table 3). The PCV was moderate for SNP and LNP while their GCV was low. Also, the PCV and GCV values were low for the remaining 16 characteristics of sainfoin landraces. The observed differences for PCV and GCV ranged from 0.1 to 2.2% which demonstrated the importance of the genetic components and low interference of environmental factors. The GYCV values were relatively low, ranging from 1.1 in SD to 14.9% in LS. Thus, the effect and variation of GY interactions are negligible for most traits in sainfoin, so breeding efforts for these landraces may be immediately successful.
Some genetic parameters for 31 characteristics of 32 sainfoin genotypes

GV, genotypic variance; GYV, GY variance; PCV, phenotypic CV; GCV, genotypic CV; GYCV, genotypic by year interaction CV; H2BS, heritability in broad sense; GA, genetic advance at 5% statistical probability; and GAM, GA as a % of mean.
Traits are: PNA, plant number per area; SNP, stem number per plant; NNMS, node number per main stem; LSH, longest stem height; PH, peduncle height; IH, inflorescence height; INMS, internode number per main stem; DI, distance between internodes; LNMS, leaves number per main stem; LNP, leaves number per plant; LNL, leaflets number per leaf; LNS, leaves number per stem; PPM, per cent of powdery mildew; FWS, fresh weight of stems; FWL, fresh weight of leaves; FWI, fresh weight of inflorescences; DWS, dry weight of stems; DWL, dry weight of leaves; DWI, dry weight of inflorescences; RLS, ratio of dry leaf to dry stem; RDF, ratio of total dry weight to total fresh weight; FY, fresh yield; DY, dry yield; FNI, floret number per inflorescence; SNI, seed number per inflorescence; TSW, thousand seed weight; SY, seed yield; DF, days to flowering; DSF, days to seed filling; SD, stem diameter; and IN, inflorescence number.
Heritability and genetic advance
The H2BS of the sainfoin characteristics were higher than 80%, so they were categorized as high ones (Table 3). The H2BS was influenced by the crop's nature and environmental factors because traits are generated by the genetic and environmental effects as well as their interactions. The selection in ideal conditions ignores the limitations of the target region, like low H2BS in poor environmental conditions, so observing low H2BS in low input circumstances is routine (Sadras and Slafer, Reference Sadras and Slafer2012). Thus, regarding the high values of H2BS for sainfoin landraces, maybe it is due to high-yielding years or historical adaptability of sainfoin in geographical areas of Iran. Thus, these local landraces have good adaptability properties, so their traits' heritability was high. The amounts of the GAM (genetic advance as a mean per cent) as >15, 15–30 and <30% were classified as high, moderate and low, respectively, so the GAM of four characteristics (INMS, RDF, DF and SD) was low while the GAM of 11 characteristics (SNP, LSH, PH, LI, IH, LNL, RLS, SNI, TSW, DSF and IN) was moderate (Table 3). The GAM of the other 16 remaining characteristics was high, so the genetic advance of most studied characteristics was high and moderate and they can be improved by suitable selection strategy.
Descriptive statistics
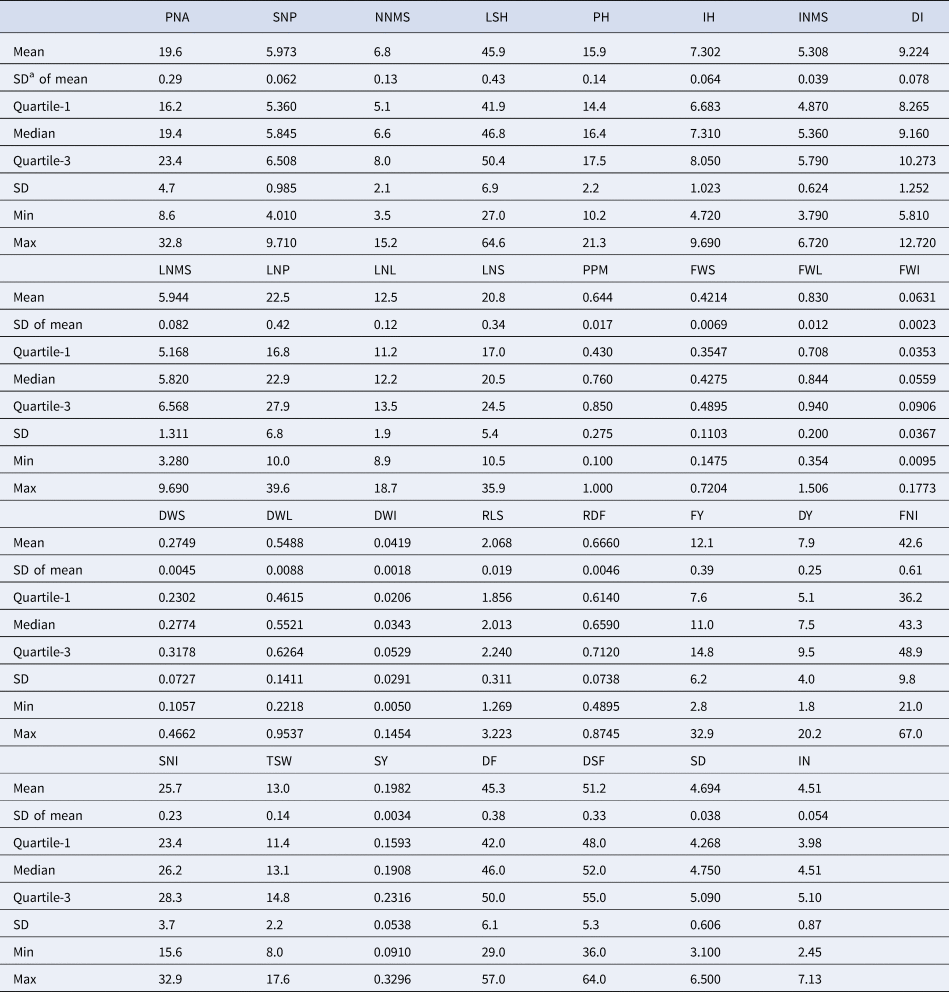
Some descriptive statistics are given in Table 4, and means of FY and DY were 12.1 and 7.9 t/ha, respectively, so the fresh and dry yield of the sainfoin landraces in 2022 and 2023 were found much more than that of 2021 (data are not shown). Forage breeders mentioned that the forage yield of the perennial crops in the first establishing year is much lower than the next years (Sayar et al., Reference Sayar, Han and Basbag2022), due to some factors; the short vegetative season, and low photosynthetic ability regarding lower leaf area in the first year. Regarding the magnitudes of the interquartile range which contains the second and third quartiles as well as obtaining its ratio to the median, a non-parametric measure of variation like CV, can be computed. Thus, the variability of LSH, PH, IH, INMS, LNL, RLS, RDF and SNI was low while the variability of FWI, DWI, TSW, SY, DF, DSF, SD and IN was high. The results of this non-parametric measure of variation were relatively different from CV values, because it uses only the middle half of the dataset and gives an overview of where most of the values lie and how they are clustered. Also, it is less influenced by extreme values and is useful for skewed statistical distributions. However, there are some other non-parametric measures of the CV (NS1 and NS2) that have been proposed for stability analysis (Sabaghnia, Reference Sabaghnia2015). They use the median as a measure of central tendency and the interquartile and inter-decile ranges as measures of dispersion.
Some descriptive statistics for 31 characteristics of sainfoin genotypes

a SD, standard deviation.
For abbreviations refer to the text.
Traits are: PNA, plant number per area; SNP, stem number per plant; NNMS, node number per main stem; LSH, longest stem height; PH, peduncle height; IH, inflorescence height; INMS, internode number per main stem; DI, distance between internodes; LNMS, leaves number per main stem; LNP, leaves number per plant; LNL, leaflets number per leaf; LNS, leaves number per stem; PPM, per cent of powdery mildew; FWS, fresh weight of stems; FWL, fresh weight of leaves; FWI, fresh weight of inflorescences; DWS, dry weight of stems; DWL, dry weight of leaves; DWI, dry weight of inflorescences; RLS, ratio of dry leaf to dry stem; RDF, ratio of total dry weight to total fresh weight; FY, fresh yield; DY, dry yield; FNI, floret number per inflorescence; SNI, seed number per inflorescence; TSW, thousand seed weight; SY, seed yield; DF, days to flowering; DSF, days to seed filling; SD, stem diameter; and IN, inflorescence number.
Association analysis
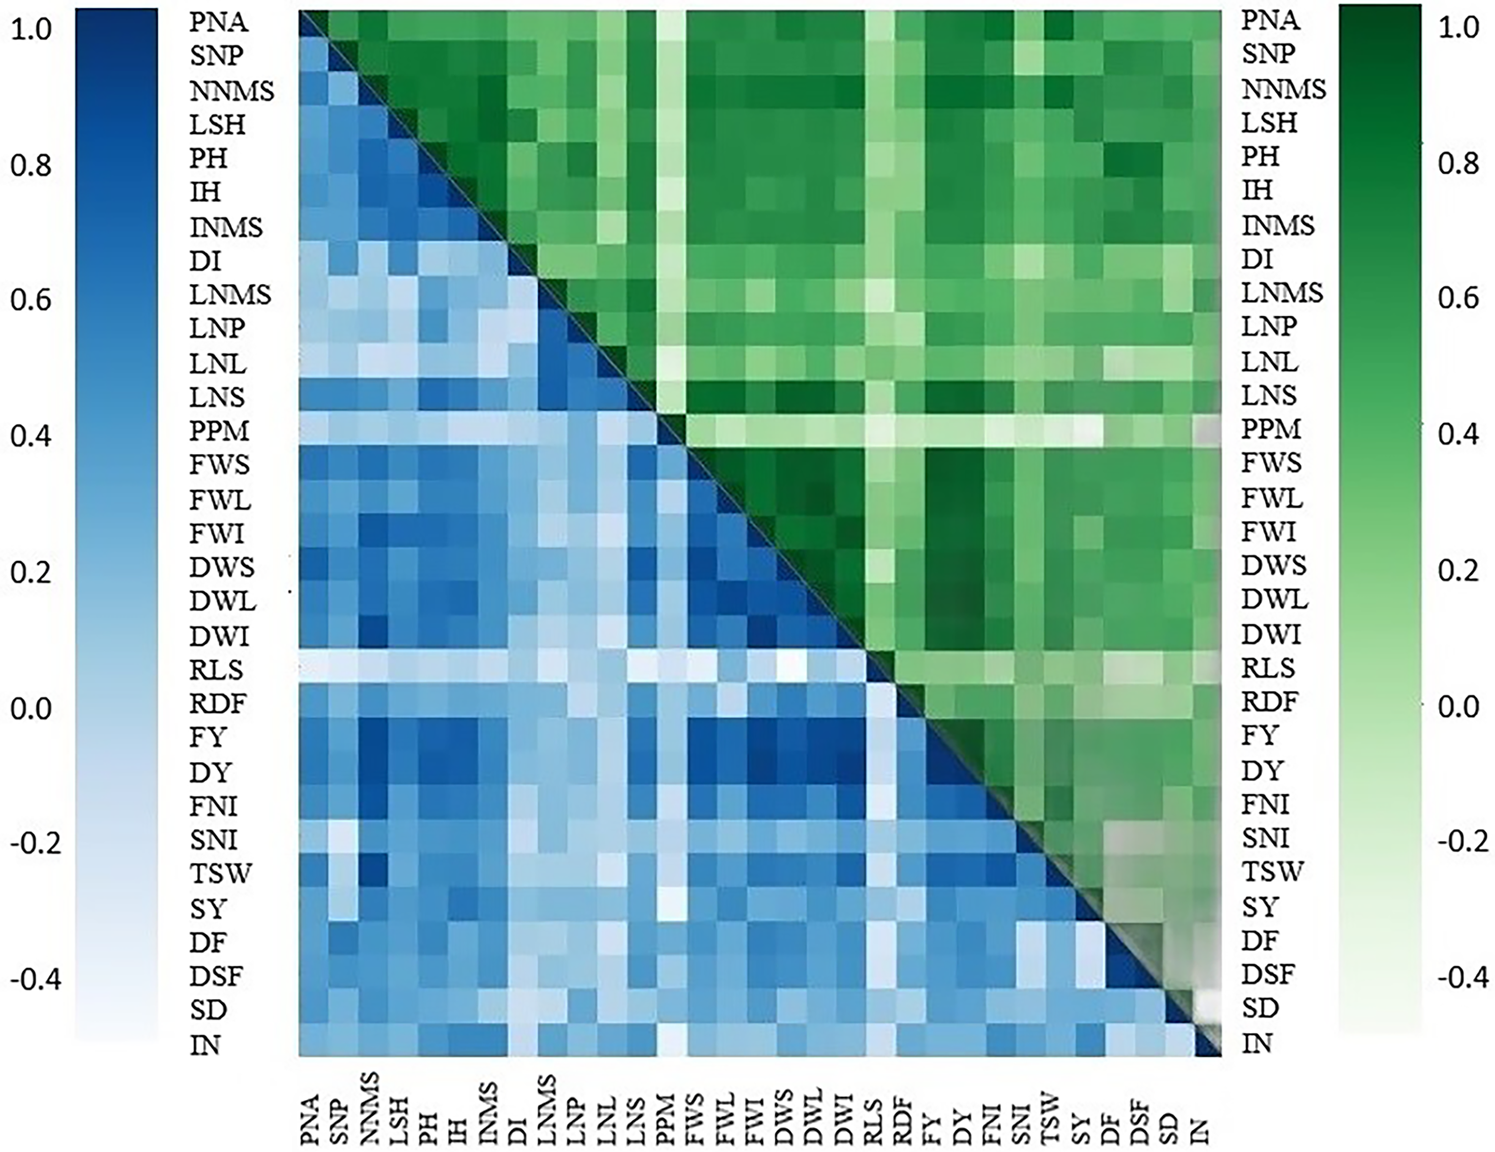
The simple pairwise association coefficients are given in online Supplementary Table S1, and the heatmap graph of association analysis is given in Fig. 2. Dry yield (DY) indicated a positive or negative (P < 0.01 or P < 0.05) relations with all characteristics other than the DI, LNMS, LNP, LNL, PPM, RLS and IN in 2022 while DY indicated a positive/negative association with all characteristics other than the LNMS and LNL in 2023. Seed yield (SY) indicated a positive significant association with PNA, NNMS, LSH, PH, DI, INMS, FWS, FWL, DWL, FY, DY, FNI, SNI, TSW and IN; and a negative association with PPM in 2022. Also, SY indicated a positive/negative association with all characteristics other than the RLS, RDF, DF, DSF and SD in 2023. The results of both years were relatively similar and such low genotype by environment interaction, so the environmental factors could not alter the response of sainfoin landraces, especially in some yield components like number of leaves per stem as well as leaf fresh and dry weight, stem weight and inflorescences weight. In other words, landrace rank and performance do not change significantly in the second year, so the interaction between genotype and environment is relatively small, leading to predictability of performance. Davazdahemami et al. (Reference Davazdahemami, Alizadeh, Jalali and Zeinali2019) reported similar results for a positive association of dry yield performance with PNA, NNMS, DWS, DWL and LNS during the evaluation of genetic variation among 20 sainfoin landraces from central Iran.
Heatmap of simple correlation of 31 characteristics of 32 sainfoin genotypes; up diagonal for 2022 and below diagonal for 2023.

Cluster analysis
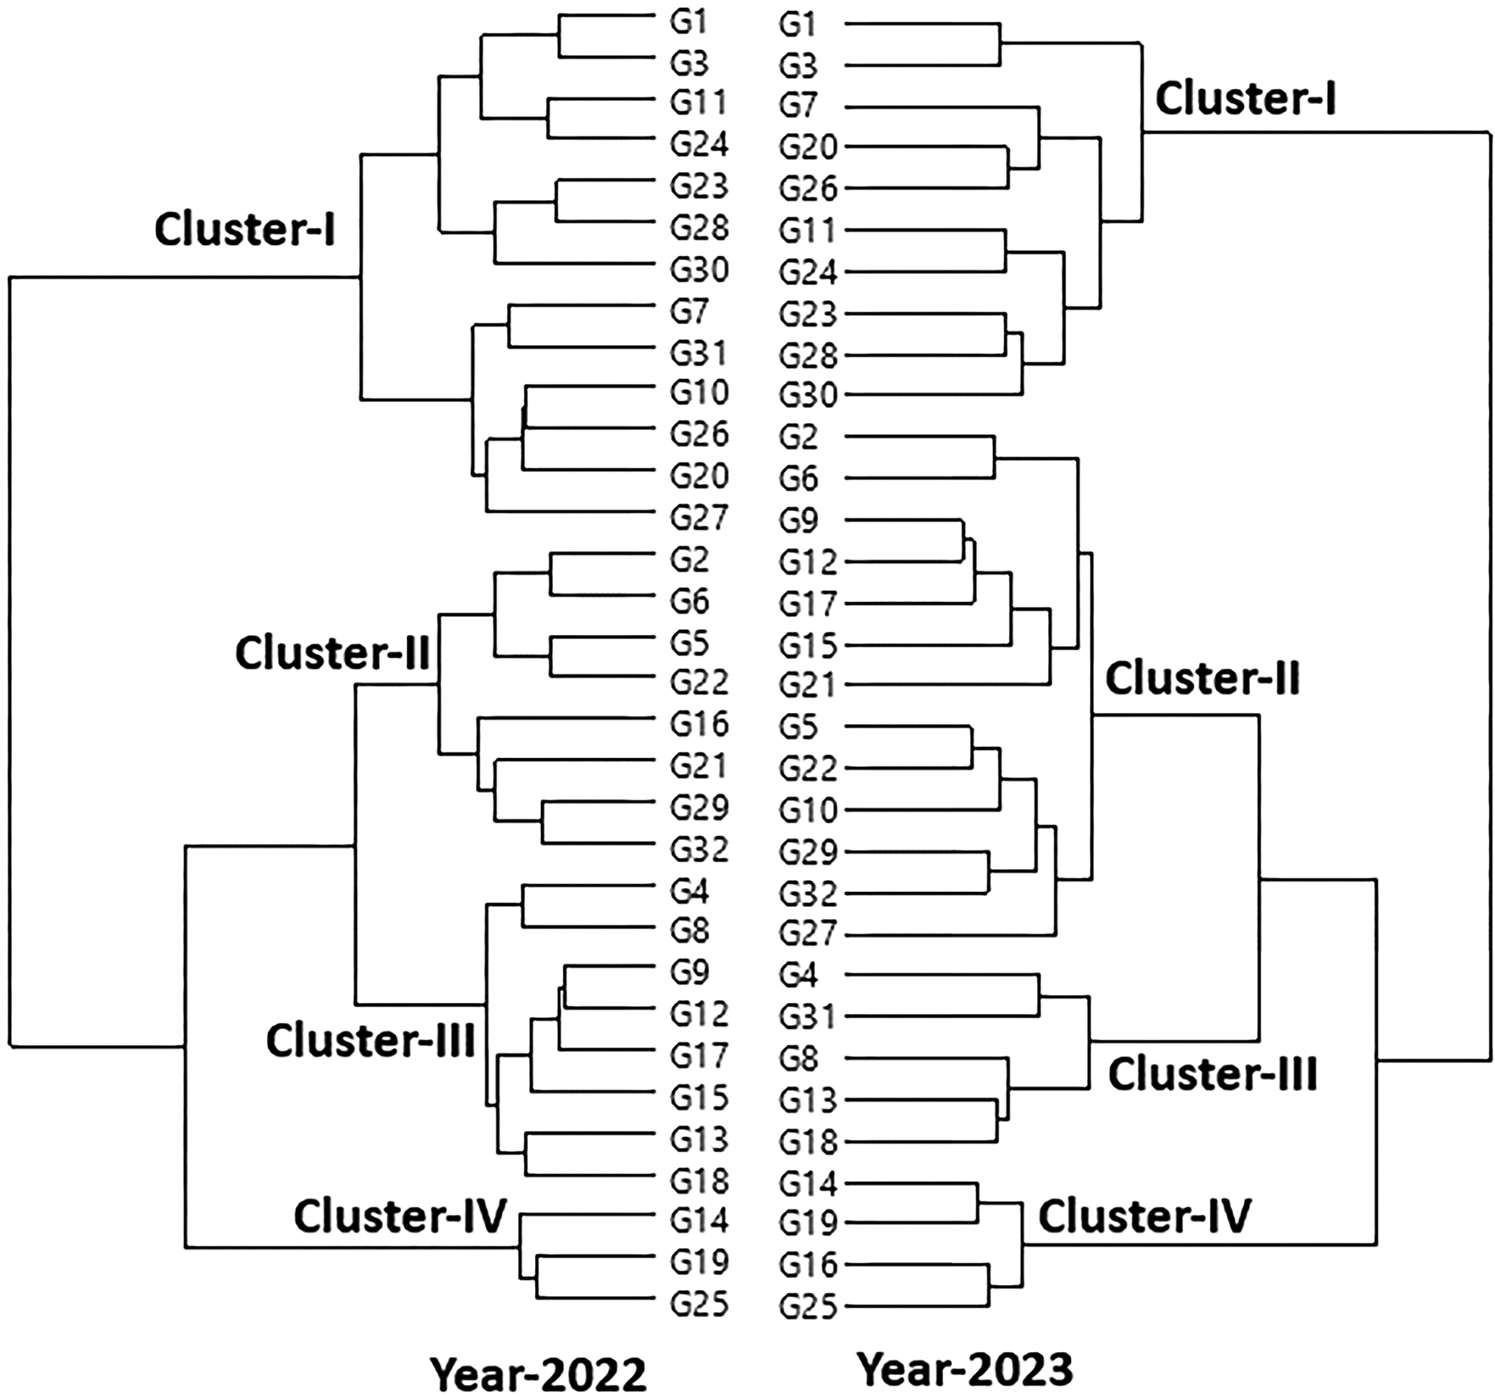
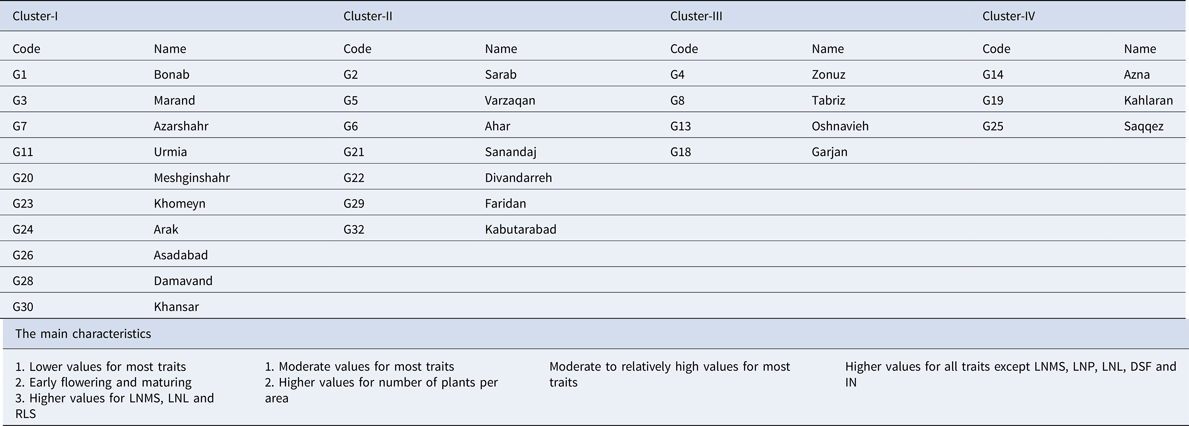
Sainfoin landraces were categorized into four clusters in both years based on clustering (Fig. 3) based on the lambda statistic of Wilks which is derived from multivariate ANOVA. In the year 2022, cluster-I contains 13 landraces and the important features were the lower magnitudes for most of the measured characteristics while cluster-II contains eight landraces and the main properties were moderate (or below averages) for most of the sainfoin's traits (data are not shown). Also, in the year 2022, cluster-III contains eight landraces with relatively moderate or high values for most of the characteristics while cluster-IV contains three landraces and the main properties were the high amounts for most of the sainfoin's traits. In the year 2023, cluster-I contains 10 landraces, and similar to the year 2022, the important features were the low values for most of the measured characteristics while cluster-II contains 13 landraces and the main properties were the low or moderate amounts for most of the sainfoin's traits (data are not shown). Also, in the year 2023, cluster-III contains five landraces with high or moderate values for the characteristics while cluster-IV contains four landraces and the main properties were the high amounts for most of the sainfoin's traits. A comparison of dendrograms in both years indicated that 10 landraces cluster-I (G1, G3, G7, G11, G20, G23, G24, G26, G28 and G30), seven landraces cluster-II (G2, G5, G6, G21, G22, G29 and G32), four landraces cluster-III (G4, G8, G13 and G18) and three landraces cluster-IV (G14, G19 and G25) were clustered in same groups across 2 years. Thus, it can be concluded that the responses of these landraces to yearly conditions were similar and did not show genotype by environment interaction.
Dendrogram of cluster analysis for grouping 32 sainfoin genotypes across 2022 and 2023 years.

Means of clusters
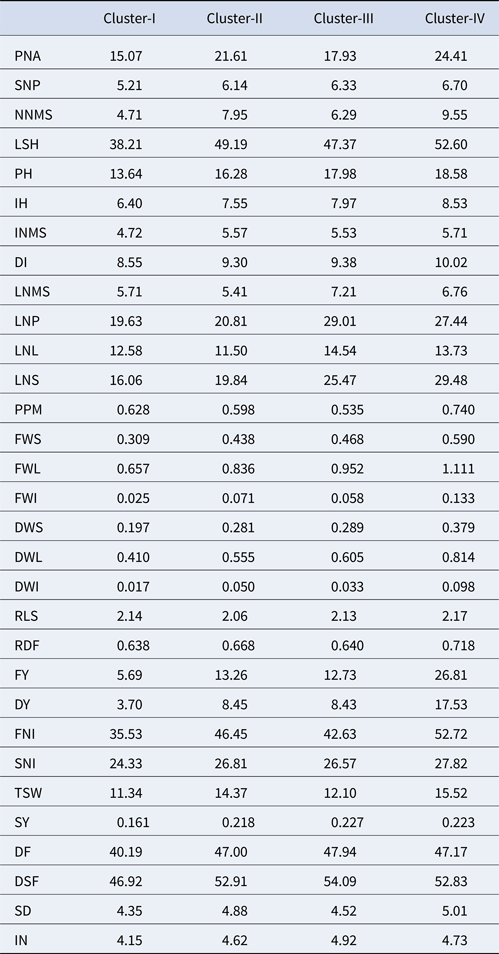
The mean values for common landraces across 2 years (24 landraces) are indicated in Table 5, cluster-I of both years contains 10 common landraces and some of their important features were early flowering and maturing whereas about 40 days to the starting of flowering were needed and about 47 days required to initiate the seed filling. Although, this cluster had lower values for most traits, it indicated higher values than cluster-II for LNMS, LNL and RLS (Table 5). The seven common landraces of cluster-II and four common landraces of cluster-III indicated moderate values for most of sainfoin's traits but the performance of cluster-II was lower than cluster-III (Table 5), while only the number of plants per area in cluster-II was higher than cluster-III. Finally, the three common landraces of cluster-IV (G14, G19 and G25) indicated higher values for measured characteristics of sainfoin except for LNMS, LNP, LNL, DSF and IN (Table 5). Thus, although cluster-IV indicated high-yield performances for forage and seed, its quality properties like the number of leaves per stem and main stem as well as the number of leaflets per leaf were not ideal like cluster-III. Therefore, using landraces of cluster-III and cluster-IV in crossbreeding programmes may result in the breeding of new cultivars with high-yield performance as well as high-quality characteristics. In summary, cluster-I had lower values for most traits, cluster-II and cluster-III had moderate values for most traits while cluster-IV indicated higher values for most measured traits (Table 6), which can be used in genetic improvement projects with various breeding targets.
Mean values of 31 characteristics of sainfoin for four identified clusters across 2 years

Traits are: PNA, plant number per area; SNP, stem number per plant; NNMS, node number per main stem; LSH, longest stem height; PH, peduncle height; IH, inflorescence height; INMS, internode number per main stem; DI, distance between internodes; LNMS, leaves number per main stem; LNP, leaves number per plant; LNL, leaflets number per leaf; LNS, leaves number per stem; PPM, per cent of powdery mildew; FWS, fresh weight of stems; FWL, fresh weight of leaves; FWI, fresh weight of inflorescences; DWS, dry weight of stems; DWL, dry weight of leaves; DWI, dry weight of inflorescences; RLS, ratio of dry leaf to dry stem; RDF, ratio of total dry weight to total fresh weight; FY, fresh yield; DY, dry yield; FNI, floret number per inflorescence; SNI, seed number per inflorescence; TSW, thousand seed weight; SY, seed yield; DF, days to flowering; DSF, days to seed filling; SD, stem diameter; and IN, inflorescence number.
Summary of cluster analysis regarding the most important traits of sainfoin for four identified clusters across 2 years

Traits are: LNMS, leaves number per main stem; LNP, leaves number per plant; LNL, leaflets number per leaf; DSF, days to seed filling; IN, inflorescence number; and RLS, ratio of dry leaf to dry stem.
Discussion
Association of sainfoin characteristics, genetic diversity, some CVs and some genetic properties was assessed for 32 local landraces during 2022 and 2023 according to 31 morphologic characteristics. Considering the characteristics of semi-arid areas and Mediterranean-like climates, where the cessation of precipitation in late spring and the excessive heat of summer negatively affect plant growth, ephemerality can be considered a compromise and intelligent solution to climatic change during the last decades Therefore, the landraces of this cluster can be used as early flowering and early maturing materials for subsequent breeding processes. Also, the first cluster indicated higher values for leaves number per main stem, leaflets number per leaf and ratio of dry leaf to dry stem, so it can be regarded for breeding of these traits. The second and third detected clusters had moderate values for most traits while three genotypes of the fourth cluster (G14 from Azna, G19 from Kahlaran and G25 from Saqqez) indicated higher values for all traits except leaves number per main stem, leaves number per plant, leaflets number per leaf, days to seed filling and inflorescence number; thus, they have good potential for sainfoin genetic improvement programmes involving forage yield performance. The main effects of landraces and years as well as the interaction effect of landraces by year interaction indicated meaningful differences for the majority of the characteristics (Annicchiarico et al., Reference Annicchiarico, Pecetti, Abdelguerfi, Bouizgaren, Carroni, Hayek, M’Hammadi Bouzina and Mezni2011). Therefore, the presence of significant amounts of genetic diversity provides a favourable basis for the selection of superior sainfoin landraces as an effective method in the improvement of forage and grain yield as well as quality characteristics. The significant GY interaction shows that the diversity of sainfoin landraces was affected by abiotic factors like climate and production management strategies, which influence the expression of related genes, and which genes would aid in describing the phenomenon (Rotili et al., Reference Rotili, de Voil, Eyre, Serafin, Aisthorpe, Maddonni and Rodríguez2020). However, more research is needed to identify the details of adaptation and sustainability in target environments. The provision of the mentioned information facilitates the more reasonable selection of native adapted and stable landrace in semi-arid environments and they can be introduced with more certainty for crossbreeding or other proposals in a genetic improvement project such as variety release. Such studies are becoming more challenging due to the harmful influences of climate change which increases the weather variations and increases the genotype by environmental interactions.
The PCV and GCV values were high for some important characteristics like fresh and dry yield of forage and were moderate for the other important characteristics like seed yield. The PCV is an index of variation related to genetic factors as well as environmental influences, while the GCV is an index of variation of a trait due to genetic differences among native breeds (Fufa et al., Reference Fufa, Gedebo, Leta and Lule2024). Our findings showed that the difference between these indices for all characteristics was relatively low, which indicates that the evaluated characteristics of sainfoin characteristics were not much affected by environmental factors and it seems that the major part of the variation is caused by the difference in gene expression.
Similarly, Behrouz et al. (Reference Behrouz, Aharizad S. Mohamadi, Normand Moayed and Hazegh Jafari2010) reported high PCV for forage and seed yield of 36 landraces of sainfoin while the amount of PCV for phonologic traits was relatively low. Hosseini et al. (Reference Hosseini, Majidi and Mirlohi2015) found relatively the same behaviour on some morphologic traits of cocksfoot (Dactylis glomerata L.) genotypes especially for forage yield and its components under normal irrigation conditions. We found high H2BS for almost all of the sainfoin characteristics while the GAM of four characteristics (INMS, RDF, DF and SD) was low. High H2BS with high GAM is a sign of additive behaviour of gene effect, so high genetic gain from selection would be expected. Our findings about H2BS and GAM of the fresh and dry yield of forage as well as the ratio of leaf to stem seem to be consistent with other research such as Toorchi et al. (Reference Toorchi, Aharizad, Moghaddam, Etedali and Tabatabavakil2007) who worked on genetic parameters of sainfoin landraces in a relatively similar agro-climate zone.
The Pearson associations indicated that the dry forage yield had a significant relation with most of the characteristics in both years. Association between characteristics has particular importance in breeding efforts, because it determines the amount and type of relationships between two or more traits. In other words, by determining the relationships between different traits, especially between target traits such as yield performance and its components, plant breeders have the opportunity to select the optimal combination of components that will result in higher yield. Some studies indicate that a higher stem-to-leaf ratio is not recommended due to the nature of the stem structure in sainfoin and its textural changes during the growing season, as well as lower palatability and lower nutrient content in the final harvest/grazing quality (Wang et al., Reference Wang, McAllister and Acharya2015; Vasileva et al., Reference Vasileva, Naydenova and Stoycheva2019), while the palatability is not measured based on the animal response; but it is affected by various traits including; sugar content, tannin chemistry and content, nitrogen/protein content, steminess/leaf to stem ratio, etc. The previous studies conducted in the relatively drier climates of the middle regions of Iran have indicated that selecting the high numbers of stems, branches, nodes and leaves, as well as the higher dry weight of stems and leaves, will result in a higher yield of sainfoin. The positive correlation between the number of stems and leaves shows that the forage quality did not decrease with the increase in the number of stems while according to Zarabiyan et al. (Reference Zarabiyan, Majidi and Bahrami2015), a remarkable negative association was seen between stem and leaf percentages, which indicates the inverse relationship between these two functional components, but this research could not confirm this finding. Also, Badieh et al. (Reference Badieh, Hejazi, Aghdaei, Naghavi and Jafari2013) reported a positive association between the dry yield of sainfoin and feed value properties, so genotypes with higher dry yield will indicate good feed value properties. Thus, increasing yield performance would not decrease the forage quality and breeders can emphasize yield performance.
Since the studied sainfoin landraces may have a great genetic diversity in terms of different characteristics, such as seeding establishment, morphophysiological traits and growth rate, it does not seem reasonable to decide to select a landrace based on one trait (Wijekoon et al., Reference Wijekoon, Acharya, Siow, Sura, Thandapilly and Sabra2021). Therefore, in addition to using the relationship between features, multivariate cluster analysis can be used as an efficient solution to select the best clusters. The grouping of traits showed that there was a high diversity among the studied populations in terms of morphological characteristics. Based on the performed clustering, the studied landraces were divided into four separate groups in both years. Native sainfoin landraces in cluster-I showed the weakest performance for most of the assessed traits and had a significantly lower forage yield compared to the other three clusters. Therefore, the native landraces in cluster-I can be used in breeding programmes and cultivar selection to produce cultivars with early flowering, earlier maturity and more resistance to powdery mildew in the drought porn region due to their favourable genetic potential. Hence, the cluster-I landraces can be used in breeding programmes and selection to produce landraces with early flowering and maturity, and landraces that are resistant to powdery mildew. The performances of sainfoin landraces in cluster-II and cluster-III were moderate amounts for most characteristics, and as a result, they had moderate forage, so these clusters can be used in breeding programmes and selection to produce landraces with early flowering and maturity characteristics as well as tolerant landraces to powdery mildew disease, whereas it can still potentially participate in breeding processes that improve agricultural characteristics. However, the number of plants per area in the second cluster was high in the second cluster while the number of leaves per stem and main stem as well as the number of leaflets per leaf were high in the third cluster. The sainfoin landraces of cluster-IV had the highest values for most characteristics and showed higher forage yield than the landraces of the other three clusters. Therefore, cluster-I landraces can be used in breeding programmes and selection to produce landraces with desirable characteristics. Also, since there is a large genetic distance among some landraces, this study can help plant breeders identify the most distant parents for crossing and producing synthetic cultivars (Caradus et al., Reference Caradus, Voisey, Cousin, Kaur, Woodfield, Blanc and Roldan2022). Also, to create special populations such as mapping populations, crossing of distant parents with a large genetic distance can be useful. Most of the characteristics indicated a positive significant relation with forage performance as well as seed yield showing that increasing either one or more characteristics could produce high performance. This indicates that in this crop, the relationship between the source and sink and the allocation, translocation and partitioning of photo-assimilates between reproductive and vegetative organs should be specially considered in breeding processes. Early partitioning of photo-assimilate sources from leaves and vegetative organs for the seed set process can reduce the yield and forage quality. Further investigation is required to assess these and additional characteristics under various environments to obtain their adaptability for use in future genetic improvement projects.
Supplementary material
The supplementary material for this article can be found at https://doi.org/10.1017/S1479262125000048
Author contributions
Naser Sabaghnia designed, analysed and wrote manuscript; Farid Normand Moayed collocated plant materials; Amin Ahadnezhad performed experiments and measured traits; Mohsen Janmohammdi read and checked manuscript.
Funding statement
This study was supported by the University of Maragheh.
Competing interests
None.
Ethical standards
No human or animals were used in the present research.
Consent for publications
All authors read and approved the final manuscript for publication.
Availability of data and material
All the data are embedded in the manuscript.
Informed consent
The authors declare not to use any patients in this research.