Infectious diseases are continuously the most troubling issues in dairy cows (Burvenich et al. Reference Burvenich, Van Merris, Mehrzad, Diez-Fraile and Duchateau2003), of which outcome largely relies on the innate immune defence of the animal (Paape et al. Reference Paape, Mehrzad, Zhao, Detilleux and Burvenich2002; Mehrzad et al. Reference Mehrzad, Duchateau and Burvenich2004, Reference Mehrzad, Duchateau and Burvenich2005). T cells play a central role in cellular and humoural immunity; they contribute to the maintenance of immune homeostasis of the host (Gao & Jakobson, Reference Gao and Jakobsen2000; Plowden et al. Reference Plowden, Renshaw-Hoelscher, Engleman, Katz and Sambhara2004a, Reference Plowden, Renshaw-Hoelscher, Gangappa, Engleman, Katz and Sambharab). On the basis of specialized cell markers on their surface, bovine T cells are composed of a variety of subpopulations such as CD2+ (pan T cells), CD4+ T helper (Th) cells, CD8+ cytotoxic T cells, γ/δ T cells and memory T cells (Machugh et al. Reference Machugh, Mburu, Carol, Wyatt, Orden and Davis1997; Asai et al. Reference Asai, Kai, Rikiishi, Sugawara, Maruyama, Yamaguchi, Ohta and Kumagai1998). Furthermore, CD8+ cells have been defined as both cytotoxic and suppressor T cells (Van Kampen et al. Reference Van Kampen, Mallard and Wilkie1999; Harp et al. Reference Harp, Waters and Goff2004). Cytotoxic T cells produce interferon-gamma (IFN-γ), whereas suppressor T cells produce interleukin (IL)-4, IL-5 and IL-10 (Salgame et al. Reference Salgame, Abrams, Clayberger, Goldstein, Gonvit, Modlin and Bloom1991). CD8+ cells, for example in mice, can also be divided into T cytotoxic (Tc)1 cells that often produce IFN-γ and IL-2, and Tc2 cells that secrete IL-4, IL-5, IL-6 and IL-10 (Croft et al. Reference Croft, Carter, Swain and Dutton1994; Sad et al. Reference Sad, Marcotte and Mosmann1995). Bovine CD8+ cells are predominantly extravascular T cells and preferentially traffic to the tissue in healthy cows (Asai et al. Reference Asai, Kai, Rikiishi, Sugawara, Maruyama, Yamaguchi, Ohta and Kumagai1998; Harp et al. Reference Harp, Waters and Goff2004; Mehrzad et al. Reference Mehrzad, Janssen, Duchateau and Burvenich2008), emphasizing a potential role of CD8+ T cells in the maintenance of the integrity of the tissue via rapid removal of pathogens and infected cells (Smith et al. Reference Smith, Kreeger, Alvarez, Goin, Davis, Whipple and Estes1999; Patton et al. Reference Patton, McGuire, Fraser and Hines2004). In the presence of pathogens CD8+ cell trafficking is prompted via, for example, IFN-γ, CD4+ and CD21+ cells (Park et al. Reference Park, Fox, Hamilton and Davis1992; Riollet et al. Reference Riollet, Rainard and Poutrel2000), further contributing to the maintenance of immune homeostasis. Nonetheless, a balanced CD4+/CD8+ ratio in the blood circulation is critical to maintain the immune homeostasis in the host.
During infection or antigenic stimulation, lymphoproliferation is crucial in accumulation of immune cells and in maintenance of immune protection and immune homeostasis to effectively combat pathogens (Wells et al. Reference Wells, Gudmundsdottir and Turka1997; Bird et al. Reference Bird, Brown, Mullen, Moskowitz, Mahowald, Sider, Gajewski, Wang and Reiner1998). For example, during the early immune response of mammary gland to bacterial pathogens the elevated T cells in the gland mainly result from the increase in activated CD8+ cells (Asai et al. Reference Asai, Kai, Rikiishi, Sugawara, Maruyama, Yamaguchi, Ohta and Kumagai1998; Mehrzad et al. Reference Mehrzad, Janssen, Duchateau and Burvenich2008). In blood circulation it can be different. A decreased proportion of CD8+ cells in blood may lead to immune dysfunction (Wolkers et al. Reference Wolkers, Brouwenstijn, Bakker, Toebes and Schumacher2004). The immune dysfunction not only increases susceptibility to new infection but also allows subclinical infections such as salmonellosis, paratuberculosis, mastitis, metritis and laminitis to become clinical (Kimura et al. Reference Kimura, Goff, Kehrli and Harp1999; Smith et al. Reference Smith, Kreeger, Alvarez, Goin, Davis, Whipple and Estes1999; Burvenich et al. Reference Burvenich, Van Merris, Mehrzad, Diez-Fraile and Duchateau2003; Mehrzad et al. Reference Mehrzad, Duchateau and Burvenich2004, Reference Mehrzad, Duchateau and Burvenich2005). Pluriparous dairy cows are more vulnerable to infectious diseases and the responses to the pathogens are more likely to be slower and weaker than in primiparous cows (Mehrzad et al. Reference Mehrzad, Duchateau, Pyörälä and Burvenich2002; Burvenich et al. Reference Burvenich, Van Merris, Mehrzad, Diez-Fraile and Duchateau2003), suggesting an age or parity-related delay in clearance of pathogen. The underlying reason for the more pronounced immunosuppression in pluriparous cows is not fully known. The age-associated reduced response to preventive vaccination is accompanied by an inefficient T cell response, particularly of CD8+ T cells (Plowden et al. Reference Plowden, Renshaw-Hoelscher, Engleman, Katz and Sambhara2004a, Reference Plowden, Renshaw-Hoelscher, Gangappa, Engleman, Katz and Sambharab) and CD4+/CD8+ imbalance.
Retrospectively, there have been no investigations on the issue of ‘concentration and proliferation of T cell subsets v. parity’ in lactating cows. Therefore, study of how parity or aging affects proliferation of T cells and concentrations of CD2+, CD4+, CD8+ and the CD4+/CD8+ ratio in blood circulation might shed fresh light on the complex immune defence mechanism of high-yielding dairy cows.
An assay to assess lymphocyte function is important for evaluating the immune status and immune mechanism of the animals. One of the important parameters for evaluation of lymphocyte functionality is proliferation assay. Traditionally, researchers have used radioactive materials to assess proliferation of bovine blood lymphocytes (Concha et al. Reference Concha, Hu and Holmberg1996; Mehrzad et al. Reference Mehrzad, Janssen, Duchateau and Burvenich2008) but these methods give only limited information about lymphocyte division or proliferation, and are highly unsafe when safety measures are inappropriately implemented. Alternatively, there is a safer and more informative and reproducible method to quantify lymphocyte proliferation capacity, but it has rarely been used in dairy cows (Sathiyaseelan & Baldwin, Reference Sathiyaseelan and Baldwin2000). Using a flow cytometry technique an essentially useful method was adapted on the proliferation assessment of bovine blood T cells. Not only would our study help better understand the complex immunobiological mechanisms in primiparous and pluriparous high-yielding dairy cows, it would also put new emphasis on further use of this method in animal and veterinary science.
The objectives of this study therefore were (1) to evaluate the impact of parity or age on T cell proliferative capacity and T cell subsets (CD2+, CD4+ and CD8+) in blood of lactating cows and (2) to comparatively describe and validate an alternative method of measuring bovine lymphocyte proliferation capacity.
Materials and Methods
Animals and experimental plan
A total of 26 Holstein cows were used at the experimental dairy farm of McGill University. The animals were on a system of zero-grazing and put in an individual stall. They were fed with a typical ration for lactation on the farm and always had free access to water and hay. The monthly assessment of farm records (individual cows) indicated that the animals were free from any reproductive abnormality and from any pathogens that cause intramammary infections. The experimental cows were housed on the McGill farm for their entire life and all clinical history had been recorded throughout their life accordingly. The study was approved by the McGill University Animal Care Committee. The selected cows were in their 1st to 6th lactation, clinically healthy, free from parasitic diseases, were not vaccinated and showed no sign of typical periparturient diseases after calving and during lactation. The cows were divided into two groups, and their ages were combined as follows: primiparous (young) cows (first gestation, 2·4±0·5 years, n=13) and pluriparous cows (forth to sixth gestation, 6·8±0·7 years, n=13). Selection of the cows for this experiment was based on following criteria: (1) no history of clinical mastitis and other diseases and quarter SCC <2×10⁵ cells/ml and (2) they all were in their mid–late lactation (225±68 d of lactation with average milk production of 29±2·2 l/d in primiparous and 196±58 d of lactation with average milk production of 40·5±2·4 l/d in pluriparous cows). Blood samples (20 ml) were aseptically collected from the tail vein into evacuated tubes (BD-Vacutainer System, Oakville, Ontario, Canada) containing 125 IU heparin for further processing. In a separate study blood samples from 40 cows were used to assess the correlation between a lymphocyte proliferation assay by flow cytometry and by a commonly used method, 3H-thymidine uptake.
Blood lymphocyte preparation, enumeration and differentiation
Bovine lymphocytes were isolated from blood as described by Mehrzad et al. (Reference Mehrzad, Janssen, Duchateau and Burvenich2008) with slight modifications. Briefly, blood was diluted in 1:5 with Hank's salt saline solution (HBSS, Invitrogen) without Mg++, Ca++ and phenol red, and layered onto a 10-ml Ficoll-Plaque plus (Amersham Bioscience, Oakville, Ontario, Canada). After centrifuging at 900 g at 4°C for 30 min, the layer of lymphocytes was collected. The purified peripheral blood mononuclear cells (PBMC) were washed once (450 g at 4°C for 10 min) with washing solution containing 98% HBSS, 1% penicillin/streptomycin (P/S) and 1% inactivated fetal calf serum (FCS). The pellets were resuspended and washed (180 g at 4°C for 10 min) twice with incomplete RPMI (RPMI 1640, 10% inactivated FCS, 1% P/S (100 IU penicillin), 1% kanamycine, 1% gentamycine) and finally washed with complete RPMI (RPMI 1640, 10% inactivated FCS, 1% P/S, 1% kanamycine, 1% gentamycine, 1% l-glutamine, 1% non essential amino acid, 1% sodium pyruvate and 1 μl/ml β-mercaptoethanol). Differential cell counts and staining procedures were performed on the isolates on eosin-giemsa-stained smears, using light microscopy (Mehrzad et al. Reference Mehrzad, Dosogne, Meyer, Heyneman and Burvenich2001). The total number of leucocytes and isolated blood cells were determined using an electronic particle counter (Mehrzad et al. Reference Mehrzad, Dosogne, Meyer, Heyneman and Burvenich2001).
The viability of isolated lymphocytes from blood was determined in duplicate by means of flow cytometry, using propidium iodide exclusion (Mehrzad et al. Reference Mehrzad, Dosogne, Meyer, Heyneman and Burvenich2001, Reference Mehrzad, Duchateau and Burvenich2004, Reference Mehrzad, Janssen, Duchateau and Burvenich2008); this gave >98% viable lymphocytes. To choose the best incubation in terms of having the highest viable lymphocytes the viability of lymphocytes was further checked at 3 d and 6 d after incubation with fluorescent and mitogen reagents. Based on the preliminary results, the percentage of death lymphocytes at 3 d and 6 d after incubation with carboxyfluorescein diacetate succinimidyl ester (CFDASE; molecular probes) and concanavalin A (ConA) was about 8% and 44%, respectively. Because of this high percentage of death lymphocytes at the longer incubation period, in this study we chose 3 d of incubation for lymphoproliferation assay. The isolated blood cells from each sample were finally used both for lymphocyte proliferation and quantification of T cell subpopulations. Indeed, the samples were exactly the same, but the assay was done separately.
Lymphocyte proliferation assay by CFDASE
After isolation of PBMC, proliferation of T lymphocyte subsets was evaluated using flow cytometry. Lymphocyte proliferation assay was conducted in flat-bottom 24-well tissue culture plates. To do this, 1000 μl of complete RPMI 1640 (RPMI 1640, 20% FCS, 1% P/S, 1% gentamycine, 1% kanamycine, 1% l-glutamine, 1% non-essential amino acids, β-mercaptoethanol (50 μl/ml), containing 1×10⁶ viable lymphocytes was added per well in triplicate. The main labelling reagent in this technique was CFDASE. CFDASE passively diffuses into the PBMC and yields a highly fluorescent green; the final concentration of CFDASE was 5 μm. The 1×10⁶ viable PBMC was cultured. The proliferation capacity on day 0 of cell culture was compared with that on day 3 of the cell culture.
For lymphocyte proliferation capacity, cells were incubated under four different conditions: (1) medium alone (2) ConA in a final concentration of 5 μg/ml for the mitogen-induced proliferation of the T cells (3) LPS in a final concentration of 2 μg/ml for the B cells and (4) pokeweed (PW) in a final concentration of 1 μg/ml for both T and B cells. The cells were incubated in humidified air containing 5% CO2 at 37°C for 72 h. After incubation, the cells were washed with HBSS (180 g at 4°C for 10 min) and immediately measured using a flow cytometer (FACS BD). Ten thousand events per sample were collected for blood lymphocyte proliferation. The results were analysed using the specific software (ModFit LT 3.0 Proliferation Wizard, Topsham ME, USA). Results were expressed as proliferation index and number of cell generations during three days of incubation. The proliferation index is the sum of the cells in all new generations divided by the computed number of original parent cells theoretically present at the start of the experiment. It is a measure of the increase in cell number in the culture over the course of the experiment. Results of proliferation assays were expressed as fluorescence intensity and number of specific T cells. For lymphocyte proliferation capacity assay, after stimulation with different stimulators, four numbers of the lymphocyte generations and/or divisions were calculated. Not only the overall lymphoproliferation capacity but also the maximal population of lymphocytes dividing into new generation at generation 3 was compared between primiparous and pluriparous cows; according to the software and formula used, the more the lymphocytes dividing into new generation at e.g., third generation, the less frequency of the precursors will be.
To investigate the relationship between proliferation results from CFDASE with FCM (explained above) and those from a widely used 3H-thymidine scintillation assay with scintillation counter (Betaplate reader, Wallac, Baie D'Urfe, Quebec, Canada), the lymphocyte proliferation assay with 3H-thymidine uptake was conducted in flat-bottom, 96-well tissue culture plates. Briefly, 100 μl of complete RPMI 1640, containing 2·5×105 viable lymphocytes was added per well in triplicate with the following test media: 100 μl RPMI 1640 containing ConA in a final concentration of 5 μg/ml for the mitogen-induced proliferation and 100 μl medium as a negative control. The total volume of each well was always 200 μl. The lymphocytes were incubated at 37°C in 5% CO2 for 48 h; after 48 h, the wells were pulsed with 0·037 Mbq (1 μCi) 3H-thymidine per well and incubated for an additional 18 h. The cells were harvested onto Skatron filter mats Combi cell harvester (Wallac) using a multiple-well cell harvester. With scintillation counting of harvested cells, the thymidine uptake was measured using a Betaplate reader. The proliferation indices (PI) from CFDASE were simultaneously compared with the scintillation indices (SI) from Betaplate reader. Results of SI were geometric means of counts per min (cpm) of ConA stimulated cells divided by the geometric mean of cpm of non-stimulated cells (cells cultured without ConA) grown in the presence of complete RPMI medium. The Spearman correlation coefficient was used to assess the correlation between PI and SI.
Quantification of CD4+, CD8+ and CD2+ cells by flow cytometry
Simultaneously, three-colours flow cytometric analysis was performed for the samples as follows: 1×10⁶ cells/ml were incubated with 10 μl of 1/10 diluted flurochromic conjugated antibodies against cell surface markers such as CD4+, CD8+ and CD2+ molecules for 30 min at 37°C in the dark. The antibodies against CD4, CD8 and CD2 were conjugated with Alexa Flour 647, phycoerythrin (PE) and fluorescein isothiocyanate (FITC), respectively (Serotec, Raleigh NC, USA); these conjugated antibodies were mouse IgG2a anti-bovine CD antigens, and were used for triple fluorescence evaluation. After incubation, the cells were washed twice (180 g at 4°C for 10 min) and resuspended with 1 ml of HBSS and immediately analysed using a flow cytometer (FACS BD, Aria CA, USA). All events measured during 40 s with a minimum of 10 000 events were acquired for each sample. Data for lymphocyte subsets were presented as the percentage of the total PBMC population expressing each of the subset markers.
The portion of lymphoid cells recovered was determined by forward scatter and side scatter gating, which excluded possible dead cells, clump and debris. The lymphocyte gate was also checked using the Leukogate reagent from Becton Dickinson. The positive staining was calculated based on the subpopulation-control specimens. Apart from checking the lymphocyte gate using the Leukogate reagent, throughout the experiment, unlabelled and single-labelled conjugated mAb were also used, separately, for CD4+, CD8+ and CD2+ subsets in all batches of lymphocyte samples. The labelling efficiency for each individual phenotype exceeded 99%. For the subpopulation control specimens one sample was only cells and the other sample was cells with single fluorochrome-labelled mAb. In the three-colour FCM, all data files were further analysed with Cell Quest software (Becton Dickinson) according to the control specimens. In this way, the fluorescence compensation would simply be achieved using single fluorochrome-labelled sample before acquisition/analysis. Marker placement or determination of the percentage of positive cells for comparison was established by placing the marker outside the upper limit of background fluorescence. The conjugated monoclonal antibodies used in this study included antibodies recognizing bovine T cell CD4+/CD8−, CD4−/CD8+ and CD2+ cells.
Statistical analyses
The PROC MIXED procedure of SAS version 9.1 was used to analyse the parameters measured. In the current study the experimental unit was cow. To compare the two groups (primiparous and pluriparous) with regard to parameters examined in blood, a mixed model was used, with cow as a random effect and age/parity, measured parameters and their interactions as categorical fixed effects. The measured parameters/values in the two groups were compared using Bonferroni's multiple comparison procedure with an overall type I error equal to 0·05. Statistical differences of the measured parameters between the two groups were considered significant at P<0·05. Data were presented as means±sem. To analyse the correlation between proliferation index and SI, Spearman correlation coefficient was set for this analysis. It was further tested whether this correlation coefficient was significantly different from zero.
Results
Lymphocyte proliferative response in blood of primiparous and pluriparous cows
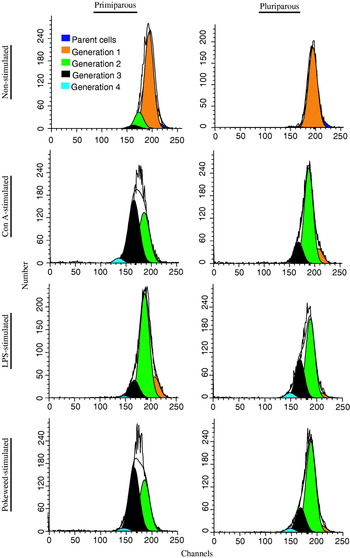
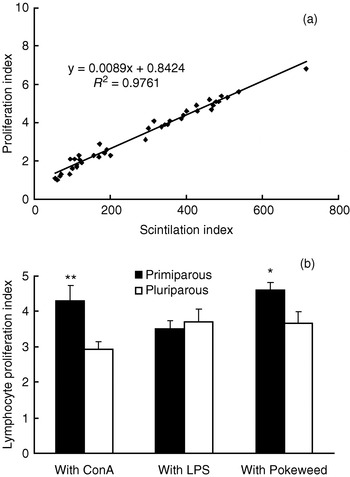
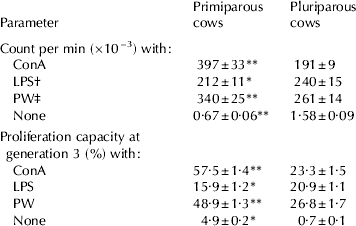
The proliferation results are shown in Table 1, Figs 1 and 2. In primiparous and pluriparous cows, there was a significant difference in proliferative response of lymphocytes. Indeed, the cpm of non-stimulated, ConA-stimulated and PW-stimulated lymphocytes in primiparous cows was much greater than in pluriparous ones. Compared with the other stimulants, the LPS-induced proliferation of lymphocytes was lower in primparous cows (Table 1). Of four divisions or generations of lymphocytes during the lymphoproliferation assay with flow cytometry using CFDASE, percentage of lymphocytes dividing into a new generation at generation 3 appeared interestingly different (Table 1, Fig. 1). Both with ConA and PW the maximal lymphocyte proliferation capacity at generation 3 was greater (P<0·01; Table 1) in primiparous cows than in pluriparous cows. Conversely, for LPS the proliferation capacity at generation 3 in primiparous cows was lower (P<0·05) than pluriparous cows. Overall, the T lymphocyte proliferative capacity was more functional in primiparous cows in comparison with pluriparous cows. Figure 1 shows typically representative lymphocyte proliferation results of flow cytometric analysis of lymphocyte division in primiparous and pluriparous cows in populations of CFDASE-labelled lymphocytes gated in the FS-SS cytogram. Maximal lymphocyte division was observed in primiparous cows with ConA; the same trend was observed with PW in primiparous cows. However, the minimal T lymphocyte division was observed in pluriparous cows with ConA (see Fig. 1 and Fig. 2b). There was a significantly higher (P<0·01) proliferation capacity of lymphocytes with ConA in primiparous cows than in pluriparous cows (Fig. 2b). The Spearman correlation coefficient showed that there was a significant positive correlation between PI and SI (R 2=0·97; P=0·0001; n=40; Fig. 2a).
Representative results of flow cytometric analysis of lymphocyte division of primiparous and pluriparous cows in populations of CFDASE-labelled lymphocytes gated in the FS-SS cytogram. The lymphocytes were labelled with CFDASE and cultured with mitogen-induced reagents (ConA, LPS and PW) and without mitogen for 72 h of incubation. Horizontal and vertical axes denote intensity of CFDASE fluorescence and number of events, respectively. The more division (proliferation index) the more the shift to the left. Different colours represent number of generation or division with different peaks. Maximal lymphocyte division can be observed in primiparous cows with ConA as well as with PW. This is specifically typical at generation 3 of proliferation assay (black colour).

Panel (a) is the Spearman correlation coefficient between ConA-induced proliferation assay by CFDASE with flow cytometry and by classical tritiated-thymidine incorporation (3H-thymidine scintillation assay with scintillation counter). There is a significant correlation between these two parameters (R 2=0·97; P=0·0001; n=40). Panel (b) is the proliferation index using CFDASE with flow cytometry of blood lymphocytes stimulated with ConA, LPS and PW in lactating primiparous and pluriparous cows. Comparison is between primiparous and pluriparous cows. Bars represent means and sem of 13 cows. The level of significance is indicated with asterisks (*P<0·05; **P<0·01).

Mitogen-induced proliferation capacity of blood lymphocytes after activation with/without different mitogens by scintillation counter (overall count per min) and by flow cytometry using CFDASE (% of lymphocytes capable of producing new generation at generation 3) of proliferation assay. Comparison is between primiparous and pluriparous cows. Values are means and sem for 13 cows in each group
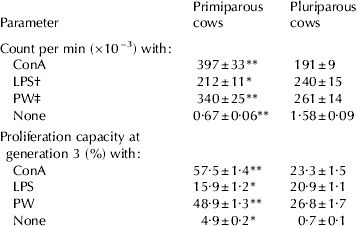
† Lipopolysaccharide
‡ Pokeweed
* P<0·05; ** P<0·01
Concentration of CD4+, CD8+ and CD2+ and the ratio of CD4+/CD8+ in blood of primiparous and pluriparous cows
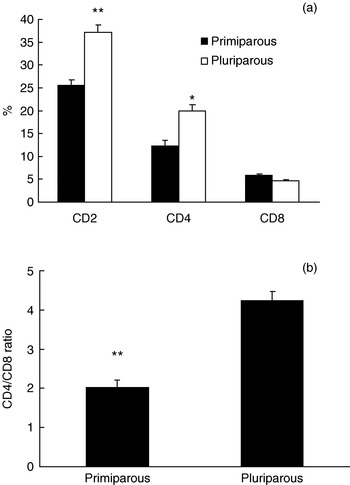
Flow cytometry using anti-CD2 mAb revealed that the percentage of total T (CD2+) cells in the blood of pluriparous cows was significantly higher (P<0·01) than primiparous cows (Fig. 3a). Although the concentration of CD8+ cells in pluriparous cows was slightly lower than in primiparous cows, the concentration of CD4+ cells in isolated blood lymphocytes was significantly greater in pluriparous cows (P<0·05; Fig. 3a). As shown in Fig. 3b, a significant increase (P<0·01) of the CD4+/CD8+ ratio in pluriparous cows was observed. This was primarily due to a selective increase of CD4+ T cells and slight decrease in CD8+ T cells in peripheral blood of pluriparous cows (Fig. 3a).
Panel (a) is the percentage of CD2+ T, CD4+ T and CD8+ T cells in blood of lactating primiparous and pluriparous cows. Panel (b) is the CD4+:CD8+ ratio in blood lymphocyte populations in lactating primiparous and pluriparous cows. Comparison is between primiparous and pluriparous cows. Bars represent means and sem of 13 cows. The level of significance is indicated with asterisks (*P<0·05; **P<0·01).

Discussion
Our understanding of the bovine immune system has been greatly enhanced by the inexorable advance in immunobiology and by the availability of many monoclonal antibodies reactive with various lymphocyte subsets. The present study compared the proliferation capacity of T lymphocytes and relative concentrations of CD4+ and CD8+ cells, that are MHC-dependent T cells, in the peripheral blood of a group of young (primiparous) cows and a group of much older (pluriparous) cows from the same herd and lactation stages. In addition, an alternative non-radioisotopic method of measuring T lymphocyte proliferation was described in more informative detail. Based upon the results of the current study, it appears that during the same lactation stage bovine blood T cells contained different amounts of CD2+ (total T cells), CD4+ (helper) and CD8+ (suppressor/cytotoxic) subsets when their ages differed, and there is a noticeable CD4+-CD8+ imbalance in aging dairy cows. This may reflect the capacity of the immune system to respond to the stimuli and pathogens; we therefore used different lymphocyte stimulators to further pinpoint the lymphocyte response to stimuli. The involvement of a direct effect of vaccination and clinical disorders on the assay can be excluded because the experimental animals were clinically healthy and were not vaccinated after calving and during lactation.
The reason for focusing on the 3rd generation, to our best knowledge, is to highlight the fact that during later generation the dividing T cells are more responsive to antigens; it is also indicative for the quality of parent lymphocytes; in other words, the more generative at later generation (e.g., at 3rd generation), the higher quality of parent lymphocytes. Our data, therefore, suggest decreased quality of parent lymphocytes in blood circulation of pluriparous cows.
The proliferation assay of lymphocytes used in our study was a simple, rapid, accurate and reproducible method for evaluating bovine lymphoproliferation activity; the measurement time takes only less than a minute and no radioactive materials are required. These key advantages, therefore, make the proliferation assay with flow cytometry using CFDASE an elegant method to explore specific immune defence mechanism of dairy cows.
In this assay a very easily applicable dye, CFDASE, was used; this dye has also been used in some other studies in the bovine (Hansson et al. Reference Hansson, Jacobson, Ortlund, Paulie and Perlmann1987; Sathiyaseelan & Baldwin, Reference Sathiyaseelan and Baldwin2000). Compared with other studies, in our proliferation assay with CFDASE staining, firstly, no mAb was used; in other words, the CFDASE was not mixed with the conjugated mAbs. Secondly, we compared between 3 d and 6 d of incubation and found that 3 d PBMC incubation is the most appropriate time. Moreover, we used 1×10⁶ viable PBMC/ml of samples whereas other researchers used higher concentrations of PBMC. To our best experience, very high concentration of PBMC would be problematic at the end of day 3 of incubation even with the use of 24-well tissue culture plates. By applying CFDASE alone we were also able to use a higher concentration of CFDASE. In our validation and standardization we found that the above differences and advantages enabled us to more efficiently load the CFDASE into the cells during incubation, thereby resulting in a more appropriate quantification of the lymphocytes division and proliferation indices. CFDASE simply diffuses into the lymphocytes where it is cleaved by intracellular esterases to yield compounds that are fluorescent and irreversibly react with lysine side-chains and other available amine groups of mainly intracellular and lymphocyte-surface proteins; it then remains in the cells with a considerable stability (Wells et al. Reference Wells, Gudmundsdottir and Turka1997; Bird et al. Reference Bird, Brown, Mullen, Moskowitz, Mahowald, Sider, Gajewski, Wang and Reiner1998). The amount of the CFDASE in the lymphocytes is then partitioned equally between daughter cells during mitosis and therefore decreases by half at each cell division. When the characteristics of the logarithmic amplifier on the flow cytometer are known (e.g., 3 or 4 log decades full scale), the software deconvolution algorithms can derive from a cytogram of fluorescence intensity (Bagwell & Adams, Reference Bagwell and Adams1993; Givan et al. Reference Givan, Fisher, Waugh, Ernstoff and Wallace1999). The proportion of the cells that have undergone any particular number of cell division during the incubation period will be proliferation indices. These indices, which are total lymphocyte proliferation over the four generations measured, were predominantly greater in primiparous cows.
It appears that T cells from pluriparous cows respond less efficiently to mitogens like ConA and PW, compared with their younger counterparts. We suspect that the impairment of immune cell function in pluriparous dairy cows (Mehrzad et al. Reference Mehrzad, Duchateau, Pyörälä and Burvenich2002; Paape et al. Reference Paape, Mehrzad, Zhao, Detilleux and Burvenich2002; Burvenich et al. Reference Burvenich, Van Merris, Mehrzad, Diez-Fraile and Duchateau2003) is associated with a decreasing population and proliferation of T cell subsets. Metabolic disorders, such as increased serum concentrations of non esterified fatty acids (NEFA), β-hydroxybutyric acid (BHBA) and other metabolites, and energy deficit occur more frequently in pluriparous cows (Burvenich et al. Reference Burvenich, Van Merris, Mehrzad, Diez-Fraile and Duchateau2003; Lacetera et al. Reference Lacetera, Scalia, Franci, Bernabucci, Ronchi and Nardone2004) that might have contributed to the impaired lymphocyte functions in pluriparous cows observed in our study. Judging from the results of the proliferation assay, we could conclude that there was a relationship between imbalance of CD4+/CD8+ ratio and diminished lymphoproliferative capacity.
Despite their unique appearance, lymphocytes are a diverse mixture of many subpopulations that can be identified only by their characteristic cell surface molecules and by their behaviour to, for example, mitogen stimulators. The proliferation capacity of the lymphocytes was, therefore, determined by a mitogen-induced proliferation assay. We showed that stimulation of lymphocytes with different stimulators behaved, somehow, differently in primiparous and pluriparous cows. Furthermore, we observed for the first time that at generation 3 the proliferative response of lymphocytes to ConA and PW was markedly higher in primiparous cows; this further confirms that T lymphocyte proliferative capacity in primiparous cows is higher than in pluriparous cows, because the ConA specifically affects T cell proliferation (Kato et al. Reference Kato, Watarai, Nishikawa, Iwasaki and Kodama2007). Conversely, the proliferative response of lymphocytes to LPS in primiparous cows was lower than in pluriparous ones. In general, it seems that there is an accumulation of memory T cells in the circulation, which occurs at the expense of other cells in pluriparous cows. The exact reason for the reduced lymphocyte proliferative response to LPS in primiparous cows requires further investigation. Interestingly, non-stimulated T cells of pluriparous cows showed noticeably higher proliferative responses than those of primiparous cows. This discrepancy may indicate that lymphocytes are already primed and activated in blood circulation of pluriparous cows. This activation may be due to the fact that the pluriparous cows have been much more exposed to antigens throughout their lives. Further analysis is needed to identify lymphocyte activators in blood circulation of pluriparous cows.
The lectins, ConA and PW, stimulate nucleosidine incorporation, phospholipid synthesis, DNA synthesis and mitosis of lymphocytes; moreover, ConA specifically induces proliferation of T cells (Kato et al. Reference Kato, Watarai, Nishikawa, Iwasaki and Kodama2007). Thus, the proliferation capacity examined in our proliferation assay with ConA provides a conclusive result about the proliferation of T cells (CD4+ and CD8+ cells). A significantly higher ConA-induced lymphoproliferation capacity in primiparous cows indicates an up-regulated mitogenic activity of the activated T cells, though a higher T cell proliferation capacity observed with ConA and PW does not always translate into a better response to a single epitope. Nonetheless, during infection this higher proliferative capacity in primiparous cows, which is often accompanied by a substantial production of inflammatory cytokines (Sad et al. Reference Sad, Marcotte and Mosmann1995; Riollet et al. Reference Riollet, Rainard and Poutrel2000), would further stimulate proliferation and trafficking of lymphocytes and neutrophils (Czuprynski et al. Reference Czuprynski, Henson and Campbell1985; Mehrzad et al. Reference Mehrzad, Janssen, Duchateau and Burvenich2008). Moreover, the primiparous cows seemed to generate T cells with even higher proliferative activity. Similar results were noted in a previous study in milk lymphocytes (Nonnecke & Kehrli, Reference Nonnecke and Kehrli1985; Mehrzad et al. Reference Mehrzad, Janssen, Duchateau and Burvenich2008).
CD2+ T cells were studied in order to have an idea of the total T cell population in the blood stream, which was more numerous in pluriparous cows. We also concentrated on CD4+ and CD8+ cells, but not γ/δ T cells, although the population of γ/δ T cells, which are activated through non MHC-restricted antigens, are also crucial during infection in dairy cows (Sathiyaseelan & Baldwin, Reference Sathiyaseelan and Baldwin2000), and it is worth studying their dynamics v. parity and age in dairy cows. Both in primiparous and in pluriparous cows the CD4+ cells represented a greater proportion than CD8+ cells in the blood; but the increased CD4+ was more pronounced in pluriparous cows. The increased CD4+ together with the slightly decreased CD8+ cells led to a substantially greater CD4+/CD8+ ratio in the blood of pluriparous cows; the ratio is very important in maintaining T cell homeostasis and immune regulation. In normal physioimmunology the CD4+/CD8+ ratio in bovine blood circulation is ~2·5 (Park et al. Reference Park, Fox, Hamilton and Davis1992; Asai et al. Reference Asai, Kai, Rikiishi, Sugawara, Maruyama, Yamaguchi, Ohta and Kumagai1998; Kimura et al. Reference Kimura, Goff, Kehrli and Harp1999). This immunological normality was observed in primiparous cows, whereas in pluriparous cows the ratio was ~4, strongly suggesting an immunological imbalance. Indeed, when this ratio increases, it can result in immune dysregulation in the host. As a consequence, this may lead to a decline in clearance of infection and reduced responses to preventive vaccination (Plowden et al. Reference Plowden, Renshaw-Hoelscher, Engleman, Katz and Sambhara2004a, Reference Plowden, Renshaw-Hoelscher, Gangappa, Engleman, Katz and Sambharab; Smith et al. Reference Smith, Kreeger, Alvarez, Goin, Davis, Whipple and Estes1999). From our results, it appears more indisputable that there is a kind of immune dysregulation status and a weaker lymphocyte response to stimuli in pluriparous or old dairy cows. Indeed, aging is a multi-faceted process, and defective T cell responses in pluriparous cows are likely to be attributable to the synergy of defects throughout the immune system rather than to one aspect of an immune cell function (Gao & Jakobson, Reference Gao and Jakobsen2000; Burvenich et al. Reference Burvenich, Van Merris, Mehrzad, Diez-Fraile and Duchateau2003; Plowden et al. Reference Plowden, Renshaw-Hoelscher, Engleman, Katz and Sambhara2004a, Reference Plowden, Renshaw-Hoelscher, Gangappa, Engleman, Katz and Sambharab; Patton et al. Reference Patton, McGuire, Fraser and Hines2004).
In conclusion, our results confirm a diminished lymphoproliferative response of blood lymphocytes and occurrence of CD4+-CD8+ imbalance in the peripheral blood of pluriparous (older) dairy cows, which is a novel finding in the bovine. This less intense responsiveness to mitogen induced-lymphoproliferataion in pluriparous dairy cows may be associated with a change of the proportions of T lymphocytes subpopulations. The CD4+-CD8+ imbalance and diminished lymphoproliferation response may lead to a weaker T cytotoxic-mediated immunity and increased susceptibility to infectious diseases in old dairy cows. Further insight into the particular cytokine detection is also required. With an alternative safer, faster and more reproducible method our study also emphasizes further application of the method in farm animals.
This work was supported in part by a discovery grant from Natural Science and Engineering Research Council of Canada and by the Ferdowsi University of Mashhad. Thanks are due also to the staff of Macdonald Campus Farm (McGill University) for their support and assistance throughout the experiment, and to Jaime Sanchez-Dardon for technical support in flow cytometry.