INTRODUCTION
Although studies of submarine cave meiobenthos exist, they have mostly been carried out on the soft-bottom community (e.g. Todaro et al., Reference Todaro, Leasi, Bizzarri and Tongiorgi2006; Janssen et al., Reference Janssen, Chevaldonnè and Martinez Arbizu2013), and not on that of the rocky substrate. In the absence of studies dealing with this specific topic, only studies of the meiofauna of open sea hard bottoms can be useful for a comparison. Danovaro & Fraschetti (Reference Danovaro and Fraschetti2002) clearly distinguished the rocky meiofauna from that of the soft bottoms at the same coastal location, in terms of both community composition and individuals abundance. Nematoda dominated the soft-bottom meiofauna, while Harpacticoida dominated that of the rocky bottoms. A subsequent study used the same sampling method (Fraschetti et al., Reference Fraschetti, Gambi, Giangrande, Musco, Terlizzi and Danovaro2006) for assessment of habitat quality, and identified Harpacticoida as the main taxon in the rocky meiobenthos. However, researchers using Harpacticoida as indicators in rocky meiofauna should consider that knowledge of this taxon is still limited. Some recently published studies report that a high percentage (75–99% of species) of Harpacticoida collected from sandy-muddy bottoms in caves (Janssen et al., Reference Janssen, Chevaldonnè and Martinez Arbizu2013) or abyssal plains (George et al., Reference George, Veit-Köhler, Martinez Arbizu, Seifried, Rose, Willen, Bröhldick, Corgosinho, Drewes, Menzel, Moura and Schminke2014) are new to science, and are still awaiting full description.
The present contribution is further justified by the growing knowledge of the cave in question, due to a series of other studies conducted there. The study of the sessile macrobenthos assemblages of the Ciolo cave by Bussotti et al. (Reference Bussotti, Terlizzi, Fraschetti, Belmonte and Boero2006) indicates that community composition changes sharply in the first 15–20 m from the entrance, and the innermost portion is characterized by incomplete substratum coverage. An interesting aspect of that study was the demonstration of small-scale variability in the composition of the rocky benthic assemblage. If any correlations exist between sessile benthos and meiofauna, both these small- and large-scale variabilities could also affect meiobenthos composition. In the same cave, Denitto et al. (Reference Denitto, Terlizzi and Belmonte2007) demonstrated the existence of sessile benthos settlement activity on artificial panels, even at a great distance from the entrance. After 2 years the sessile assemblages on the panels were still considered ‘immature’ and different from the ‘mature’ sessile community colonizing the rocky walls of the cave. This suggests that the meiofauna associated with sessile macrobenthos at different stages of maturity could also vary. Todaro et al. (Reference Todaro, Leasi, Bizzarri and Tongiorgi2006) found the soft-bottom meiobenthos to be characterized by distinct faunal features, with an interesting distribution along the cave's major axis, including higher numbers of Gastrotricha species and specimens in the innermost positions. In a study of the zooplankton, Moscatello & Belmonte (Reference Moscatello and Belmonte2007) reported a number of taxa attributable to the benthic domain, tentatively assignable to the meiofauna. It follows that these organisms are able to enter the water column and possibly to move along the cave length.
Summarizing the contributions of all authors, there is a clear reduction in the number of taxa and individuals proceeding from the entrance towards the innermost portion for both macrobenthos (Bussotti et al., Reference Bussotti, Terlizzi, Fraschetti, Belmonte and Boero2006; Denitto et al., Reference Denitto, Terlizzi and Belmonte2007) and plankton (Moscatello & Belmonte, Reference Moscatello and Belmonte2007). Todaro et al. (Reference Todaro, Leasi, Bizzarri and Tongiorgi2006) however showed that among the soft-bottom meiobenthos, Gastrotricha showed the opposite distribution pattern, with density values higher in the most confined stations.
MATERIALS AND METHODS
Study site
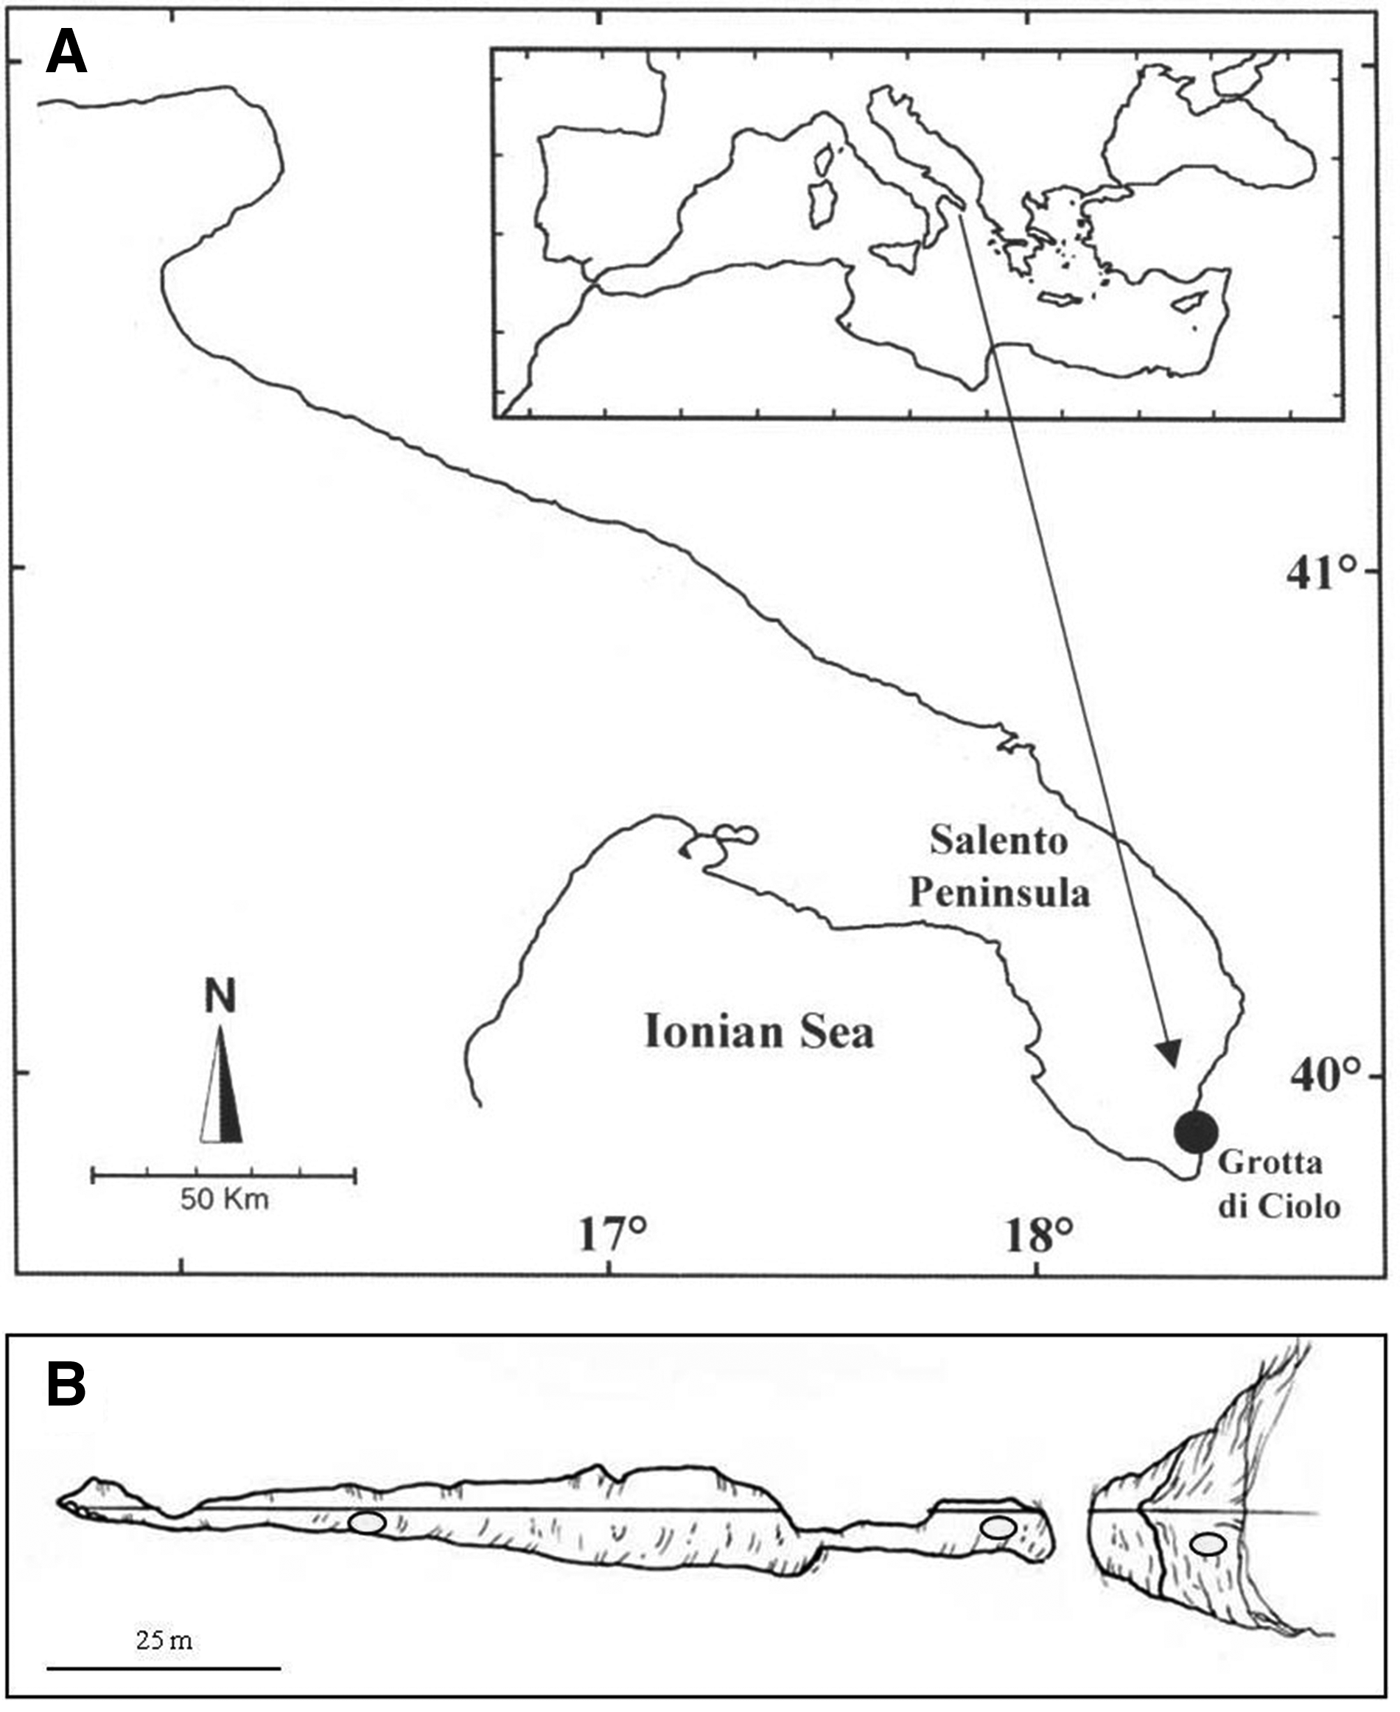
The marine cave under study is the Grotta di Ciolo, located near Capo di Leuca (south-east Italy, 39°50′38″N 18°23′11″E) (Figure 1A). It is semi-submerged, with a single entrance. It has a horizontal development of approximately 125 m (Onorato et al., Reference Onorato, Denitto and Belmonte1999) and a maximum depth of 6 m below sea level. The cave receives significant freshwater input, which determines marked haloclines and thermoclines in the water column of the innermost part (Denitto et al., Reference Denitto, Terlizzi and Belmonte2007).
Study site: Map (A) of the geographic area, and profile (B) of the cave investigated (Grotta di Ciolo). Abiotic factors and meiofauna stations are represented by dots along the progression of the cave (B).

Within this marine cave, three different portions are distinguishable on the basis of the macrobenthos assemblages: the illuminated entrance (Ent), with algae; the semi-dark intermediate zone (Mid), colonized mainly by sponges and madreporarians; and the dark innermost zone (Ins), characterized by incomplete coverage of the rocky walls with Serpulidae (Polychaeta) and a few other macroscopic taxa (Bussotti et al., Reference Bussotti, Terlizzi, Fraschetti, Belmonte and Boero2006).
Sampling design
ABIOTIC FACTORS
Abiotic parameters (temperature, salinity, pH and photosynthetically active radiation (PAR)) were measured in the whole water column at three positions along the progression of the cave (Figure 1B): at the entrance (Ent), Mid (20–25 m from the entrance), and Ins (85–90 m from the entrance), in October 2012 and April 2013. Abiotic factors were measured and recorded in situ with a multi-parameter probe (IDROMAR), moved slowly by hand from the bottom to the uppermost point of the water column (corresponding to the surface in those places where the cave ceiling emerges). The final vertical profile derives from the average values (obtained from 7–10 recorded values) for each 30 cm of water depth. Abiotic data were measured and recorded in scuba dives conducted separately from the collection of biological samples.
TIME SERIES
Time series (TS) data were obtained from samples collected in a previous study of the settlement and primary succession of sessile benthos on artificial panels (Denitto et al., Reference Denitto, Terlizzi and Belmonte2007). From that study two TSs were available, each 2 years long, one starting in March 2002 (TS A) and one starting in October 2002 (TS B), providing a picture of colonizations starting in two different seasons. After 1 (T1), 6 (T6), 12 (T12) and 24 (T24) months, six panels (each 225 cm2) were removed from each of the three positions (Ent, Mid, Ins), placed together in a plastic bag to avoid any loss of material, and fixed with buffered (pH 7.3) formalin solution (4% in seawater). Unlike the sessile benthos, the meiofauna easily became detached from the panels. For this reason, we found meiofauna from different panels in the same plastic bag, and thus we did not consider the six panels as replicate samples of each position. The three sampling positions (Ent, Mid, Ins), each represented by six panels, were treated as three replicate sampling points in the same environment (the cave) for each Time, over a period of 2 years.
In order to collect the meiofauna, the storage solution used for the panels and the water from the panel wash was filtered through two nets of mesh size 250 and 63 μm respectively, in order to separate the material into size classes, thus facilitating identification and counting under a compound microscope (magnifications from 25 to 400×). Counting and identification of specimens was mostly performed at the family level. Abundances were reported as specimens 300 cm−2.
SPACE DISTRIBUTION
A sucking device was used to collect samples from the vertical walls of the cave. Its efficacy was tested before use during five dedicated dives in the same cave. A thread of Ariadne, with indications of distances from the entrance, was positioned along the west cave wall. The sampling points were choosen at an intermediate position on the vertical profile of the wall to avoid any bottom or surface contaminations deriving from mud resuspension or the presence of fresh water respectively. Samples of meiofauna were collected on three different dates (in October 2012, April and October 2013) from three different positions along the cave (Ent, Mid and Ins) (Figure 1B). The sucking device was equipped with a flexible tube with a terminal spout (mouthpiece 5 × 0.5 cm). At each collection the spout was repeatedly passed over the rocky wall, scraping for a linear distance of 30 cm near the thread of Ariadne (where the linear distance was indicated). The scraping was carried out by passing the spout both above and below the thread of Ariadne thus collecting from a total sampling surface of 5 cm × 30 cm × 2 = 300 cm2. The same scraping was repeated (generating a replicate sample) on an adjacent patch, again near the thread of Ariadne. Each sample (sucked from a total surface of 300 cm2) was pumped into a 50 μm mesh plankton net. Once out of the cave and the sea, the collected material was immediately placed in a Falcon tube with ethanol at a final concentration of about 90%.
In the laboratory each sample was first rehydrated and then filtered through two sieves (250 and 63 μm) to facilitate observation and counting under a compound microscope (magnifications from 25 to 400×). Data were given as number of individuals 300 cm−2, in order to be compared with those from the Time series.
The analysis focused on the Harpacticoida, the most representative rocky meiobenthos taxon, but identification was performed at the family level.
Foraminifera, the most abundant component, were not considered due to the impossibility of promptly assessing the fullness of their shells (thereby assigning them to either a living community or simply to the detritus). In addition, they are not considered to strictly belong to the meiofauna (Giere, Reference Giere2009). The identification of Harpacticoida was based on the most commonly used guides (Lang, Reference Lang1948; Huys et al., Reference Huys, Gee, Moore and Hammond1996; Boxshall and Halsey, Reference Boxshall and Halsey2004; Wells, Reference Wells2007). Data were reported as specimens 300 cm−2.
STATISTICAL ANALYSES
Time series data (from panels), were organized into a matrix of 55 taxa × 8 samples (4 dates × 2 Time series). The data (not transformed) were plotted by cluster analysis and nMDS for the combination of 4 times and 2 series. The similarity percentages procedure (primer SIMPER routine) was used to identify the contribution of each taxon to the observed Bray–Curtis similarity values among positions and times (Clarke, Reference Clarke1993). All data were analysed using PRIMER 6 computer software (Clarke & Gorley, Reference Clarke and Gorley2001).
Space distribution data (from the sucking device) were analysed only for the Harpacticoida, with a matrix of 25 taxa × 9 samples (3 positions × 3 dates). The data were processed by cluster analysis and nMDS (Clarke, Reference Clarke1993).
RESULTS
Abiotic factors
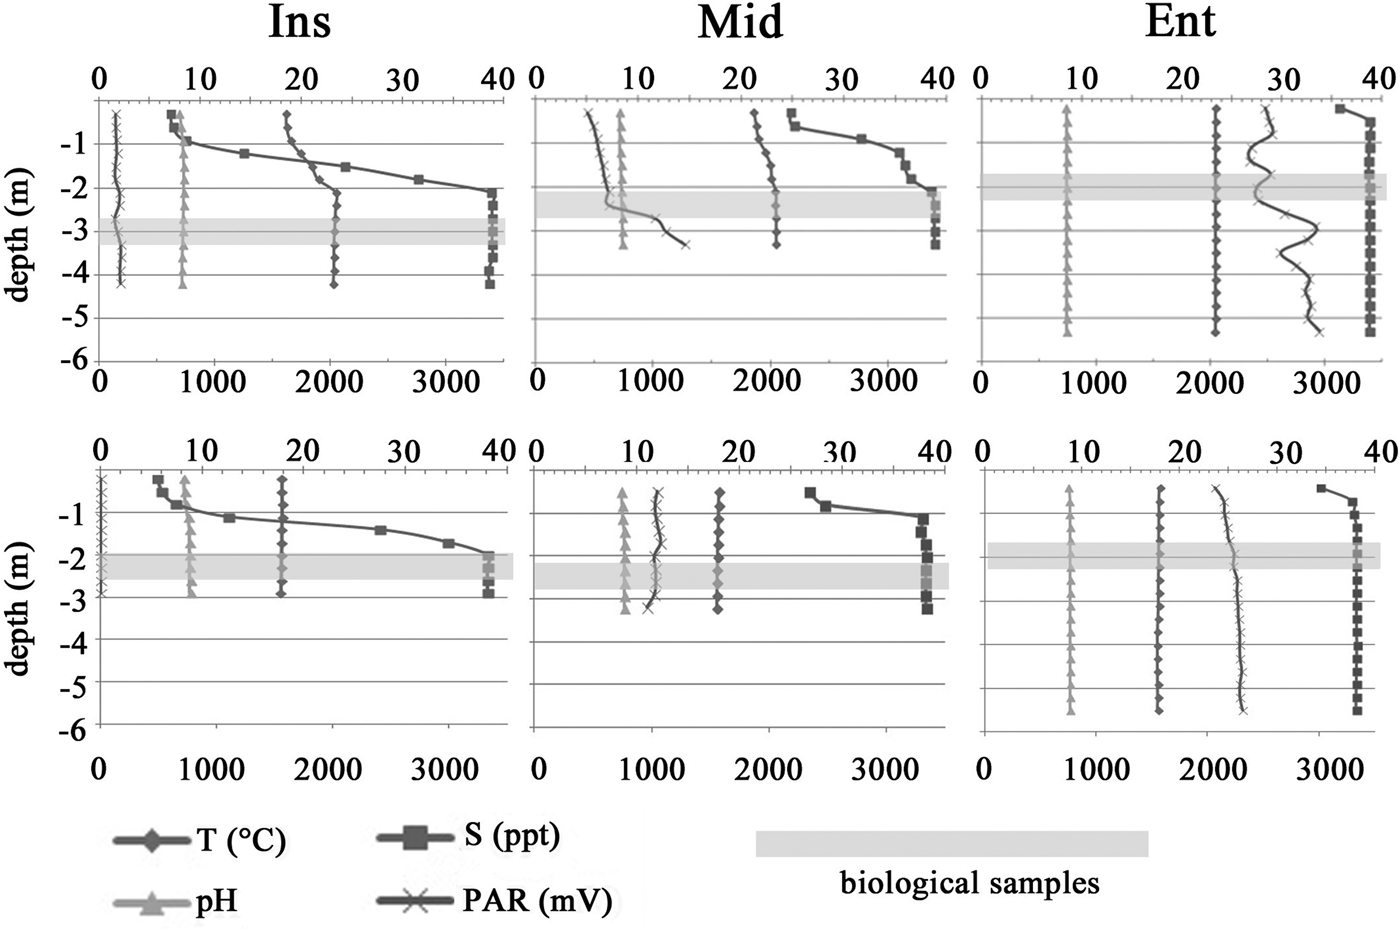
Figure 2 shows the variation of abiotic parameters along the water column in the three different positions of the cave in October 2012 and April 2013. In both dates PAR values showed an irregular vertical profile at Ent with a trend of increasing values from the surface to the bottom. PAR was significantly lower at Mid and absent at Ins.
Vertical profiles of abiotic factors. The first row of graphs represents values recorded on October 2012 in the three different positions (Ins, Mid, Ent). The second row represents values recorded in April 2013 in the same positions. Temperature, salinity and pH values are indicated on the upper part of each graph; PAR values are indicated on the lower part of each graph. The y-axis represents the depths at which the values were measured (intervals of 30 cm). The grey strip indicates the point of meiobenthos collection.
In both dates the surface water layer showed the lowest salinity (5.8 ppt). At Ins, the diluted water layer had a thickness of 1.5–2.0 m, while at Ent it was only 30 cm. This heterogeneity in the water column was also evident for temperature at Ins, but only in October 2012.
Although the value range is not appreciable in Figure 2, pH varied between 7.84 and 8.78 and was directly correlated with salinity.
Time Series
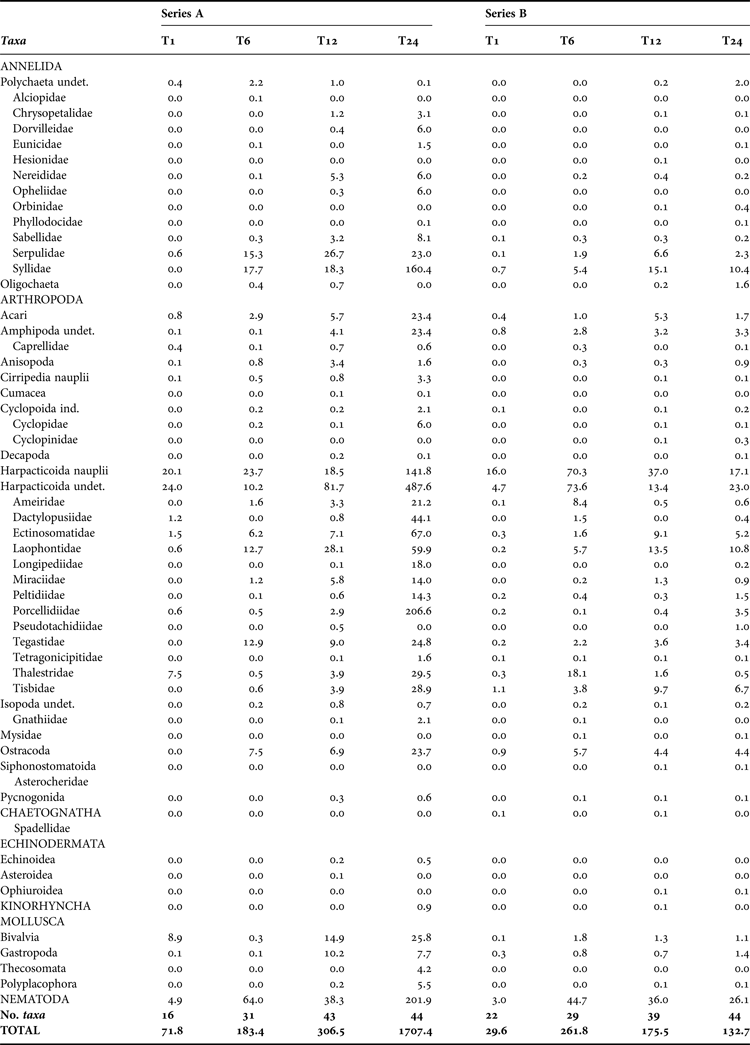
The total meiofauna assemblage of the two considered Time series (TS A and TS B) comprised 55 taxa (summarized in Table 1) belonging to seven phyla, with 72.7% common to both series. TS A and TS B followed a similar pattern in terms of increasing taxa richness over time. Numerical abundance was highest at the end (24th month) of TS A but not at the end of TS B. The total meiofauna assemblage was dominated by Arthropoda (32 taxa), and Polychaeta (13 taxa), always present together with Nematoda, and Mollusca veligers. Arthropoda accounted for an average of 71.1% of total specimens at T24, while 65.0% of Arthropoda were accounted for by Harpacticoida, mainly represented by undetermined specimens and nauplii in both TSs. The differences in meiofauna assemblages between times and series are represented by cluster and MDS ordination plots (Figures 3 & 4).
Meiobenthos assemblage cluster analyses; Time Series A and B (data not transformed).
Meiobenthos assemblage nMDS plot, with time (T1, T6, T12 and T24) and series (A and B) as factors (data not transformed).
List of taxa found on artificial panels (each face 225 cm2) placed in the Grotta di Ciolo marine cave (2002–2004) and their abundances in Time Series A and B. T1–T24 are the sampling times at 1–24 months from the positioning of panels. Each value (individuals 300 cm−2) is the average meiofauna abundance in six plastic bags (two per position, each bag containing three panels).
Space Distribution
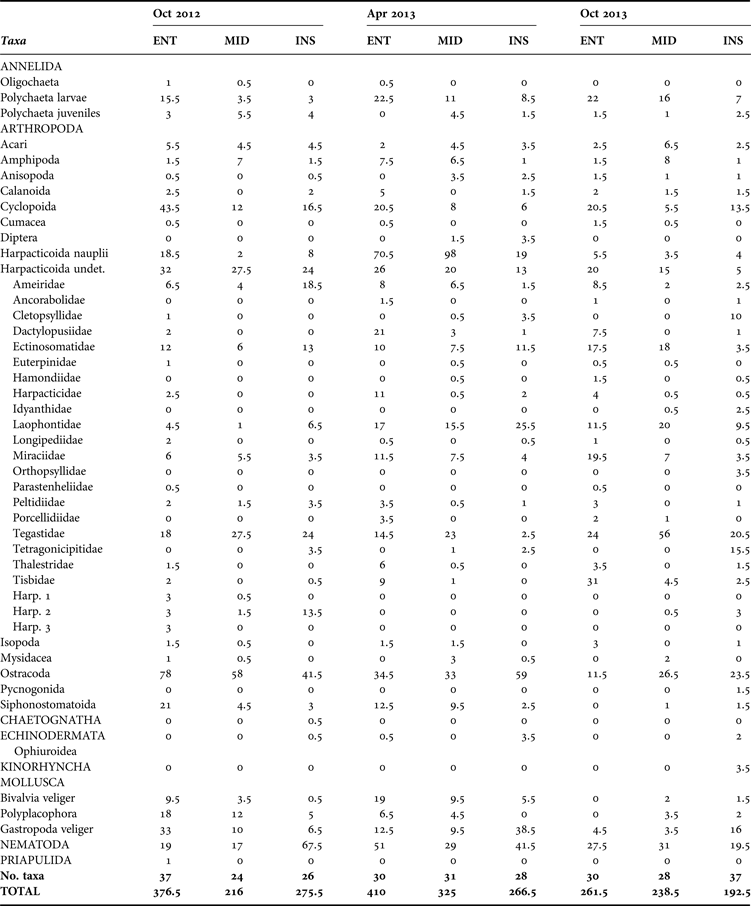
A total of 48 taxa belonging to eight phyla (Table 2) were recognized. Forty-one taxa were found at Ent, 37 at Mid and 40 at Ins. Arthropoda was the dominant phylum, accounting for 74.1% of total specimens. Harpacticoida were chosen as the most useful and reliable meiofauna component for statistical studies based on the most detailed taxon. Other taxa such as Acari, Mollusca, Nematoda and Polychaeta were found in all sampling positions. Priapulida were found only at Ent and Kinorhyncha, Chaetognatha and Pycnogonida were found only at Ins.
List of taxa found on rocky walls in the Grotta di Ciolo marine cave and their average abundances. Samples were collected from 3 positions (ENT, MID, INS) on 3 different dates. Each value (individuals 300 cm−2) is the average of two replicates. Harp types 1, 2 and 3 are different (but not identified) families.
Harpacticoida
Harpacticoida were represented by a total of 25 taxa (23 families and two undetermined), with Tegastidae (420 specimens), Laophontidae (222), Ectinosomatidae (198), Miraciidae (136), Ameiridae (116) and Tisbidae (101) the most frequently attested. A total of 423 specimens were not assigned to any family. Most of these were nauplii or early juveniles, but 56 were grouped into three categories (Harpacticoida type 1, type 2, type 3) not corresponding to any known families. Among the frequently attested families, Tetragonicipitidae (45 specimens) appeared to be most closely associated with the Ins position. On the other hand, Dactylopusiidae (70 specimens) and Miraciidae (136 specimens) appeared to be linked to the Ent position.
For the statistical analysis (Figure 5), similarity between replicates at each position ranged between 80 and 88%. At Ent this result was mainly due to undetermined Harpacticoida (18.07%), while the Mid and Ins average similarities were both mainly due to Tegastidae (31.82 and 15.72% respectively). Dissimilarity among positions amounted to 34.27% between Ent and Mid, mainly due to Tegastidae (17.33%). The average dissimilarities between Ent and Ins (47.17%) and between Mid and Ins (45.54%) were mainly due to Harpacticoida nauplii (16.50 and 24.15% respectively).
Harpacticoida assemblage cluster analysis; Positions Ent, Mid, and Ins (data not transformed).
The Ent samples appeared to be more closely grouped than those of the other positions (Figure 6). An Ent-Mid-Ins alignment (from left to right in the plot) is evident in April and October 2013, but not in Oct 2012, when the points are arranged perpendicular to the other dates. In general, the plot shows that while the distance between replicates remained constant, the distance among positions varied significantly among dates.
nMDS plot based on Harpacticoida taxa, with positions (Ent, Mid, Ins) and dates (Oct 2012, Apr 2013, Oct 2013) as factors (data not transformed).
Comparison of the two studies
The TS and Space distribution samples were both dominated by the presence of Crustacea Harpacticoida. The biggest difference was the richer presence of Harpacticoida taxa (25 vs 17) in the Space distribution study. However, the TS study found two families (Laophontopsidae and Pseudotachidiidae) that were not seen in the Space distribution study. Among the other Crustacea, the TS study yielded no Calanoida while Cirripedia nauplii were not found in the the Space distribution study. Considering the other taxa, Polychaeta were particularly abundant and diversified in the TS study.
From the abundance point of view, the TS study found an average (for the two TSs) of 920.5 specimens 300 cm−2 in the last period (T = 24 months), far more than were found in the Space distribution study (for which the average of the whole dataset was 284.7 specimens 300 cm−2).
DISCUSSION
Abiotic factors
Comparison of positions shows that PAR had the greatest variability. Sharp oscillations of PAR values are visible both along each water column, and along the cave progression. The irregularly distanced values along the vertical column were probably due to the irregular profile of the analysed rocky wall, which produced variations in the intensity of light/shadow. Inside the cave, just 20–25 m from the entrance (Mid) there was an evident reduction in PAR, with maximum values on the bottom, as is frequently observed in submarine caves (Riedl, Reference Riedl1966), where the dark portion of each section is close to the ceiling. The negligible PAR values recorded at the Ins position could reflect instrumental noise in a completely dark environment. Variations recorded for all other parameters are the result of the continuous supply of fresh water which, due to the ceiling morphology, forms a reservoir-layer 1.5–2.0 m thick at the Ins position, over the saltier, denser water. Temperature, pH and salinity showed variations linked to the presence of the fresh water, more abundant in the most confined water column, where the double-layer stratification is more pronounced.
Time series
The meiofauna recorded in the two TSs were only apparently similar. In fact, the 77.2% of taxa found in both series could be the consequence of their being grouped into high-level taxa (no lower than the Family) for comparison. A more detailed analysis of species composition might indicate greater difference. In contrast, numerical abundance differed significantly.
The dominance of Harpacticoida in meiofauna on artificial panels (new substrata) has already been demonstrated (Atilla & Fleeger, Reference Atilla and Fleeger2000; Danovaro & Fraschetti, Reference Danovaro and Fraschetti2002; Fonsêca-Genevois et al., Reference Fonsêca-Genevois, Somerfield, Neves, Coutinho and Moens2006), although not in submarine caves.
The development of the community, at least at the beginning of the TS, is probably affected by the starting season, as evidenced by a sharp difference in the T1 of the two TSs seen in the nMDS plot. However, the time of panel positioning seemed to affect the meiofauna assemblage only after the first month (T1). Indeed, after 6 months (T2) the assemblages from the TSs had already converged towards a similar abundance of taxa. In addition, in TS A the 24th month was characterized by an increase in the abundance of some taxa, suggesting, at least for the Harpacticoida nauplii, that a spawning episode had recently happened (Zaleha & Jamaludin, Reference Zaleha and Jamaludin2010). No repetition of the nauplii swarm was observed either one year earlier in the same TS, or in the corresponding times of TS B. This suggests that the seasonality and timing of population growth and succession are not easily predictable for Harpacticoida.
Harpacticoida had their highest relative abundance at T1 in both TSs. This confirms that they are effective early colonists, as proposed by Atilla et al. (Reference Atilla, Wetzel and Fleeger2003) and Fonsêca-Genevois et al. (Reference Fonsêca-Genevois, Somerfield, Neves, Coutinho and Moens2006). Being able to swim, movement from the natural to the artificial substrate was probably not a problem for them.
A microbial biofilm forms on artificial panels after just 1 day of immersion (Fonsêca-Genevois et al., Reference Fonsêca-Genevois, Somerfield, Neves, Coutinho and Moens2006). Since Harpacticoida have a range of food preferences ranging from detrital organic matter to microorganisms (Rieper, Reference Rieper1982), the availability of food potentially present after just 1 month facilitated their establishment.
SPACE DISTRIBUTION
The data obtained by collection from the vertical walls showed that the meiofauna distribution among the different positions followed an original pattern in comparison with data from other studies of plankton (Moscatello & Belmonte, Reference Moscatello and Belmonte2007) and sessile macro-benthos (Bussotti et al., Reference Bussotti, Terlizzi, Fraschetti, Belmonte and Boero2006) at the same site. Indeed, the previous studies showed a clear decrease in the number of taxa from the entrance to the innermost part of the cave, in agreement with the rule of diversity depletion along the cave axis (Riedl, Reference Riedl1966; Harmelin et al., Reference Harmelin, Vacelet and Vasseur1985; Balduzzi et al., Reference Balduzzi, Bianchi, Boero, Cattaneo-Vietti, Pansini and Sarà1989; Zabala et al., Reference Zabala, Riera, Gili, Barauge, Lobo and Penuelas1989). In the present study, a fall in the number of specimens and taxa was evident only between the Ent and Mid positions, but not between Mid and Ins. On the contrary, there was a small increase, and in April 2013 the Ins position showed the highest abundance of specimens. The increase in meiofauna populations towards the innermost portion of the Grotta di Ciolo could be due to the small size of the organisms in question (meiobenthic Harpacticoida) and, consequently, to a trophic rule that differs from that which causes depletion of sessile macro-benthos. Todaro et al. (Reference Todaro, Leasi, Bizzarri and Tongiorgi2006) found a similar distribution pattern in Gastrotricha in the soft-bottom meiobenthos, and Bussotti et al. (Reference Bussotti, Terlizzi, Fraschetti, Belmonte and Boero2006) in Serpulidae among the macrobenthos. The simplification of community assemblages probably favours the affirmation of a microbial food chain in the innermost position of the cave, thus allowing the small-sized Harpacticoida to take advantage of microbial food, not suitable for the majority of macro-benthic species.
The samples taken from the vertical walls highlight a complex Harpacticoida community. Ten further families were found compared with the study carried out on the artificial panels. Cletopsyllidae, Orthopsyllidae and Tetragonicipitidae were found exclusively or in higher numbers in the most confined positions. It is worth mentioning that the Cletopsyllidae family was previously unknown in Italian waters (Todaro & Ceccherelli, Reference Todaro and Ceccherelli2010) and that in general it is found in low numbers in the bathyal zone (Huys & Lee, Reference Huys and Lee1998). The faunal similarity of internal cave areas to the bathyal zone has been already highlighted by Janssen et al. (Reference Janssen, Chevaldonnè and Martinez Arbizu2013) for soft-bottom Harpacticoida. The Cletopsyllidae of the Ciolo cave (30 specimens of both sexes) are far more abundant than those collectable in open deep-sea waters, and this represents an encouraging starting point for taxonomic studies in future. Finally, the completely unknown Types (1, 2 and 3) also require taxonomic collocation due to their interesting abundance (seven, 43 and six specimens respectively).
The difficulty of collecting samples in caves is the probable cause of such a high concentration of faunal novelties. Previous studies have listed other species from the Ciolo cave as new to science (see for example, Todaro & Shirley, Reference Todaro and Shirley2003; Todaro et al., Reference Todaro, Leasi, Bizzarri and Tongiorgi2006, for Priapulida and Gastrotricha; and Belmonte, Reference Belmonte2005 for Facetotecta), and the next step will be in the direction of a better understanding of diversity among Harpacticoida.
Comparison of the two studies
The TS study revealed more taxa than the Space distribution study (55 vs 48). However, this could simply be due to the enhanced sampling effort carried out in the first study. The TS study collected specimens from a surface area of 64,800 cm2, compared with just 8100 cm2 for the Space distribution study. This suggests caution when interpreting the different diversity of the two studies, as it is well known (since Preston, Reference Preston1948) that the diversity and/or species richness values depend on the size of the sample and/or the sampling effort. The different average abundances found in the two studies could however be due to the ecological situations of the two cases (early succession vs mature community). It is possible that small-sized taxa are more easily linked to the early successional stages of a community. However, this situation should also respect the tendency of a higher Diversity index in the more stable/mature situation. We did not examine the community at species level (as required for Diversity measures), but the taxa analysed (families) indicated enhanced Diversity among the rocky wall community.
Both the TS and Space distribution studies showed variability (see the arrangement of points in the nMDS plots) that was not explainable on the basis of seasonality. Indeed, in both cases we had the opportunity to compare the same month in different years, but we did not find comparable results. In addition, such variability could be explained by the small size of the organisms considered (the meiobenthos) and the general absence of pelagic larvae in their life cycles. A short life cycle, typical of small-sized species, in a taxonomically crowded community, could be responsible, together with the lack of migration of hatchlings, for rapid substitutions of taxa over time, not due to the variability of the environment, but to a bet-hedging affirmation strategy (Philippi & Seger, Reference Philippi and Seger1989) in a crowded marketplace.