Implications
Blood pH changes may occur with high frequency in dairy cows, as blood acidification can occur resulting from dietary cation–anion difference (DCAD) reduction, ruminal acidosis or also the high metabolic rate of lactating dairy cows. We observed that blood pH increased with increasing DCAD, which resulted in a lower milk concentration of ionic calcium (iCa). Thus, our results suggested that milk mineral composition may be directly affected by blood acid–base balance, which can be a key point of dairy processing efficiency, as reduction of milk concentration of iCa may increase milk ethanol and thermal stability.
Introduction
In current intensive milk production systems, dairy cows may need three to six times more energy for milk production than is required for maintenance, which demands high ability of intake, digestion, absorption and metabolization of nutrients (National Research Council (NRC), 2001). Therefore, lactating cows will have a high metabolic rate, experience more heat stress and be fed high non-fibrous carbohydrates feeds. All these factors may contribute to blood acidification and to increasing the incidence of metabolic diseases (Block, Reference Block1994; Fagnani et al., Reference Fagnani, Beloti and Battaglini2014).
The pH of biological fluids is directly associated with the biochemical reactions essential for life maintenance. In dairy cows, in response to blood acidification, some metabolic mechanisms are triggered to maintain the pH of biological fluids near homeostasis, such as increasing cationic ions associated with decreasing of anionic elements (Block, Reference Block1994; Ross et al., Reference Ross, Spears and Garlich1994; Jackson et al., Reference Jackson, Akay, Franklin and Aaron2001). Thus, renal metabolism plays an important role to maintain the blood acid–base balance. When blood pH reduces the urinary excretion of cationic minerals is reduced in attempt to compensate acidification of biological fluids. In addition, when blood pH is reduced, in response to the action of parathyroid (PTH) and 1.25-dihydroxycholecalciferol (1.25(OH2)D3) hormones, blood concentrations of ionic calcium (iCa) is increased, because these hormones alter intestinal absorption, bone resorption and renal reabsorption of calcium to increase its blood concentration (Block, Reference Block1994).
The increase of blood concentrations of cationic minerals in response to biological fluids acidification may change in the same way the mineral composition of milk. According to Marques et al. (Reference Marques, Fischer, Zanela, Ribeiro, Stumpf and Rodrigues2011), blood acidification increased milk concentrations of iCa and reduced the milk ethanol and thermal stability, which can affect milk processing and cause losses to dairy farmers and dairy processors (Fisher et al., Reference Fisher, Ribeiro, Zanela, Marques, Abreu, Machado, Fruscalso, Barbosa and Stumpf2012). Thus, the blood acid–base difference may alter the lactating performance of dairy cows, milk mineral composition and also the efficiency of milk processing (Marques et al., Reference Marques, Fischer, Zanela, Ribeiro, Stumpf and Rodrigues2011; Fisher et al., Reference Fisher, Ribeiro, Zanela, Marques, Abreu, Machado, Fruscalso, Barbosa and Stumpf2012).
Previous studies described that blood pH, dry matter intake (DMI) and lactating performance of dairy cows may be increased as dietary cation–anion difference (DCAD) increased (Hu and Murphy, Reference Hu and Murphy2004; Sharif et al., Reference Sharif, Shahzad, Nisa and Sarwar2010). On the other hand, milk concentrations of cationic minerals such as iCa can be reduced by increasing DCAD (Marques et al., Reference Marques, Fischer, Zanela, Ribeiro, Stumpf and Rodrigues2011). According to Barros et al. (Reference Barros, Denis, Gonzalez and Núñez1999), when milk concentrations of iCa is increased, negative charges of casein micelles is reduced, which accelerates micelle interactions and reduces heat stability of milk during industrial processing (Jeurnink and DeKruif, Reference Jeurnink and De Kruif1995). In a companion paper (Martins et al., Reference Martins, Arcari, Welter, Saran Neto, Oliveira and Santos2015), we reported that milk concentration of iCa reduced and milk ethanol and heat stability at 140°C increased according to increase of DCAD. Moreover, it was observed that increased milk yield and fat, lactose and total milk solids contents according to DCAD increases. Thus, in the present paper we aimed to evaluate the effect of DCAD on ruminal fermentation, total apparent digestibility, blood and renal metabolism and mineral balance in lactating dairy cows. In addition, we studied the association of blood and urinary pH with milk concentrations of iCa, Na, K and Cl.
Material and methods
Experimental design and animals
Sixteen Holstein cows averaging (mean±SD) 22±4.5 kg of milk/day, 158±52 days in milk, and 618±57 kg of BW were distributed in four contemporary 4×4 Latin squares, consisting of four treatments and four periods of 21 days divided into 14 days of adaptation and 7 days of sample collection. The experimental treatments consisted of four DCAD levels, calculated according to the Na, K, Cl and S concentrations of the dietary ingredients as 290, 192, 98, and −71 milliequivalent (mEq)/kg of dry matter (DM). The table with ingredients proportion and chemical composition of experimental diets was described in detail in a companion paper (Martins et al., Reference Martins, Arcari, Welter, Saran Neto, Oliveira and Santos2015). The DCAD levels were calculated based on Tucker et al. (Reference Tucker, Hogue, Waterman, Swenson, Xin, Hemken, Jackson, Adams and Spicer1991) using the formula: mEq/kg of DM=[(% Na in DM/0.023)+(% K in DM/0.039)]−[(% Cl in DM/0.0355)+(% S in DM/0.016)]. The diets were formulated to be isoenergetic (1.58 Mcal/kg of DM) and isoproteic (160 g/kg of DM), according to NRC (2001) recommendations. Throughout the experiment, the cows were housed in individual stalls with a sand base, milked twice daily and fed a total mixed ration (TMR) once a day according to DMI on the previous day, to keep daily orts of 5% to 10% of the amount offered.
Feeds analyses and total apparent digestibility
Samples of the feed supplied, orts and feces collected directly from the rectum (at 0700 h and 1300 h) were collected during the last four days of each experimental period. The samples were stored at −20°C, to comprise a pool sample by period for each animal based on the dry weight for chemical analysis. The DM, ash, CP, and ether extract (EE) content in samples of feed and orts were determined according to Association of Official Analytical Chemists (AOAC International, Reference Apper-Bossard, Faverdin, Meschy and Peyraud1995). Acid detergent insoluble CP, neutral detergent insoluble CP (NDICP), acid detergent lignin, NDF, and acid detergent fiber contents were obtained according to Van Soest et al. (Reference Van Soest, Robertson and Lewis1991). The NDF analysis was performed according to adaptations described by Mertens (Reference Mertens2002) using α-amylase without sodium sulfite. The samples were ground, dry digested, and solubilized before mineral analysis. The Ca, P, Na and K content were determined by flame emission spectrophotometer (Thermo Fisher Scientific, 2008). The S concentration was obtained by colorimetry (molybdenum blue) and chloride content was determined according to the Mohr method (Malavolta et al., Reference Malavolta, Vitti and Oliveira1997). The NFC content was calculated according to Hall (Reference Hall2000): NFC=100−Ash−EE−NDF−(CP−CPu+U), where CPu is the CP from urea and U is the urea content, considering all terms expressed in % of DM. Total digestible nutrients (TDN) and net energy for lactation (NEL) were calculated according to NRC (2001).
Total fecal excretion of each cow was calculated using indigestible acid detergent fiber (iADF) as an internal marker, in order to calculate the total apparent digestibility. Feeds, orts and feces samples were inserted in Ankom® F57 bags (Ankom Technology Corporation, Fairport, NY, USA), which were incubated for 288 h in the rumen of two cannulated Nellore steers for determination of the concentration of indigestible acid detergent fiber (iADF; Casali et al., Reference Casali, Detmann, Valadares Filho, Pereira, Heriques, Freitas and Paulino2008).
Ruminal fluid, blood, urine and milk sampling and analysis
On the latest day of each experimental period, samples of ruminal fluid (50 ml/cow) were collected using esophageal tube, before and 3 h after morning feeding. Approximately, the first 300 ml of ruminal fluid collected were discarded, and immediately after sampling pH was determined using a potentiometer. Rumen fluid samples were centrifuged at 3000 r.p.m. and storage at −20°C to determine ammonia and short-chain fatty acid (SCFA) concentrations. The ammonia nitrogen (N-NH3) concentration of the ruminal fluid was determined according to the colorimetric methodology described by Chaney and Marbach (Reference Chaney and Marbach1962). The analysis of ruminal concentration of SCFA was performed according to Erwin et al. (Reference Erwin, Marco and Emery1961). A gas chromatograph (GC-2014; Shimadzu, Kyoto, Japan) equipped with a glass column (Stabilwax®, Restek, Bellefonte, PA, USA; 30 m of length/0.53 mm of internal diameter) at 145°C (isothermal), an injector split/splitless, and a detector dual FID at 250°C was used for these analyses.
Blood sampling was performed on day 20 of each experimental period by puncture of mammary vein before morning feeding. Blood samples were inserted into an automatic I-Stat® analyzer (Abbott of Care, Princeton, NJ, USA) previously calibrated with cartridge to determine the blood concentrations of Na, K, ionic calcium (iCa), bases excess (BE), pH, carbon dioxide partial pressure (pCO2), oxygen partial pressure (pO2), hematocrit (Hct), bicarbonate (HCO3), carbon dioxide tension (tCO2), oxygen saturation (sO2) and hemoglobin (Hb).
Urine samples of 100 ml/cow were collected by vulva massage, and immediately pH was determined using a potentiometer and stored at −20°C. In order to determine the urinary concentrations of Na and K, samples were previously diluted, digested and solubilized in hydrochloric acid. The urinary concentrations of Na and K were determined by flame emission spectrophotometer (Thermo Fisher Scientific, 2008). Creatinine concentrations were obtained using commercial kits (Laborlab®, Guarulhos-SP, Brazil) and was calculated by the following equation: creatinine (mg/dl)=creatinine (mg/dl)×0.020×50 (Biggs and Cooper, Reference Biggs and Cooper1961). Daily total urine volume was estimated by dividing the daily urinary excretion of creatinine by the observed values of creatinine concentration in the urine spot samples, in accordance with Oliveira et al. (Reference Oliveira, Valadares, Valadares Filho, Cecon, Rennó, Queiroz and Chizzotti2001). The urinary excretion of creatinine was estimated using the equation 24.05 mg creatinine/kg live weight proposed by Chizzotti et al. (Reference Chizzotti, Valadares Filho, Valadares, Chizzotti, Marcondes and Fonseca2007).
In each experimental period, milk samples were collected and immediately the iCa concentration was determined using a potentiometer with selective electrode (Barros et al., Reference Barros, Denis, Gonzalez and Núñez1999). Individual milk samples from all cows were collected and stored at −20°C. In order to determine the milk concentrations of Na and K, samples were previously diluted, digested and solubilized in hydrochloric acid. Subsequently, milk concentrations of Na and K were determined by flame emission spectrophotometer (Thermo Fisher Scientific, 2008). Chloride content was determined according to the Mohr method (Malavolta et al., Reference Malavolta, Vitti and Oliveira1997). The mineral balance was calculated by discounting the excreted in milk, feces and urine from the total daily ingested.
Statistical analysis
The data were analyzed using SAS (version 9.2, SAS Institute Inc., Cary, NC, USA) after testing for residual normality and homogeneity of variance. The data were analyzed using the MIXED procedure of SAS according to the following model:
 $$Y_{{ijkl}} =\mu {\plus}T_{i} {\plus}S_{j} {\plus}C_{{k\left( j \right)}} {\plus}P_{l} {\plus}e_{{ijkl}} $$
where Y ijkl is the dependent variable; μ the overall mean; T i the fixed effect of treatment i (3 DF); S j the fixed effect of Latin square j [1 to 4 (3 DF)]; C k(j) the random effect of cow k within each Latin square [k=1 to 16 (12 DF)]; P l =fixed effect of period l [1 to 4 (3 DF)]; e ijkl the random error associated with each observation. The ruminal fermentation variables were analyzed as repeated measures (0 and 3 h after morning feeding). Several error structures were investigated, and the chosen structure for each variable was evaluated according to Bayesian information criteria (BIC), based on following model:
 $$\eqalignno{ Y_{{ijklm}} \!=\, & \mu {\plus}T_{i} {\plus}S_{j} {\plus}C_{{k\left( j \right)}} {\plus}P_{l} {\plus}e(a)_{{ijkl}} {\plus}TI_{m} {\plus}[T_{i} {\times}{\rm }TI_{m} ] \cr & {\plus}[Q_{k} {\times}{\rm }TI_{m} ]{\plus}[C_{{k(j)}} {\times}{\rm }TI_{m} ]{\plus}[P_{l} {\times}{\rm }TI_{m} ]{\plus}e(b)_{{ijklm}} $$
where Y ijklm =dependent variable; μ the overall mean; T i the fixed effect of treatment i (3 DF); S j the fixed effect of Latin square j [1 to 4 (3 DF)]; C k(j) the random effect of cow k within each Latin square [k=1 to 16 (12 DF)]; P l the fixed effect of period l [1 to 4 (3 DF)]; e(a) ijkl the random error associated with each observation of main plot (a); TI m the fixed effect of time m (1 DF); [T i ×TI m ] the fixed effect of interaction between i treatment and m time (3 DF); [Q k ×TI m ] the fixed effect of interaction between Latin square k and time m; [C k(j) ×TI m ] the random effect of interaction among cow k within each Latin square and time m (12 DF); [P l ×TI m ] the fixed effect of interaction between period l and time m (3); and e(b) ijklm the random error associated with each observation of subplot (b).
The orthogonal polynomial coefficients were obtained using the IML procedure of SAS because the treatments were not equally spaced. The treatment effect was decomposed into three orthogonal polynomial contrasts (linear, quadratic and deviation). Intercepts and slopes were calculated using the estimate option of the MIXED procedure of SAS. For all statistical analyses, significance was declared at P⩽0.05 and trends at P⩽0.10.
Results
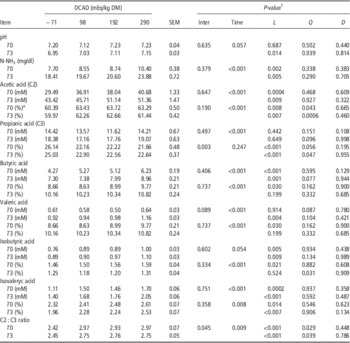
Ruminal fluid samples were collected before and 3 h after the morning feeding, in order to determine the pH, SCFA and N-NH3 concentrations. There was no interaction effect among DCAD and time of sample collection on ruminal pH and concentrations of SCFA and N-NH3. However, ruminal pH linearly increased according to DCAD increase from −71 to 290 mEq/kg DM [Y=6.98 (SE=0.05)+0.00062 (SE=0.0002)×DCAD (mEq/kg DM)] 3 h after the feeding, whereas before feeding (time 0), no effect of DCAD was observed on ruminal pH.
Three hours after feeding, ruminal concentrations of N-NH3 and SCFA were increased, and the acetic : propionic (C2 : C3) ratio was reduced, when compared with samples collected before feeding. The experimental diets did not change the concentrations of propionic acid; however, ruminal concentrations of N-NH3 and acetic, butyric, valeric, isobutyric and isovaleric acids were increased linearly as DCAD increased. As a result of changes in ruminal concentrations of acetic acid, the C2 : C3 ratio was linearly increased in both times of sampling according to DCAD increase [T0: Y=2.63 (SE=0.18)+0.001448 (SE=0.00035)×DCAD (mEq/kg DM); T3: Y=2.60 (SE=0.13)+0.0018 (SE=0.0004)×DCAD (mEq/kg DM)−0.000004 (SE=0.0000016)×DCAD (mEq/kg DM)]. The rumen fluid concentrations of SCFA were also evaluated as a ratio of total SCFA. In both times of sampling, the proportions of acetic, valeric, isobutyric and isovaleric acids increased linearly as DCAD increased; whereas the proportion of propionic acid was reduced, and the proportion of butyric acid was only increased linearly in time 0 according to DCAD increase (Table 1).
Effect of dietary cation–anion difference (DCAD) on ruminal fermentation in dairy cows

L=probability of linear effect; Q=probability of quadratic effect; D=deviation; Inter=probability of interaction effect among DCAD and time of sampling; T0 and T3=time of sampling: before (time 0) and 3 h after morning feeding.
a % of the total of SCFA.
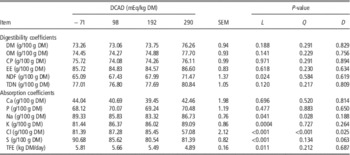
The total apparent digestibility of DM (mean=74.03% and SEM=0.94), organic matter (OM; mean=75.22% and SEM=0.92), CP (mean=74.97% and SEM=0.99), EE (mean=85.35% and SEM=0.83) and TDN (mean=78.01% and SEM=1.05) were not changed by DCAD. However, DCAD changed the absorption coefficients of Cl, S, Na, K and the NDF total apparent digestibility. The Na absorption coefficient was reduced in a quadratic form as DCAD increased, whereas S absorption coefficient was linearly reduced. The lowest Na absorption coefficient was obtained with DCAD of 154 mEq/kg DM. With increasing DCAD we observed a linear increase of NDF total apparent digestibility and the K absorption coefficient, and, in a quadratic form, Cl absorption coefficient was increased. When DCAD increased from −71 to 290 mEq/kg DM, the NDF total apparent digestibility increased by 6.38% [Y=65.90 (SE=2.37)+0.0167 (SE=0.0068)×DCAD (mEq/kg DM)] (Table 2).
Effect of dietary cation–anion difference (DCAD) on DM and nutrient total apparent digestibility and absorption coefficients of microelements in dairy cows

DM=dry matter; OM=organic matter; EE=ether extract; TDN=total digestible nutrient; L=probability of linear effect; Q=probability of quadratic effect; D=deviation; TFE=total fecal daily excretion.
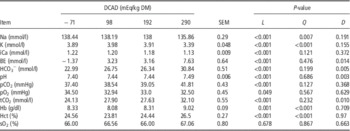
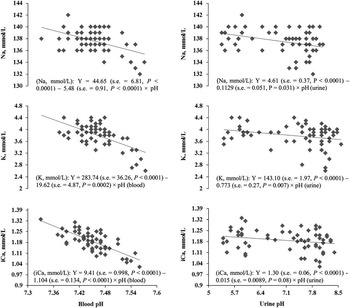
The blood concentrations of HCO3 [Y=24.21 (SE=0.57)+0.0195 (SE=0.0025)×DCAD (mEq/kg DM)], BE [Y=0.263 (SE=0.796)+0.023 (SE=0.0025)×DCAD (mEq/kg DM)] and blood pH [Y=7.41 (SE=0.006)+0.00023 (SE=0.000029)×DCAD (mEq/kg DM)] linearly increased with increasing DCAD. As a result of the higher pH, the blood concentrations of cationic minerals (Na, K and iCa) where linearly reduced as DCAD increased. Similarly, blood pCO2 and tCO2 increased according to DCAD increase, whereas pO2 reduced, which indicates that cows probably changed their respiratory rate in order to maintain blood pH near homeostasis. As a result of DCAD increase, Hct and Hb concentrations were also increased (Table 3).
Effect of dietary cation–anion difference (DCAD) on blood metabolism in dairy cows

DM=dry matter; L=probability of linear effect; Q=probability of quadratic effect; D=deviation; iCa=ionic calcium; BE=bases excess; HCO3 −=bicarbonate; pCO2=carbon dioxide partial pressure; pO2=oxygen partial pressure; tCO2=carbon dioxide tension; Hb=hemoglobin; Hct=hematocrit; sO2=oxygen saturation.
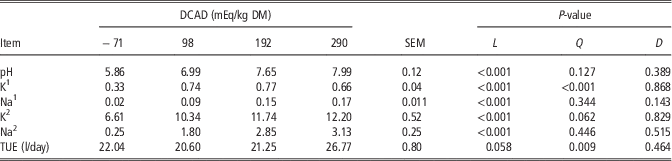
The renal reabsorption of ions is a physiological mechanism that plays an important role in keeping the acid–base difference of biological fluids near homeostasis, as the urinary excretion of cationic minerals may be reduced or increased according to blood acid–base difference. Urinary concentrations of K and Na increased in a quadratic and linear form, respectively, according to DCAD increase. When we evaluated the concentrations of these minerals as a ratio of creatinine concentrations in urine, the proportions of K : creatinine and Na : creatinine increased from 6.607 to 12.204 and from 0.246 to 3.135, respectively, when DCAD increased from −71 to 290 mEq/kg DM; which is indicative of lower Na and K renal reabsorption when DCAD was increased. In response to the higher urinary excretion of Na and K, urine pH was increased according to DCAD increase [Y=6.35 (SE=0.13)+0.00607 (SE=0.00042)×DCAD (mEq/kg DM)] (Table 4).
Effect of dietary cation–anion difference (DCAD) on urinary concentrations of cationic minerals and pH of urine in dairy cows

DM=dry matter; L=probability of linear effect; Q=probability of quadratic effect; D=deviation; TUE=total urine daily excretion.
1 g/100 ml.
2 g mineral g creatinine ratio.
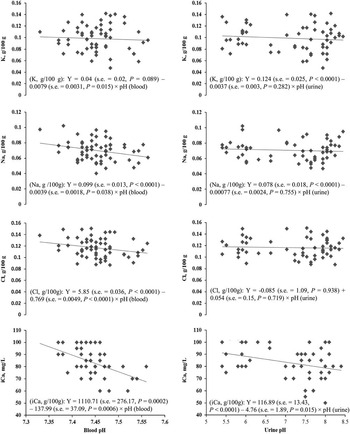
The blood acid–base changes may directly affect the blood and milk concentrations of cationic minerals. Therefore, the blood (Figure 1) and milk (Figure 2) concentrations of Na, K and iCa were linearly reduced as blood pH increased. However, the urinary pH had a low association with milk concentrations of Na and K, as the intercepts and slopes of equations were not significant (P>0.05).
Effect of blood and urinary pH of dairy cows on blood concentrations of minerals.

Effect of blood and urinary pH of dairy cows on milk concentrations of minerals.

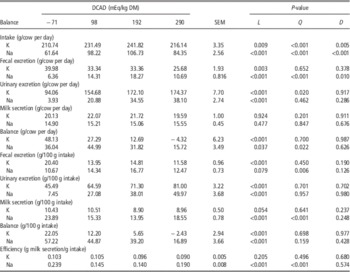
The K intake increased in a quadratic form as DCAD increased, while K fecal excretion linearly reduced. On the other hand, K urinary excretion linearly increased according to DCAD increase, whereas milk secretion of K was not changed. As a result of changes in digestive and renal metabolism regulation, the K balance (g/day) was linearly reduced with increasing DCAD [Y (g/cow per day)=39.28 (SE=15.51)–0.14 (SE=0.03)×DCAD (mEq/kg DM); Y (g/100 g intake)=17.91 (SE=7.31)–0.065 (SE=0.015)×DCAD (mEq/kg DM)]. Although DCAD changed the K balance, the efficiency of dietary K utilization for milk production (g K milk/g K intake) was not altered. The Na intake and Na fecal excretion increased in a quadratic form according to DCAD increase, whereas urinary excretion linearly increased and milk secretion was unchanged (g/cow per day). In response to these alterations, the Na balance reduced in a linear form as DCAD increased when balance was expressed as g/cow per day [Y (g/cow per day)=38.79 (SE=4.42)−0.052 (SE=0.024)×DCAD (mEq/kg DM)] and also when expressed as g/100 g intake [Y (g/100 g intake)=52.49 (SE=5.60)–0.106 (SE=0.021)×DCAD (mEq/kg DM)]. Different from K, the efficiency of dietary Na utilization to milk production was reduced in a quadratic form as DCAD increased [Y (g Na milk/g Na intake)=0.182 (SE=0.014)−0.00064 (SE=0.000075)×DCAD (mEq/kg DM)+0.0000023 (SE<0.000001)×DCAD2 (mEq/kg DM2)] (Table 5).
Effect of dietary cation–anion difference (DCAD) on Na and K balance in dairy cows

DM=dry matter; L=probability of linear effect; Q=probability of quadratic effect; D=deviation.
Discussion
Ruminal fermentation and total apparent digestibility
The ruminal fluid acidification resulting from dietary changes may reduce microbial activity, especially cellulolytic bacteria, which can result in a lower ruminal digestion of dietary fiber fraction. In response to DCAD increase, the ruminal pH was linearly increased 3 h after morning feeding; which may occur due to a higher cationic : anionic minerals ratio in the diet and, consequently, in the ruminal fluid. Moreover, in order to increase DCAD, in the current study, sodium bicarbonate was included to replace ammonia sulfate, which in addition to increasing the dietary concentration of Na can contribute to the rumen buffering because of the buffer function of dietary sodium bicarbonate (NRC, 2001).
The ruminal concentrations of acetic, butyric, valeric, isobutyric, isovaleric and C2 : C3 ratios were increased according to DCAD increase. These results probably occurred in response to the higher fiber digestion, as NDF total apparent digestibility increased with increasing of DCAD, and mainly acetic acid concentration in ruminal fluid is positive associated with ruminal fiber digestion (NRC, 2001; Sharif et al., Reference Sharif, Shahzad, Nisa and Sarwar2010). Apper-Bossard et al. (2010) studied the effects of two levels of dietary concentrate (20% or 40% DM) and three levels of DCAD (0, 150 and 300 mEq/kg DM) on ruminal metabolism of dairy cows. It was described that DCAD did not change the mean of ruminal pH, the molar proportion of SCFA and NDF digestibility; however, DCAD reduced the rate of pH dropping after feeding with diets containing 40% of concentrate. In the present study, the mean of ruminal pH after 3 h of feeding was higher than mean (pH=6.19) described by Apper-Bossard et al. (2010). The higher pH observed in the current study may be attributed to the methodology used to collect ruminal fluid, as the use of esophagus tube can overestimate the pH value probably due saliva contamination of samples (Salles et al., Reference Salles, Ribeiro, Saran Netto and Del Claro2003).
The total apparent digestibility of DM, OM, EE, CP and absorption coefficients of Ca and P did not change by DCAD. These results are similar to those reported by Delaquis and Block (Reference Delaquis and Block1995), which did not find an effect of DCAD (+55 or +375 mEq/kg DM) on nutrient total apparent digestibility. Similarly, Hirosh and Block (Reference Hirosh and Block1991) did not observe an effect of DCAD on Ca absorption coefficient. The effect of DCAD on nutrient digestibility depends on the levels of DCAD evaluated, ingredients used and changes in ruminal fermentation in response to dietary ingredients modification, as well as milk production of the dairy cows (Sharif et al., Reference Sharif, Shahzad, Nisa and Sarwar2010). The majority of studies evaluating DCAD to lactating dairy cows used only positive milliequivalence, which reduce the need to restrict supplying of sodium bicarbonate, resulting in absence or low effect of DCAD on ruminal fermentation and nutrient digestibility (Tucker et al., Reference Tucker, Harrison and Hemken1988; Delaquis and Block, Reference Delaquis and Block1995; Sharif et al., Reference Sharif, Shahzad, Nisa and Sarwar2010). In the present study, the NDF total apparent digestibility linearly increased according to DCAD increase. The positive effect of DCAD on NDF digestibility may be associated with a higher ruminal pH and, consequently, a higher cellulolytic bacteria activity in ruminal fluid, which can be indicated by an increase in ruminal concentrations of acetic and butyric acids in diets with higher DCAD.
The efficiency of minerals utilization during digestive, blood and renal metabolism and also by the peripheral tissue, depends not only on dietary concentration of each mineral, but can also depend on interactions between them and the blood acid–base difference. In the present study, the absorption coefficients of Cl, S and Na increased as DCAD was reduced. When DCAD was reduced, the intestinal flow of anions of diets probably increased, as well as a higher blood HCO3 − movement into the gut counterbalanced by intestinal absorptions of Cl and, consequently, Na (Block, Reference Block1994). Contrary to Na, the K absorption coefficient was linearly reduced according to DCAD reduction. The K absorption coefficient may be negatively correlated with Na absorption coefficient, which was increased during DCAD reduction in response to higher Cl absorption in ionic exchange with blood HCO3 − secreted into the gut (Underwood and Suttle, Reference Underwood and Suttle1999).
Blood metabolism
The blood acidification in dairy cows may occur frequently, and in normal conditions is quickly compensated by increasing blood concentrations of cationic minerals in order to maintain the neutral electrically of biological fluids. The blood concentrations of HCO3 − and blood pH were linearly reduced according to DCAD reduction. This result was similar to those reported by Salles et al. (Reference Salles, Zanetti, Del Claro, Netto and Franzolin2012), which evaluated the effect of two dietary forage : concentrate ratios (60 : 40 or 40 : 60) associated with increased DCAD (−100 or 400 mEq/kg DM) of Nellore steers, and described that blood pH and concentrations of HCO3 − were reduced with DCAD reduction.
In response to body fluids acidification by DCAD reduction, physiological mechanisms were triggered to compensate metabolic acidosis, which changes the blood concentrations of cationic minerals in an attempt to reestablish the blood ionic balance. The blood concentration of iCa of dairy cows linearly increased with DCAD reduction. A similar result was described by Marques et al. (Reference Marques, Fischer, Zanela, Ribeiro, Stumpf and Rodrigues2011), which included 250 g/day of ammonia chloride in the diet of lactating dairy cows and observed that blood concentration of iCa increased by 0.68 mg/dl when compared with cows fed cationic diet. Similarly, Tucker et al. (1992) observed that cows fed anionic diets in prepartum had higher blood concentration of iCa than cows fed cationic diets. Similar results were also reported by Tucker et al. (Reference Tucker, Hogue, Waterman, Swenson, Xin, Hemken, Jackson, Adams and Spicer1991) and Wu et al. (Reference Wu, Liu, Xu and Ye2008). The increase of blood concentration of Ca can be a metabolic response to pH reduction of cellular and transcellular fluids, which stimulates the production of hormones PTH and 1.25(OH2)D3, and depresses the action of calcitonin. The PTH and 1.25(OH2)D3 are responsible for increasing Ca turnover and blood concentration of this mineral by increased intestinal absorption, renal and bone resorption of Ca (Block, Reference Block1994).
Similar to Ca, the blood concentrations of Na and K also increased with DCAD reduction. The increase of blood concentrations of Na and K could be occurring as a response to renal excretion of cations, which is probably reduced to increased cationic minerals concentrations in body fluids to compensate blood acidification (Block, Reference Block1994). Hu and Murphy (Reference Hu and Murphy2004) reported in a meta-analysis study that DCAD of lactating dairy cows did not change the blood concentrations of Na, whereas K concentrations increased according to DCAD reduction. In contrast, Fredeen et al. (Reference Fredeen, Depeters and Baldwin1988) described that blood concentration of Na was reduced with DCAD reduction. Other studies, Tucker et al. (Reference Tucker, Harrison and Hemken1988); West et al. (Reference West, Haydon, Mullinix and Sandifer1991) and Marques et al. (Reference Marques, Fischer, Zanela, Ribeiro, Stumpf and Rodrigues2011), did not observe effect of DCAD on blood concentrations of Na and K. Therefore, there are different results about the effect of DCAD on blood concentrations of Na and K; which may be due to the different methodologies that were used to study DCAD, as following: type of anionic or cationic salt used; DCAD levels studied; type of diets (TMR or concentrate supplementation of dairy cows grazing pasture, as well as forage : concentrate ratio) and mineral concentration of diets evaluated.
As a result of compensation mechanisms of metabolic acidosis, blood acidification can alter the mineral composition of milk and milk ionic balance, which is a key factor that determines milk stability during heat treatment and/or ethanol test (Marques et al., Reference Marques, Fischer, Zanela, Ribeiro, Stumpf and Rodrigues2011; Fisher et al., Reference Fisher, Ribeiro, Zanela, Marques, Abreu, Machado, Fruscalso, Barbosa and Stumpf2012). In the present study, the milk concentration of iCa, Na, K and Cl increased according to blood pH reduction, which indicates that metabolic changes triggered in order to maintain body fluids neutral electrically may directly affect the milk concentration of cationic minerals. The increase in concentration of divalent ions in milk can reduce the negative charges of casein micelles and the electrostatic repulsion forces between them (Barros et al., Reference Barros, Denis, Gonzalez and Núñez1999; Marques et al., Reference Marques, Fischer, Zanela, Ribeiro, Stumpf and Rodrigues2011; Fisher et al., Reference Fisher, Ribeiro, Zanela, Marques, Abreu, Machado, Fruscalso, Barbosa and Stumpf2012), which can facilitate the coagulation of milk proteins during the alcohol test performed in dairy farms and dairy plants, as well as during milk thermal treatment (Fisher et al., Reference Fisher, Ribeiro, Zanela, Marques, Abreu, Machado, Fruscalso, Barbosa and Stumpf2012). In a companion study (Martins et al., Reference Martins, Arcari, Welter, Saran Neto, Oliveira and Santos2015), we described that milk ethanol and thermal stability were linearly increased when DCAD increased from −71 to 290 mEq/kg DM, which suggested that the control of metabolic changes in lactating dairy cows to maintain the blood acid–base status in equilibrium play an important role to maintain milk stability to ethanol and during heat treatments, probably due to a lower milk concentration of iCa.
Blood pH changes may occur with high frequency in dairy cows, as blood acidification can occur resulting from DCAD reduction, ruminal acidosis (Ponce and Hernándes, Reference Ponce and Hernández2005) or also high metabolic rate of lactating dairy cows (Fisher et al., Reference Fisher, Ribeiro, Zanela, Marques, Abreu, Machado, Fruscalso, Barbosa and Stumpf2012; Fagnani et al., Reference Fagnani, Beloti and Battaglini2014). Thus, based on results of the present study, increasing DCAD can maintain the blood pH near homeostasis, reduce milk concentrations of divalent cations, and probably contribute to avoiding problems with unstable milk proteins during ethanol test and also industrial heat treatment (Martins et al., Reference Martins, Arcari, Welter, Saran Neto, Oliveira and Santos2015).
In response to blood acidification, the blood concentration of BE was reduced according to DCAD reduction. Similar results were observed by Apper-Bossard et al. (2010) and Salles et al. (Reference Salles, Zanetti, Del Claro, Netto and Franzolin2012) that reported lower blood concentration of BE with DCAD reduction. Moreover, in our study, the blood pCO2 and, consequently, tCO2 were reduced with DCAD reduction, which indicate that probably respiratory responses also occurred to compensate blood acidification resulting from DCAD reduction. Similar results were reported by Hu and Murphy (Reference Hu and Murphy2004) and Salles et al. (Reference Salles, Zanetti, Del Claro, Netto and Franzolin2012), which observed that pCO2 linearly reduced when DCAD changed from 635.7 to −191 mEq/kg DM and from 400 to −100 mEq/kg DM, respectively. The pCO2 reduction suggested an increase in respiratory rate that may occur in order to compensate metabolic acidosis, as CO2 is a gas that when dissolved in water forms carbonic acid, which dissociates into H+ and HCO3 − contributing to biological fluids acidification. Thus, when blood pH is reduced, dairy cows can raise their respiratory rate to increase CO2 elimination (West et al., Reference West, Haydon, Mullinix and Sandifer1991 and Reference West, Mullinix and Sandifer1992; Block, Reference Block1994).
Renal excretion and monovalent cation balance
According to DCAD increased we observed an increase in urinary concentrations of Na and K. Similarly, Tucker et al. (Reference Tucker, Harrison and Hemken1988) observed that when DCAD increased from −100 to 200 mEq/kg DM, the urinary concentrations of Na and K were also increased, whereas Cl concentrations were reduced. Similar results were also reported by West et al. (Reference West, Haydon, Mullinix and Sandifer1991 and Reference West, Mullinix and Sandifer1992), which observed that urinary cation-anion difference was increased with DCAD increase. Hu and Murphy (Reference Hu and Murphy2004) described that urinary concentrations of K and Cl linearly increased as its respective dietary concentrations were increased, whereas urinary Na concentration rose in a quadratic form according to the level of this mineral in the diet. Apper-Bossard et al. (2010) reported that in cows fed low DCAD, 70% of chlorides and 16% of Na intake were excreted in urine, whereas in cows fed high DCAD, 33% of chlorides and 53% of Na were excreted. The changes observed in urinary concentration of Na, K and Cl according to DCAD reduction may have occurred by renal reabsorption regulation of these minerals in order to compensate for metabolic acidification, which increases anions excretion (Cl) and reabsorption of cationic (Na and K) minerals regulators of blood acid–base balance. Thus, kidneys play an essential role to maintain homeostasis and to compensate the metabolic acidosis by regulation of water excretion and ionic exchanges (Block, Reference Block1994). As a response to renal elimination of anions in excess and conservation of Na and K during metabolic acidosis, the urinary pH was linearly reduced according to DCAD reduction. Hu and Murphy (Reference Hu and Murphy2004) also described that urinary pH was highly responsive to DCAD changes, and observed that higher urinary pH occurred when DCAD was 620 mEq/kg DM (R 2=0.86).
In the present study, DCAD reduction increased the Na and K balance (expressed as g/cow per day and percent of each mineral per total intake). This result indicates that physiological mechanisms of metabolic acidosis compensation were efficient to maintain Na and K retention. When DCAD was reduced from 290 to −71 mEq/kg DM, the Na and K urinary excretion was decreased by 89.69% and 46.06%, respectively. Similar results were reported by Hu and Murphy (Reference Hu and Murphy2004), who found a positive association of Na : creatinine and K : creatinine ratio with DCAD increase; which suggests that when DCAD increased it resulted in an higher urinary excretion of Na and K and, consequently, a lower Na and K retention in body fluids.
Conclusion
The ruminal pH linearly increased according to DCAD increase, which results in a higher ruminal digestion of dietary fiber (NDF), as ruminal concentrations of acetic acid and NDF total apparent digestibility increases as DCAD increased. Moreover, the increase of DCAD results in a higher blood pH, and reduces renal reabsorption and the efficiency of Na utilization to milk production. According to blood pH increase, the blood concentrations of Na, K and iCa are reduced, as well as the milk concentrations of these minerals. Thus, increasing DCAD reduces the efficiency of Na utilization to milk production. However, the milk concentrations of iCa cations are reduced according to blood pH increase, which can contribute to maintain milk stability during industrial heat treatment and ethanol test performed in dairy farms and dairy plants.
Acknowledgments
The authors are grateful to FAPESP (Fundação de Amparo à Pesquisa do Estado de São Paulo, São Paulo, Brazil) for the research funding (Proc. 2012/23212-0) and for scholarships (2012/22165-9; 2013/07041-4 and 2013/02227-2). They also thank Arlindo Saran Netto, Ives Cláudio da Silva Bueno, José Garcia Moreno Franchini, Lucinéia Mestieri and Priscila Sales Maldonado (University of São Paulo, Brazil) for technical assistance.