I. INTRODUCTION
The need for the materials with low thermal expansion coefficient and specific strength has led to great efforts and attentions in the research of ceramic particles reinforced magnesium matrix composites. Reference Miracle1–Reference Zhang, Zhang and Hu3 Compared with microparticle reinforced magnesium matrix composites, mechanical properties of nanoparticle reinforced magnesium matrix composites are enhanced while the elongation is still remained. Reference Liu, Zhang, Jiang, Ding, Sun, Sun and Ma4–Reference Abdizadeh, Ebrahimifard and Baghchesara6 In our previous study, semisolid stirring assisted ultrasonic vibration had been shown to be effective in achieving homogeneous dispersion of nanoparticles and enhancing mechanical properties of nanoparticle reinforced magnesium matrix composites. Reference Nie, Wang, Wu, Xu, Zheng and Hu7 However, the hexagonal close-packed (HCP) crystal structure of magnesium matrix and the addition of brittle ceramic particles could limit plastic forming ability of magnesium matrix composites at ambient temperatures. Thus, magnesium matrix composites reinforced with ceramic particles are usually deformed at high temperatures, where additional slip systems can be activated. Reference Deng, Li, Xu and Nie8
The hot workability also plays a very important role in hot deformation behavior of magnesium matrix composites reinforced with SiC nanoparticles. The constructive equations and processing maps can be used to reveal the deformation mechanism and describe workability of particulate reinforced magnesium matrix composites. Reference Prasad, Rao and Gupta2,Reference Li, Wang, Zeng, Liang and Liu9–Reference Zhong, Rao, Prasad, Zhao and Gupta12 Srinivasan et al. showed that the deformation mechanisms of AZ31B and AZ31 nanocomposite were dynamic recrystallization (DRX) and dynamic recovery (DRY), and determined the instability regions using processing maps. Reference Srinivasan, Loganathan and Narayanasamy11 The optimal region for hot working has been observed at a strain rate of 0.01 s−1 and the temperature of 673 K for both magnesium alloy and nanocomposite. Zhou et al. analyzed the hot deformation behavior and work ability of bimodal size SiCp/AZ91 magnesium matrix composite using processing map characteristics. Reference Zhou, Deng, Li and Nie13 Dislocation climb was thought to be the main deformation mechanism for bimodal size magnesium matrix composite. Liu et al. revealed that twinning and associated DRX were the dominant features of SiC/AZ31 nanocomposite at the initial stage of hot rolling. Reference Liu, Hu, Wang, Wu and Zheng14 Although a number of investigations have been studied on the hot deformation behavior of the commercial magnesium alloys, there is no report about mechanism and workability of SiC nanoparticles reinforced magnesium matrix composite especially prepared by semisolid stirring assisted ultrasonic vibration. Meanwhile, to optimize the forming processing parameters and control the microstructures of SiC nanoparticles reinforced magnesium matrix composite, it is necessary to investigate the effect of nanoparticles on processing map.
Accordingly, in this study the hot deformation behaviors of magnesium alloy reinforced with SiC nanoparticles are investigated by isothermal compression tests under wide ranges of forming temperature and strain rate. Constitutive equation was formulated relating the flow stress (r), strain rate
 $(\dot \varepsilon )$
, and temperature (T) during the hot deformation of samples. The effect of SiC nanoparticles on the workability of the matrix alloy was also discussed.
II. EXPERIMENTAL PROCEDURE
A. Materials and preparation
A commercial AZ91 magnesium alloy with nominal composition of Mg–9.07Al–0.68Zn–0.21Mn was selected as the matrix alloy, which was supplied by Northeast Light Alloy Company Limited, China. SiC nanoparticles with average diameter of 60 nm and volume fractions (vol%) of 1% were used as reinforcement, which were supplied by Hefei Kaier Nanometer Energy & Technology Company Limited, China. The SiCp/AZ91 nanocomposites billets were fabricated by semisolid stirring assisted ultrasonic vibration and then solute treatment at 688 K for 24 h (T4 treatment). The details of fabrication process were described in Ref. Reference Nie, Wang, Wu, Xu, Zheng and Hu7. First, about 1 kg of AZ91 alloy was melted at 720 °C under an atmosphere (a gas mixture of CO2/SF6), and then cooled to 590 °C at which the matrix alloy was in semisolid condition. SiC nanoparticles preheated to 550 °C were quickly added into the semisolid alloy using mechanical stirring. After stirring for 5 min, the melt was rapidly reheated to 700 °C and kept for 5 min. Then the stirrer was removed and ultrasonic probe was dipped into the melt for about 20 mm. The melt was ultrasonically processed for 20 min and cast into a preheated steel mold (450 °C) and allowed to solidify under a 100 MPa pressure. It should be noted that ultrasonic vibration was only used in molten nanocomposite. For comparison, die casting AZ91 was treated in the same conditions as a contrast.
B. Tensile test
Tensile test was carried out on an Instron Series 5569 test machine (Instron, Shanghai, China) at room temperature with the tensile rate of 0.5 mm/min. Three samples for repeat tensile tests were cut from each ingot and the tensile strength reported in the work was averaged from the three tensile tests.
C. Hot compression test
Cylindrical specimens of 8 mm in diameter and 12 mm in height were machined from the billets. The hot compression test was carried out using a Gleeble 3500 thermomechanical simulator (Data Sciences International, New Brighton, Minnesota). The specimens were lubricated with graphite to reduce the friction at the punch–specimen interface. The specimens were conductively heated to the designed temperature at a heating rate of 5 K/s before compression, and held at the constant temperature for 5 min to ensure that the temperature was homogeneous throughout the specimen. The final strain of all specimens was set as 0.6. When the specimen reached the designed strain, it was water-quenched quickly. For nanocomposite, the deformation temperature was designed from 523 K to 673 K with an interval of 50 K. For each temperature, the strain rate varied from 0.001 s−1 to 1 s−1. For comparison purposes, AZ91 alloy specimens were compressed at 573 K/0.001 s−1 and 523–673 K/0.01 s−1.
D. Microstructure characterization
The microstructure characterization was carried out by 4XC optical microscope (OM; Shanghai Optical Instrument Factory, Shanghai, China), MIRA 3 XMU scanning electron microscope (SEM; Tescan, Brno, Czech Republic) and transmission electron microscopy (TEM). The compressed samples were cut into two parts from the center plane of the samples along compression direction. Then they were ground, polished, and etched in acetic picral [5 mL acetic acid + 5 g picric acid + 10 mL H2O + 100 mL ethanol] to observe the characteristics of grains.
III. RESULTS AND DISCUSSION
A. Tensile properties
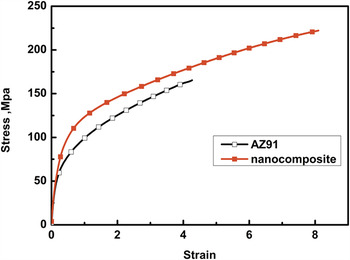
Figure 1 shows the engineering stress–engineering strain curves of the die cast AZ91 alloy and SiCp/AZ91 nanocomposites. It can be seen from Fig. 1 that the ultimate tensile strength, elongation to fracture of the SiCp/AZ91 nanocomposites are simultaneously enhanced compared with that of the die cast AZ91 alloy. The results reveal that the addition of SiC nanoparticles can improve the mechanical properties of the matrix efficiently. Young's modulus of AZ91 alloy and nanocomposite are 39 GPa and 41 GPa respectively. Since Young's modulus depends on chemical composition of material, the microstructure changes have no obvious effects on it. Nevertheless, the less concentration of the additional nanoparticles can not significantly improve the Young's modulus. Thus, Young's modulus of nanocomposites has a little change with the addition of only 1 vol% nanoparticles.
The engineering stress–engineering strain curves of AZ91 alloy and SiC/AZ91 nanocomposite at room temperature with the tensile rate of 0.5 mm/min.

B. Flow stress–strain curves
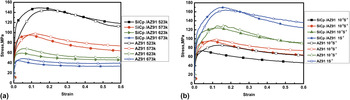
The true stress–strain curves of SiC/AZ91 nanocomposite and AZ91 alloy under different deformation conditions are depicted in Fig. 2. It is obvious that for a given temperature, flow stress of both alloy and its nanocomposite increases with increasing the strain during the whole deformation processing. The shape of the flow curve usually reflects microstructure evolution and deformation mechanism. For example, the fluctuation of the flow curve for 573 K/0.1 s−1 indicates that a typical repeated recrystallization due to the alternate of softening and hardening. In the work hardening stage, work hardening is in the dominant position. During the softening stage, strain accumulates to a certain extent and promotes the DRX, leading to the obvious drop of stress. At last, a new balance between work hardening and work softening is obtained in the steady stage. Before the peak stress, as shown in Fig. 2(a), the flow stress at the temperate range of 523–573 K is much higher than that of 623–673 K. This indicates that the work hardening is larger at the low temperature. The mobility of dislocations is relatively low at 523–573 K compared with that at 623–673 K, so the accumulation of dislocations occurs more easily. Besides, the extent of DRX and DRY is weak at low temperature compared with that at high temperature, resulting in a weak work softening effect at 523–573 K.
Ture stress–strain curves of SiC/AZ91 nanocomposite and AZ91 alloy: (a) at strain rate of 0.01 s−1, (b) at the temperature of 573 K.

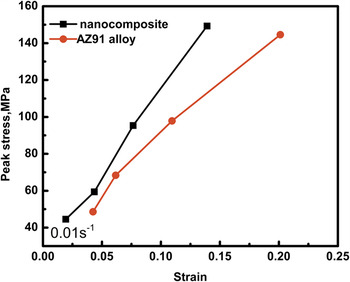
Figure 3 shows peak stress of nanocomposite and AZ91 alloy under different deformation temperature at 0.01 s−1. It can be found that the peak stress of nanocomposite achieved faster than that of the AZ91 alloy under the same deformation conditions. Before the peak stress stage, the generation and accumulation of dislocations can occur on the grain boundaries with the addition of SiC nanoparticles, leading to the higher hardening rate. Thus, the stress for the nanocomposite rises steeply at micro strain.
Peak stress versus strain for nanocomposite and AZ91 alloy under deformation conditions of 0.01 s−1 and different temperatures.

C. Microstructure
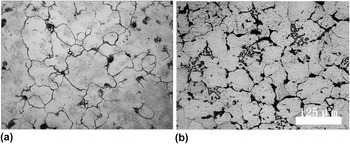
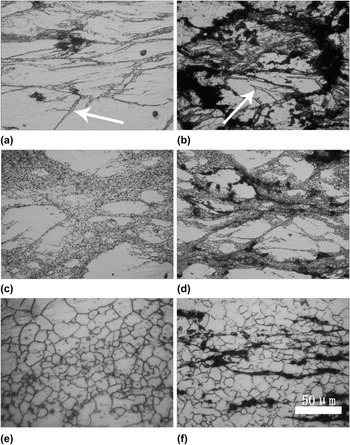
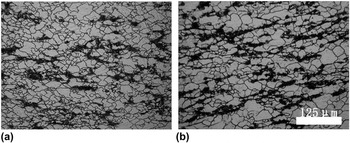
Figure 4 displays microstructures of as-cast AZ91 alloy and nanocomposite. Before deformation processing, the grain size of AZ91 is obviously coarser than that of the nanocomposite as shown in Figs. 4(a) and 4(b). The microstructures of AZ91 alloy and nanocomposite compressed at different temperatures and strain rates are given in Fig. 5. In Figs. 5(a) and 5(b) deformation twins form at low temperatures in both AZ91 alloy and nanocomposite. For the AZ91 alloy, the hindered dislocations produce stress fields and induce twins at low temperature as shown in Fig. 5(a). Especially, for the nanocomposite deformation twins occur mainly at the accumulation region of nanoparticles as displayed in Fig. 5(b). This indicates that the major cause of deformation twins is local stress induced by agglomerated nanoparticles. With the increase of the temperature and the decrease of deformation rate, the grains grow in both alloy and nanocomposite. It can be found that the DRX can incur significant grain refinement of AZ91 alloy in comparison to nanocomposite after hot compression as shown in Figs. 5(e) and 5(f). This result shows that the addition of SiC nanoparticles cannot significantly refine grains. Moreover, grain refinement via particle stimulated nucleation cannot be expected for the current nanocomposite, because the reinforcement particle size is less than 1 μm. Reference Inem15–Reference Humphreys17
As-cast microstructures of (a) AZ91 alloy (b) nanocomposite.

Microstructures of nanocomposite and alloy compressed at different temperatures and 0.01 s−1: (a) (c) (e) AZ91 alloy, deformed at 523 K, 573 K, 623 K, respectively. (b) (d) (f) nanocomposite, deformed at 523, 573, 623 K, respectively.

In general, the strengthening mechanisms of composite materials include fine-grain reinforcing, dispersal reinforcing, dislocation strengthening, and load transfer function. The fine-grain reinforcing is related to the grain size while the dislocation strengthening mechanisms depend on the dislocation density after the deformation processing. Load transfer function is associated with the volume fraction of reinforced phase, while dispersion strengthening mechanism may be induced only with particle size less than 1 μm. In addition, dispersion strength mechanism increases with the addition of body volume fraction or the decrease of the grain distance. In the present work, the strengthening mechanism of as-cast AZ91 alloy without the addition of SiC nanoparticles can be attributed to the fine-grain reinforcing and dislocation strengthening. However, the addition of nanometer SiC particles can easily flow along with the metal substrate during the high temperature deformation, leading to the weakening of strengthening mechanism. In our previous work, the strengthening mechanism of 1 vol% SiCp/AZ91 nanocomposite could be identified as Hall–Petch and Orowan strengthening mechanism. Reference Nie, Wang, Hu, Xu, Wu and Zheng18 Moreover, researches have shown that the development of texture could be changed by the addition of particle reinforcements. Garces et al. Reference Garces, Rodriguez, Perez and Adeva19 and Wang et al. Reference Wang, Yu and Wang20 reported that the presence of micrometre size ceramic particle reinforcements reduce the intensity of the crystallographic texture and basal texture in the Mg matrix. Tun et al. revealed that the addition of nanometer ZnO particle reinforcements can also reduce the basal intensity in the magnesium matrix composites. Reference Tun, Jayaramanavar, Nguyen, Chan, Kwok and Gupta21 Thus, the insignificant change of flow stress between AZ91 and nanocomposite can be attributed to the above reasons in the current work.
D. Kinetic analysis
In hot working research, constitutive equation is a significant mathematical method to describe the relationship of flow stress (σ), strain rate
 $(\dot \varepsilon )$
, and temperature (T).
Reference Mirzadeh, Cabrera and Najafizadeh22
Based on previous researches, the power law relationship is generally applied in the hot deformed alloys at low stress level,
Reference Shao, Xiao, Wang, Ma, Liu and Yang23
while the exponential law relationship is used at high stress level.
Reference Galiyev, Kaibyshev and Gottstein24
In contrast, the hyperbolic sine law, in which both power and exponential law are involved, can be applied at a wider stress range.
Reference Zhu, Jin, Zhao, Wang, Han and Fei25,Reference Liu and Ding26
Thus, in the present study, the hyperbolic sine law is used to describe the hot deformation behavior, which can be described by Eqs. (1)–(5) respectively:
 $$\dot \varepsilon = {\rm A}\sigma n\exp \left( { - {Q \over {RT}}} \right)$$
 $$\dot \varepsilon = {\rm A}'\exp \left( {\alpha \beta } \right)\exp \left( { - {Q \over {RT}}} \right)$$
 $$\dot \varepsilon = {\rm A}''\left( {\sinh \left( {\alpha \sigma } \right)} \right)n'\exp \left( { - {Q \over {RT}}} \right)$$
 $${\rm Z} = \dot \varepsilon \exp \left( { - {Q \over {RT}}} \right)$$
 $$Q = R{\left( {{{\partial \ln \left( {\sinh \left( {\alpha \sigma } \right)} \right)} \over {\partial \left( {{1 \mathord{\left/ {\vphantom {1 T}} \right. \kern-\nulldelimiterspace} T}} \right)}}} \right)_{\dot \varepsilon }}{\left( {{{\partial \ln \dot \varepsilon } \over {\partial \ln \left( {\sinh \left( {\alpha \sigma } \right)} \right)}}} \right)_T}$$
where A (A′, A″), α and β are material constant, n(n′) is the stress exponent, T is the absolute temperature, Q is the activation energy, R is the gas constant, and Z is the Zener–Hollomon parameter (temperature compensated strain rate). Here, the values of n and Q are usually assumed to be independent of temperatures and stains. Reference Ning, Fu and Chen27,Reference Han, Liu, Zou, Liu and Qiao28 The values of A (A′, A″), n(n′) and β can be produced by the plots of lnZ − ln(σ0.2), lnZ − σ0.2, and lnZ − ln(sinh(ασ)), respectively. The value of n(n′) is determined through the relation of these plots's slope. The value of A (A′, A″) is obtained from β value and the intercept. However, the values of α and Q need to be first determined. The activation energy Q calculated by the hyperbolic sine law can be obtained by Eq. (5). The value of α can be deduced by β/n. In this study the strain of 0.2 is taken as an example to calculate the material parameters of the constitutive equation.
Figure 6 shows the results obtained by hyperbolic sine law. Figure 6(a) displays the plot of
 $\ln (\dot \varepsilon )$
against ln(sinh(ασ)) according to the hyperbolic sine law. The values of A″ and n′ are obtained according to the plot. All the points distribute on straight lines and all the straight lines are almost parallel to each other. Thus, it is reasonable to use the hyperbolic sine law to describe the hot deformation of the present nanocomposite. Figure 6(b) gives the plot of lnZ against ln(sinh(ασ)) according to the hyperbolic sine law. It can be found that there is a good linear relationship between lnZ versus ln(sinh(ασ)). According to the plot, the values of A″ and n′ for the nanocomposite materials are 1.21 × 10¹⁴ and 4.6, respectively. The values of A and n for the AZ91 are determined as 2.1 × 10¹⁷ and 6.9, respectively. Figure 6(c) illustrates the comparison between the measured and predicted stress values under different compression conditions. The obtained correlation coefficient R (0.98903) of lnZ versus ln(sinh(ασ)) is approximately equal to 1, which means that the measured values match well with the calculated value. Furthermore, most relative errors are below 7% which further confirms that the hyperbolic sine law can be applied over entire stress range for the nanocomposite tested in this study.
(a) Plot of
 $\ln (\dot \varepsilon )$
− lnσ0.2 and the calculated n value for nanocomposite (b) plot of lnZ versus lnσ0.2 based on the hyperbolic law for nanocomposite (c) comparison between calculated and measured σ0.2 values for nanocomposite.

In the process of hot deformation activation energy is an important physical parameter to understand the mechanism of plastic deformation. The estimated values for the average activation energy (Q) for AZ91 alloy and nanocomposite are estimated to be 207.96 kJ/mol and 184.6 kJ/mol respectively, which are much greater than the self-diffusion activation energy of 135 kJ/mol for the pure magnesium. Reference Vagarali and Langdon29 In general, it is believed that when the activation energy is greater than that for lattice self-diffusion, the DRX originated dislocation climb/slip is the main controlling deformation mechanism. Reference Zhu, Zeng, Feng, Sun, Han and Zhou30 Dislocation accumulation in low angle grain boundaries increases their misorientation, which makes the low angle grain boundaries transform into large grain boundaries. Therefore, the deformation mechanisms for the present 1 vol% SiCp/AZ91 nanocomposite and AZ91 alloy should be dominated by DRX. This predominant deformation mechanism of the nanocomposite is further confirmed by the metallographic observations of the deformed specimens in Sec. III. C. By comparing the AZ91 alloy with nanocomposite, it can be found that deformation ability of nanocomposite is much better than that of AZ91 alloy. The deformation activation energy of nanocomposite is less than that of AZ91 alloy, which can be attributed to the different microstructures of two materials in the process of hot deformation. The addition of SiC nanoparticles to magnesium matrix leads to more fine grains in the nanocomposite during hot deformation. A large number of grain boundaries in the nanocomposite facilitate the atom diffusion. So the deformation activation energy of the nanocomposite is reduced compared with that of the AZ91 alloy. The kinetic analysis has been carried out to evaluate the empirical values such as A, n, and Q using experimental data. The resultant constitutive equation for AZ91 alloy and nanocomposite can be represented as:
 $$\dot \varepsilon = 2.1 \times 1{0^{17}}{\left[ {\sinh \left( {0.00836\sigma } \right)} \right]^{6.9}}\exp \left( { - {{207.96} \over {RT}}} \right)\quad \,\left( {{\rm{AZ}}91} \right)$$
 $$\dot \varepsilon = 1.2 \times 1{0^{14}}{\left[ {\sinh \left( {0.01296\sigma } \right)} \right]^{4.6}}\exp \left( { - {{184.6} \over {RT}}} \right)\quad \,\left( {{\rm{nanocomposite}}} \right)$$
E. Processing maps
Processing map is an explicit representation of the response of a material to the imposed processing parameters, which consists of a superimposition of a power dissipation map and an instability map. The high value of η in dissipation map is associated to the larger amount of power dissipation. Namely, material dissipates more energy on the microstructure changes as the DRX, which is considered to be the best deformation mechanism. But at the same time, the defects such as cracks and/or deformation bands may also lead to the high value of η, which may cause instable flow. Reference Srinivasan, Loganathan and Narayanasamy11 Therefore, power dissipation map need to be overlaid with instability map, to select safe domains with peak efficiency. Processing maps are developed on the basis of dynamic material model (DMM) Reference Prasad and Sasidhara31 and was firstly proposed by Prasad et al. Reference Prasad, Gegel, Doraivelu, Malas, Morgan, Lark and Barker32 m is the strain rate sensitivity since:
 $$m = {\left| {{{\partial \left( {\ln \sigma } \right)} \over {\partial \ln \left( {\dot \varepsilon } \right)}}} \right|_{\varepsilon ,T}}\quad .$$
The efficiency of power dissipation occurring through microstructural changes during deformation as a function of temperature and strain rate is given by Eq. (7):
 $$\eta = {{2m} \over {m + 1}}\quad .$$
The variation of the efficiency related to temperature and strain rate constitutes a dissipation efficiency map, which exhibits different domains that may be correlated with specific microstructure processes. The domain of DRX is chosen for the hot working of material because this domain yields good workability and microstructures free from defects and instabilities. The extremum principle of irreversible thermodynamics is applied to continuum mechanics of large plastic flow to define the stability criterion developed by Prasad and Seshacharyulu. Reference Prasad and Seshacharyulu33 Thus, a dimensionless parameter for microstructural instability is given as follows as discussed elsewhere. Reference Sen, Kottada and Ramamurty34
 $$\zeta = {{\partial \ln \left( {{m \over {m + 1}}} \right)} \over {\partial \ln \dot \varepsilon }} + m \;\lt\; 0\quad .$$
The variation of ζ with strain rate and temperature makes an instability map. The flow instabilities are mainly in adiabatic shear bands or flow localizations in the microstructure. A colored plot of power dissipation and a red line plot of flow instability are drawn. This map defines the regimes of flow instability where
 $\zeta (\dot \varepsilon ) \;\le\; 0$
.
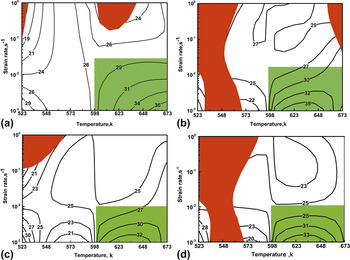
Figure 7 shows the processing maps at strain levels of 0.2, 0.3, 0.4, and 0.5 constructed by using the flow stress data obtained in the compression tests. It can be easily observed that all the processing maps with different strain exhibit a major safe domain marked by green-shadowed with peak efficiency. The safe domain occurs within the 600–673 K/0.001–0.018 s−1 with the η > 27% (at the strain rate 0.001–0.018 s−1 and the temperature of 600–673 K). The counter numbers represent the efficiency of power dissipation in percentage and the red areas are the flow instability region. The power dissipation efficiency decreases with increasing the strain, which is mainly attributed to the microstructure evolution of the nanocomposite during hot deformation process. It demonstrates that the power dissipation maps at the strain of 0.2–0.5 are similar in terms of contour shape. Many researches indicate that the value of η corresponding to the DRX is about 30–50%. Reference Selvam, Marimuthu, Narayanasamy, Senthilkumar, Tun and Gupta35 It can be seen that the value of η in the green domain is equal to or greater than 30% at strain of 0.2, 0.3, 0.4, and 0.5. Thus, in those domains, the prime deformation mechanism is DRX. This prediction is accordant to the activation energy analysis in Sec. III. D. The average value of η in the safe domain is less than that of fine-grained SiCp/AZ91 composite. Reference Deng, Li, Xu and Nie8 Based on the definition of η value, nanometer SiCp may not promote DRX compared to micrometer SiCp. However, the instability maps show distinct difference at the stain of 0.2–0.5. In Fig. 7(a), the instability area locates at high strain rate region. The peak efficiency is 36% at 673 K/0.001 s−1. In Fig. 7(b), the instability area concentrates in low temperature region. The variation of instability areas with strain indicates that the instability mechanism is sensitive to strain.
Processing maps at different strains for nanocomposite: (a) 0.2, (b) 0.3, (c) 0.4, (d) 0.5.

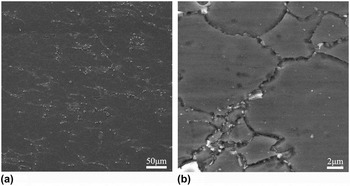
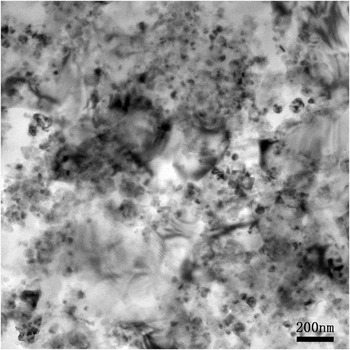
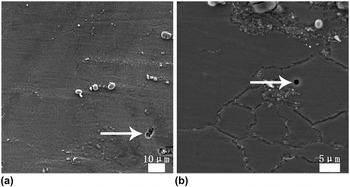
Figure 8 is the SEM of the nanocomposite deformed at 523 K and 0.001 s−1. Figure 8(b) is the high magnification of Fig. 8(a). The SiC particles accumulated at the particle/grain boundaries and some particles were found to be dispersed in the grain interior as shown in Fig. 8(b). Figure 9 shows the TEM microstructure of nanocomposite at 523 K × 1 s−1. Although some reinforcing particles are in clustered form, a majority of dispersed SiC particles can be also observed at grain boundaries or in grain interiors. A large number of dislocations appear in clustered nanoparticles. This indicates that the clustered nanoparticles can fix the dislocations effectively and hinder recrystallization grain growth. K.S. Tunit et al. found that the clustered/agglomerated particles were playing an important role in grain boundary pinning. Reference Shao, Xiao, Wang, Ma, Liu and Yang23 Figure 10 demonstrates the microstructures of the nanocomposite deformed under different conditions. As shown in Figs. 10(a) and 10(b), the grain size inhomogeneity of the nanocomposite deformed at 623 K and 0.001 s−1 is more obvious compared with that of the nanocomposite deformed at 673 K and a strain rate of 0.001 s−1. On Deng et al.'s investigation of the workability of fine-grained SiCp/AZ91 composite, Reference Deng, Li, Xu and Nie8 the optimum process conditions for fine-grained micron-SiCp/AZ91 composite mainly located in low temperatures/low-strain-rate regions. In the present work the safe optimum concentrates on high temperatures/low-strain-rate regions (523–673 K/0.018–0.001 s−1). This reveals that high temperature can accelerate DRX and nanometer SiCp can hinder migration of grain boundary. Thus, the grains cannot grow coarsen at high temperature, which ultimately avoids microstructure instability. This result is similar to the workability of the Mg-0.5% vol. ZnO composite reported by B. Selvam et al. Reference Selvam, Marimuthu, Narayanasamy, Senthilkumar, Tun and Gupta35 As shown in Fig. 11, pores can be found in the nanocomposite deformed at 0.1 s−1 under different temperature, which indicates that defects can be formed under the higher strain rate and cause the instability of the material.
SEM microstructure of nanocomposite at 523 K × 0.001 s−1. (a) At low magnification; (b) at high magnification.

TEM microstructure of nanocomposite at 523 K × 1 s−1.

Microstructures of nanocomposite compressed at different temperatures and strain rates: (a) 0.001 s−1 × 623 K, (b) 0.001 s−1 × 673 K.

SEM microstructure of nanocomposite: (a) at 623 K × 0.1 s−1; (b) at 673 K × 0.1 s−1.

Although many scholars have studied the hot working performance of the composites, affecting factors of processing map were not given. Figure 12 shows the safe processing regions of different materials at the strain of 0.5. With the addition of the particle reinforcement, the high temperature deformation ability of composites is enhanced at low strain rate areas. The microscopic organization corresponding to optimum processing parameters was related to fine grains with uniform distribution. At the low deformation rate, the highest temperature of safe area among four materials is nanocomposite while the lowest temperature was related to AZ91 alloy. This indicates that SiC nanoparticles can promote high temperature deformation ability most efficiently. The grain size of nanocomposite, fine-grained bimodal microc-composite (FBMC), and bimodal microccomposite (BMC) are 95 μm, 1.2 μm, and 8 μm, respectively. The comparison of FBMC with BMC reveals that the finer grain size is associated with the lower processing region temperature. Because DRX exist in the processing region, fine grains have more grain boundaries which can provide DRX nucleation. So fine-grain structure with uniform distribution was obtained. However, nanometer SiC particle has a strong pinning effect on grain boundaries, which can prevent grain coarsening and make nanocomposite own good high temperature deformation ability.
Safe areas of different materials at strain of 0.5.

IV. CONCLUSIONS
On the basis of microstructure observation and stress–strain behavior analysis, the following conclusions can be drawn from the SiCp/AZ91 nanocomposite compressed at elevated temperatures:
-
(1) The SiCp/AZ91 nanocomposite reaches the peak stress faster and the nanometer SiCp can promote accumulation of strain by pinning dislocation.
-
(2) The deformation mechanism for the 1 vol% SiCp/AZ91 nanocomposite and AZ91 alloy should be dominated by DRX.
-
(3) The optimum processing conditions for SiCp/AZ91 nanocomposite mainly concentrate at 523–673 K/0.018–0.001 s−1. The maximum power dissipation efficiency is found to be 36% at a temperature of 673 K and a strain rate of 0.001 s−1.
-
(4) Nanometer SiC particles can effectively promote high temperature deformation ability of nanocomposite.
ACKNOWLEDGMENTS
This work was supported by “National Natural Science Foundation of China” (Grant nos. 51401144, and 51201112), and the “Natural Science Foundation of Shanxi” (Grant nos. 2015021067 and 2013021013-3).