





Mental health challenges pose a significant barrier to success in higher education. Reference Duffy, Keown-Stoneman, Goodday, Horrocks, Lowe and King1 Students experiencing mental distress are less likely to perform well academically or graduate to professional employment. Reference Chu, Liu, Takayanagi, Matsushita and Kishimoto2,Reference Porru, Schuring, Hoogendijk, Burdorf and Robroek3 In the UK, the rate of students disclosing a mental health condition at university enrolment has tripled in 7 years. Reference Sanders and Ellingwood4 While this rise may be due to universities making it easier to disclose mental difficulties, there is also evidence of increasing complexity in needs and a challenge for support services to meet these within existing systems. Reference Hughes, Priestley and Spanner5 It has been argued that universities must adopt proactive, public health approaches that encourage students to prioritise their mental health. Reference Dooris, Powell and Farrier6 However, the evidence base for what types of support are actually effective in protecting and promoting student mental health within diverse student populations is limited. Reference Upsher, Prabhakar, Damjanovic, Conner, Ward and Rakow7
One of the challenges of designing appropriate support is that risk factors are multifactorial: certain students are more at risk of mental health difficulties due to certain characteristics or life experiences, but there are also university cultures or environments, or student lifestyles, such as engaging in substance use, that are associated with worse mental health. Reference Duffy, Keown-Stoneman, Goodday, Horrocks, Lowe and King1,Reference Duffy8 There is initial evidence that proactive well-being or support services that target certain groups could be beneficial. Reference Foster9 However, understanding university or lifestyle factors that affect student mental health allows universities to change policies or structures, or provide time and space for healthy behaviours, which will benefit not only the most at-risk students but also the wider student population. Reference Dooley, Okobia, Alsaadi, Bate, Hyde and Prajapati10 It is this aim that is central to the whole-university approach to student mental health: a framework at the heart of the UK University Mental Health Charter, Reference Hughes and Spanner11 which champions not only more effective and individualised well-being services, but also structural changes that encourage connection and compassion. However, as of yet, evidence is scarce as to what changes may be most effective. Reference Upsher, Prabhakar, Damjanovic, Conner, Ward and Rakow7 While there have been other mental health surveys in the UK, Reference Campbell, Blank, Cantrell, Baxter, Blackmore and Dixon12,Reference Chen and Lucock13 there has not been a study specifically aiming to disentangle the differential associations of modifiable and non-modifiable factors on university student mental health.
Nurture-U is funded by UK Research and Innovation (UKRI) and is a research project aiming to provide evidence on which elements of a whole-university approach to student well-being are most beneficial to students. The Nurture-U survey, adapted from the Canadian U-Flourish Survey, Reference Goodday, Rivera, Foran, King, Milanovic and Keown-Stoneman14 is a longitudinal study, using standardised measures collected at the start and end of 3 consecutive academic years. This paper presents cross-sectional analysis of baseline survey data collected in the autumn terms from 2022 to 2024. We conducted hierarchical regression analyses to examine the relationships between demographic factors, family history, university factors and lifestyle with student mood, anxiety and well-being, thus providing evidence-based grounding for the development of initiatives to protect and improve student mental health.
Method
Data collection
The Nurture-U survey ran at the Universities of Exeter, Southampton, Cardiff, Oxford and Newcastle. Data collection methods are described in the Nurture-U protocol, Reference Marshall, Duffy, Chamberlain, Dooley, Dorey and Forty15 and included email, in-person advertising and social media. One site targeted first years for recruitment; the rest targeted all current students. Students were recruited to the baseline survey at the start of each academic year from 2022–2024, and invited to take part in the follow-up survey in the autumn and spring for the rest of their studies. If students accidentally took the baseline survey more than once, the first survey was used as baseline, and subsequent surveys were recorded as follow-up surveys. Additionally, responses were linked to student numbers prior to cross-site anonymisation, ensuring identification and removal of duplicates. Written consent was obtained from all participants prior to survey completion.
The authors assert that all procedures contributing to this work comply with the ethical standards of the relevant national and institutional committees on human experimentation and with the Helsinki Declaration of 1975, as revised in 2013. All procedures were approved at each university site: Exeter (FHLS Psychology Research Ethics Committee, 519175), Cardiff (Wales Research Ethics Committee, IRAS reference: 155838, REC reference: 16/WA/0323), Newcastle (Faculty of Medical Sciences Research Ethics Committee, 24735/2022), Oxford (Medical Sciences Interdivisional Research Ethics Committee, Ref. R60998) and Southampton (Faculty of Medicine Ethics Board, ERGO 73178).
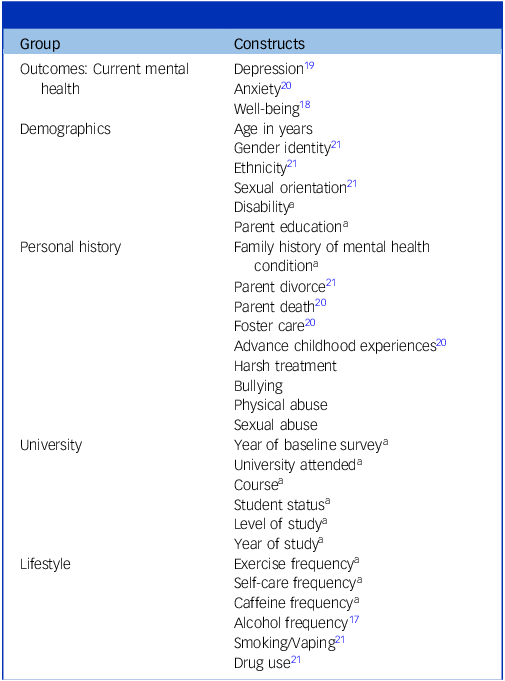
The measures (Table 1) included standardised questionnaires measuring mental health and well-being, Reference Bifulco, Brown and Harris16–Reference Spitzer, Kroenke and Williams20 items from the Wellbeing, Health and Mental Health International College Student questionnaire (WHM-ICS) adapted to align with UK census categories Reference Cuijpers, Auerbach, Benjet, Bruffaerts, Ebert and Karyotaki21 and single-item questions created by the team.
Included measures

Table 1 Long description
A table categorizing constructs related to mental health, demographics, personal history, university, and lifestyle. The table has five main groups: Outcomes: Current mental health, Demographics, Personal history, University, and Lifestyle. Each group lists specific constructs. Outcomes: Current mental health includes Depression, Anxiety, and Well-being. Demographics include Age in years, Gender identity, Ethnicity, Sexual orientation, and Disability. Personal history includes Parent education, Family history of mental health condition, Parent divorce, Parent death, Foster care, Advance childhood experiences, Harsh treatment, Bullying, Physical abuse, and Sexual abuse. University includes Year of baseline survey, University attended, Course, Student status, Level of study, and Year of study. Lifestyle includes Exercise frequency, Self-care frequency, Caffeine frequency, Alcohol frequency, Smoking/Vaping, and Drug use.
a. Single-item questions created by the research team.
Analysis
Linearity and normality were evaluated using residual plots and Q-Q plots. No major violations were observed. Breusch–Pagan tests indicated heteroskedasticity. Missing data were addressed using multiple imputation by chained equations (MICE). Reference Buuren and Groothuis-Oudshoorn22 Participants with >80% missing data were deleted prior to imputation. All described variables were included. A total of 20 imputed data-sets were generated, and analyses were performed on each data-set separately. Robust standard errors were calculated for each imputed data-set using heteroskedasticity-consistent covariance estimators and pooled using Rubin’s Rules. Reference Rubin23 All analyses were conducted in R v3.18.0 for Windows (version 4.5.0, R Foundation for Statistical Computing, Vienna, Austria; https://www.r-project.org/).
Hierarchical linear regression models were used to assess the association of each set of variables – demographic (model 1), history (model 2), university (model 3) and lifestyle (model 4) – with continuous-scale totals for depression, measured using the Patient Health Questionnaire-9 (PHQ-9), Reference Kroenke, Spitzer and Williams19 anxiety, measured using the Generalised Anxiety Disorder-7 (GAD-7) Reference Spitzer, Kroenke and Williams20 and well-being, measured using the Warwick–Edinburgh Mental Well-being Scale (WEMWBS). Reference Clarke, Friede, Putz, Ashdown, Martin and Blake18 The ordering and grouping for these models were theory-informed, based on previous work in this area on the Canadian sample, which included student-led research priorities and survey design. Reference Duffy, Keown-Stoneman, Goodday, Horrocks, Lowe and King1 Model performance was evaluated at each step using adjusted R 2 and pooled F-tests.
Hierarchical logistic regression models were used to assess the contribution of the same four sets of predictors to binary mental health outcomes using established clinical cut-off points, indicating moderate to severe depression (PHQ-9 > 9) and anxiety (GAD-7 > 9). McFadden’s pseudo-R 2 and likelihood ratio tests (LRTs) were used to compare model performance at each stage of stepwise regression.
Results
A total of 14 172 students consented to complete the survey. After deleting those with >80% missing data (1869 students; 13.2%), of the remaining 12 303 participants, 10 448 (84.9%) had <10% missing data; no participants had >50% missing data.
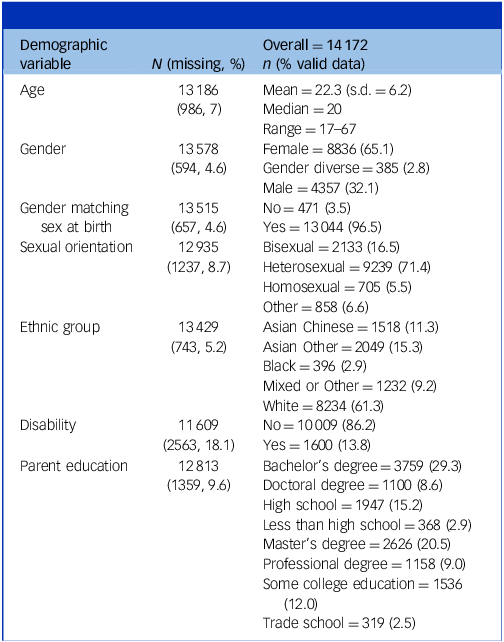
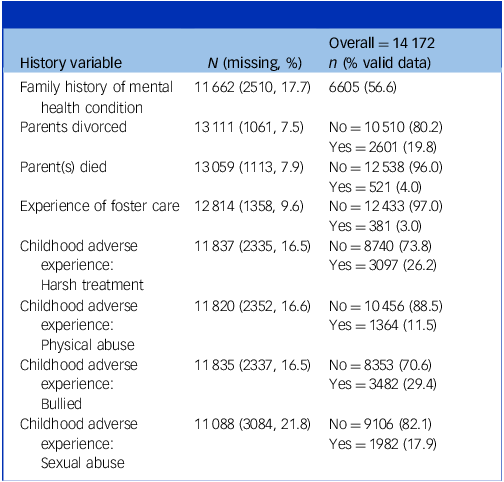
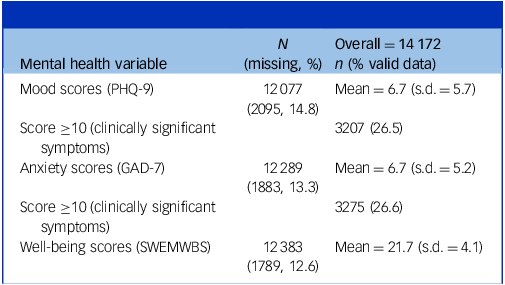
Participants were predominantly female (65.1%), White (61%) and heterosexual (71.4%) (Table 2). Over half (56.6%) had a family history of a mental health condition (Table 3). Just over a quarter of students reported moderate/severe depressive symptoms, with similar numbers for anxiety (Table 4).
Demographics

Table 2 Long description
A table summarizing demographic data of participants. The table has 14172 participants with valid data. It includes 10 rows and 3 columns. Column headers are N (missing), and Overall (n, % valid data). Row labels are Age, Gender, Gender matching sex at birth, Sexual orientation, Ethnic group, Disability, and Parent education. Row 1: Age, 13186 (986, 7 percent), Mean = 22.3 (s.d. = 6.2), Median = 20, Range = 17–67. Row 2: Gender, 13578 (594, 4.6 percent), Female = 8836 (65.1 percent), Gender diverse = 385 (2.8 percent), Male = 4357 (32.1 percent). Row 3: Gender matching sex at birth, 13515 (657, 4.6 percent), No = 471 (3.5 percent), Yes = 13044 (96.5 percent). Row 4: Sexual orientation, 12935 (1237, 8.7 percent), Bisexual = 2133 (16.5 percent), Heterosexual = 9239 (71.4 percent), Homosexual = 705 (5.5 percent), Other = 858 (6.6 percent). Row 5: Ethnic group, 13429 (743, 5.2 percent), Asian Chinese = 1518 (11.3 percent), Asian Other = 2049 (15.3 percent), Black = 396 (2.9 percent), Mixed or Other = 1232 (9.2 percent), White = 8234 (61.3 percent). Row 6: Disability, 11609 (2563, 18.1 percent), No = 10009 (86.2 percent), Yes = 1600 (13.8 percent). Row 7: Parent education, 12813 (1359, 9.6 percent), Bachelor’s degree = 3759 (29.3 percent), Doctoral degree = 1100 (8.6 percent), High school = 1947 (15.2 percent), Less than high school = 368 (2.9 percent), Master’s degree = 2626 (20.5 percent), Professional degree = 1158 (9.0 percent), Some college education = 1536 (12.0 percent), Trade school = 319 (2.5 percent).
History

Table 3 Long description
A table with 14172 participants, showing the number of missing responses and the percentage of valid data for various categories related to family history of mental health conditions and adverse childhood experiences. The table has 11 rows and 3 columns. Column headers are N (missing), Overall, and (n, % valid data). Row labels include Family history of mental health condition, Parents divorced, Parent(s) died, Experience of foster care, Childhood adverse experience: Harsh treatment, Childhood adverse experience: Physical abuse, Childhood adverse experience: Bullied, and Childhood adverse experience: Sexual abuse. Each row provides the number of missing responses, the total number of participants, and the percentage of valid data for each category. Notable trends include a high percentage of valid data for parents divorced (80.2%) and a lower percentage for childhood adverse experience: Sexual abuse (82.1%).
Mental health

Table 4 Long description
A table summarizing mental health scores and symptoms among participants. The table has four rows and three columns. Column headers are N (missing), Overall = 14 172 (n=% valid data). Row labels are Mood scores (P H Q-9), Score ≥10 (clinically significant symptoms), Anxiety scores (G A D-7), Score ≥10 (clinically significant symptoms), Well-being scores (S W E M W B S). Row 1: N (missing) 12 077 (2 095, 14.8 percent), Overall = 14 172 (n=% valid data) Mean = 6.7 (s.d. = 5.7), 3 207 (26.5 percent). Row 2: N (missing) 12 077 (2 095, 14.8 percent), Overall = 14 172 (n=% valid data) 3 207 (26.5 percent), empty. Row 3: N (missing) 12 289 (1 883, 13.3 percent), Overall = 14 172 (n=% valid data) Mean = 6.7 (s.d. = 5.2), 3 275 (26.6 percent). Row 4: N (missing) 12 289 (1 883, 13.3 percent), Overall = 14 172 (n=% valid data) 3 275 (26.6 percent), empty. Row 5: N (missing) 12 383 (1 789, 12.6 percent), Overall = 14 172 (n=% valid data) Mean = 21.7 (s.d. = 4.1), empty.
PHQ-9, Patient Health Questionnaire-9; GAD-7, Generalised Anxiety Disorder-7; SWEMWBS, Short Warwick-Edinburgh Mental Well-being Scale.
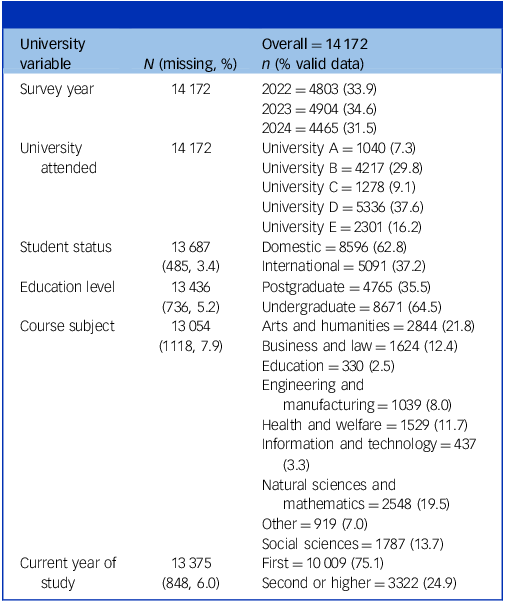
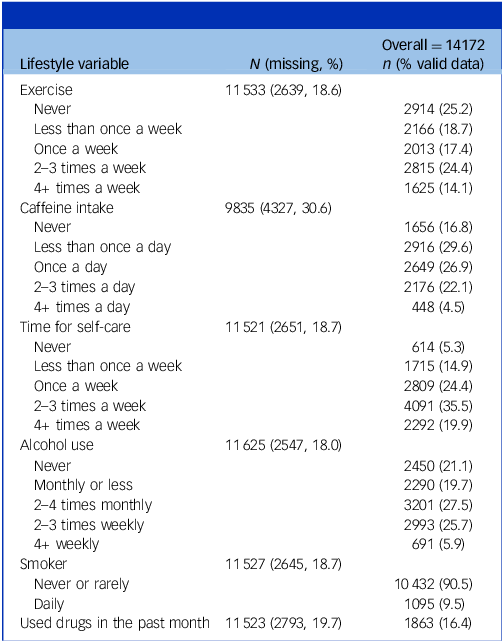
Participants were primarily home students (63%) and undergraduates (64.5%). Three-quarters of participants were in their first year of study (Table 5). A quarter of students reported never exercising, and a fifth reported never or less than weekly putting time aside for self-care (Table 6). A third of students reported drinking alcohol more than once a week, 9.5% reported smoking or vaping daily. Approximately 16% of the sample reported recent drug use.
University factors

Table 5 Long description
A table summarizing university factors among students. The table has 14172 valid data points across various categories. Survey year includes 2022 with 4803 participants (33.9%), 2023 with 4904 participants (34.6%), and 2024 with 4465 participants (31.5%). Universities attended include University A with 1040 participants (7.3%), University B with 4217 participants (29.8%), University C with 1278 participants (9.1%), University D with 5336 participants (37.6%), and University E with 2301 participants (16.2%). Student status includes domestic with 8596 participants (62.8%) and international with 5091 participants (37.2%). Education level includes postgraduate with 4765 participants (35.5%) and undergraduate with 8671 participants (64.5%). Course subjects include arts and humanities with 2844 participants (21.8%), business and law with 1624 participants (12.4%), education with 330 participants (2.5%), engineering and manufacturing with 1039 participants (8.0%), health and welfare with 1529 participants (11.7%), information and technology with 437 participants (3.3%), natural sciences and mathematics with 2548 participants (19.5%), other with 919 participants (7.0%), and social sciences with 1787 participants (13.7%). Current year of study includes first year with 10009 participants (75.1%) and second or higher year with 3322 participants (24.9%).
Lifestyle

Table 6 Long description
A table summarizing lifestyle habits of participants. The table has 6 rows and 3 columns. Column headers are N (missing), Overall (N = 14172), and N (% of valid). Row labels include Exercise, Caffeine intake, Time for self-care, Alcohol use, Smoker, and Used drugs in the past month. Each row label has multiple subcategories with corresponding values. For example, under Exercise, subcategories include Never, Less than once a week, Once a week, 2-3 times a week, and 4+ times a week. The table provides the number of participants and the percentage of valid responses for each subcategory.
Regression results
Coefficients for the final linear regression models are presented in Table 7. For all three outcomes, each step of the hierarchical regression significantly improved model fit (all p < 0.001; see Supplementary Table 1 for full model comparisons). The findings of the hierarchical logistic regressions exploring associations with binary outcomes using established clinical cut-off points on the depression and anxiety scales were very similar to the linear regressions and hence will not be discussed in detail in this paper (see Supplementary Table 2 for details).
Linear regression outputs

Table 7 Long description
The table presents coefficients for the final linear regression models. It includes three main sections: Time PHQ-9 Score, Time GAD-7 Score, and Time SHAI Suicidal Ideation Score. Each section has multiple rows and columns with specific coefficients and their confidence intervals. The table is divided into different categories such as Constant, Demographic variables, Maternal factors, Childhood experience of harm, and more. Each row represents a different variable, and each column shows the coefficients and confidence intervals for the respective outcomes. The table provides detailed statistical outputs for understanding the associations between various factors and the outcomes measured by PHQ-9, GAD-7, and SHAI scores.
PHQ-9, Patient Health Questionnaire-9; GAD-7, Generalised Anxiety Disorder-7; SWEMWBS, Short Warwick-Edinburgh Mental Well-being Scale.
a. Polynomial contrasts represent linear (.L), quadratic (.Q), cubic (.C), and quartic (^4) trends for ordinal variables.
*p < 0.05, **p < 0.01, ***p < 0.001.
Depression
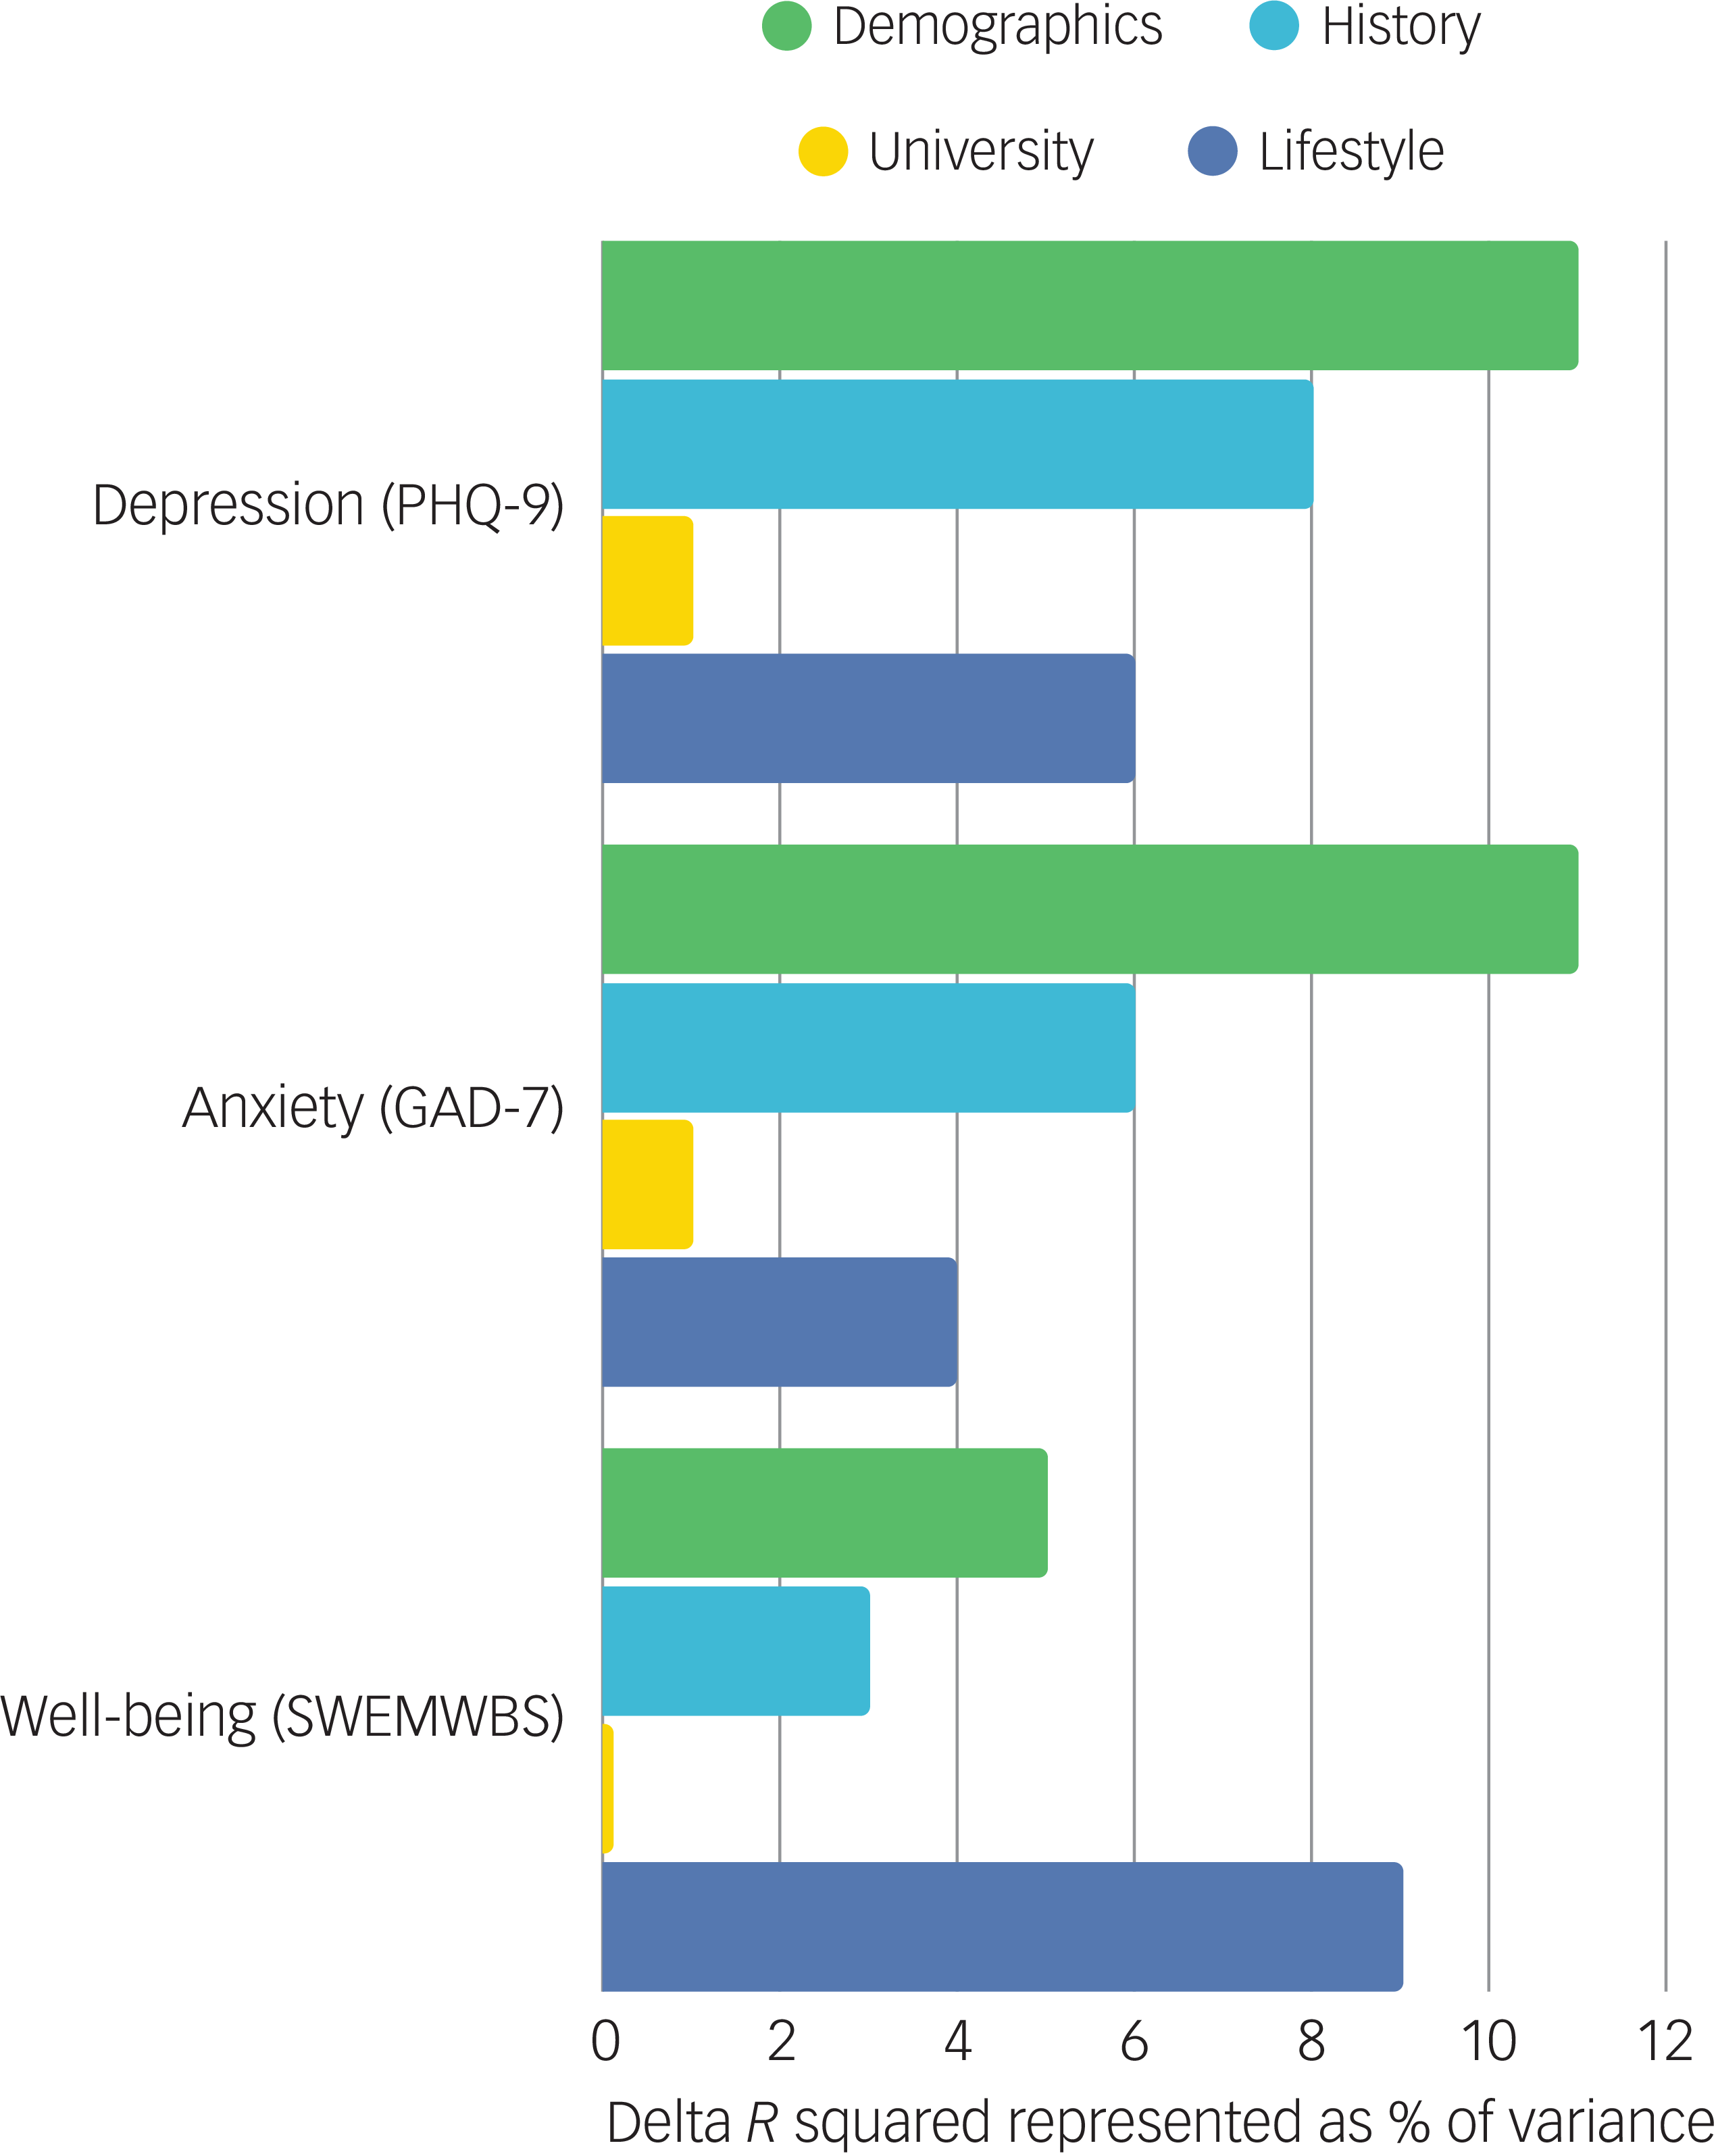
The final linear regression model explained the greatest proportion of variance for PHQ-9 total scores (R 2 = 0.26, adjusted R 2 = 0.26, F(62, 12239) = 69.86, p < 0.001). The hierarchical regression model was built with demographics entered first (model 1). When comparing adjusted R 2 across the models (Fig. 1 and Supplementary Table 1), demographic factors alone explained 11%. Adding history factors (model 2: +8%) and lifestyle factors (model 4: +6%) explained more variance than university factors (model 3: +0.01%).
Delta R 2 across models as %. PHQ-9, Patient Health Questionnaire-9; GAD-7, Generalised Anxiety Disorder-7; WEMWBS, Warwick–Edinburgh Mental Well-being Scale.

Elevated depression scores were associated with younger age (β = 0.069, 95% CI [−0.105 to −0.069] p < 0.001), female gender identity (β = 0.773, 95% CI [0.562–0.986], p < 0.001), bisexual (β = 1.216, 95% CI [0.950–1.482], p < .001), homosexual (β = 0.582, 95% CI [0.176–0.988], p < 0.001) and other sexual orientations (β = 0.961, 95% CI [0.572–1.351], p < 0.001), having a gender that did not match sex at birth (β = 1.410, 95% CI [0.617–2.203], p < 0.001) and reporting a disability (β = 1.605, 95% CI [0.617–2.203], p < 0.001). Compared with students reporting a White ethnic background, Asian students had elevated depression scores (β = 0.388, 95% CI [0.074–0.702], p = 0.017).
Family history of mental health (β = 1.005, 95% CI [0.803–1.206], p < 0.001) was associated with elevated depression scores, as was childhood experience of harsh treatment (β = 1.409, 95% CI [1.156–1.661], p < 0.001), physical abuse (β = 0.597, 95% CI [0.254–0.939], p < 0.001), bullying (β = 1.543, 95% CI [1.310–1.777], p < 0.001) and sexual abuse (β = 1.149, 95% CI [0.879–1.420], p < 0.001). Experience of foster care was associated with lower depression scores (β = −0.830, 95% CI [−1.427 to −0.234], p = 0.006).
International students had lower depression scores (β = −0.488, 95% CI [−0.744 to −0.232], p < 0.001). Being in the second year of study or above was associated with elevated depression scores (β = 0.345, 95% CI [0.109–0.582], p = 0.006).
Higher frequencies of exercise (β = −1.114, 95% CI [−1.332 to −0.896], p < 0.001) and self-care (β = −2.326, 95% CI −2.635 to −2.017], p < 0.001) had a linear association with lower depression scores. Higher caffeine intake (β = 1.382, 95% CI [1.055–1.709], p < 0.001), smoking (β = 1.550, 95% CI [1.221–1.879], p < 0.001) and drug use (β = 0.663, 95% CI [0.400–0.925], p < 0.001) were associated with higher depression scores.
The final model explained the greatest proportion of variance for the logistic regression (McFadden’s pseudo R 2 = 0.16, χ2(18, 49 623) = 23.27, p < 0.001). Again, when comparing pseudo R 2 in the logistic regression models, university factors had less of an impact than demographics, history or lifestyle.
The same associations were generally found for the logistic regression analyses (see Supplementary Table 2), except for drug use, which was not significantly associated with screening positive for moderate to severe depression on the PHQ-9.
Anxiety
The final linear regression explained the greatest proportion of variance for GAD-7 total scores (R 2 = 0.22, adjusted R 2 = 0.22, F(62, 12239) = 55.82, p < 0.001). When comparing adjusted R 2 across models for anxiety, adding history (model 2: +6.7% for anxiety) and lifestyle factors (model 4: +4%) had a greater impact on explaining observed variance than university factors (model 3: +0.4%) (Fig. 1).
Elevated anxiety scores were associated with younger age (β = −0.072, 95% CI [−0.090 to −0.054] p < 0.001), identifying as female (β = 1.195, 95% CI [0.993−1.396], p < 0.001), gender diverse (β = 1.001, 95% CI [0.195–1.807], p = 0.024), bisexual (β = 1.014, 95% CI [0.765–1.262], p < 0.001), homosexual (β = 0.592, 95% CI [0.209–0.974], p < 0.001) and other orientations (β = 0.543, 95% CI [0.177–0.909], p < 0.035), having a gender that did not match sex at birth (β = 0.835, 95% CI [0.125–1.545], p = 0.035) and reporting a disability (β = 1.525, 95% CI [1.240–1.809], p < 0.001). Students from Chinese ethnic backgrounds reported lower anxiety scores compared with students from White backgrounds (β = −0.406, 95% CI [−0.743 to −0.068], p = 0.013).
Family history of mental health (β = 0.990, 95% CI [0.799–1.181], p < 0.001) and experiencing harsh treatment (β = 1.146, 95% CI [0.905–1.386], p < 0.001), bullying (β = 1.478, 95% CI [1.260–1.695], p < 0.001) and sexual abuse (β = 0.896, 95% CI [0.636–1.156], p < 0.001) in childhood were associated with higher anxiety scores. Experiences of foster care predicted lower anxiety scores (β = −0.962, 95% CI [−1.498 to −0.426], p < 0.001).
Students who started the survey in 2024 had lower anxiety scores than those in 2022 (β = −0.215, 95% CI [−0.464 to −0.039], p = 0.021). Students at University A (β = 0.574, 95% CI [0.219–0.928], p = 0.002) and C (β = 0.376, 95% CI [0.047–0.705], p = 0.026) had higher anxiety scores than those at the reference University D. Those studying engineering and manufacturing (β = −0.388, 95% CI [−0.766 to −0.010], p = 0.042) or health and welfare (β = −0.444, 95% CI [−0.755 to −0.133], p = 0.006) had lower anxiety scores than the referent arts and humanities. Being in the second year of study or above was associated with higher anxiety scores (β = −0.570, 95% CI [0.348–0.792], p < 0.001).
Higher frequencies of exercise (β = −0.563, 95% CI [−0.767 to −0.358], p < 0.001) and self-care (β = −1.993, 95% CI [−2.283 to −1.703], p < 0.001) were associated with lower anxiety scores. For self-care, there was some evidence of threshold effects. Higher caffeine intake (β = 1.166, 95% CI [0.858–1.475], p < 0.001), smoking (β = 0.162, 95% CI [0.344–0.962], p < 0.001) and drug use (β = 0.258, 95% CI [0.010–0.505], p = 0.045) were associated with higher anxiety scores.
The final model explained the greatest proportion of variance for the logistic regression (McFadden’s pseudo R 2 = 0.13, χ2(18, 58780) = 19.98, p < 0.001). Again, when comparing pseudo R 2 in the logistic regression models, university factors had less of an impact than demographics, history or lifestyle.
The same associations were generally found for the logistic regression analyses (see Supplementary Table 2), except for engineering and manufacturing students, who were not more likely to have scores over the established clinical threshold for moderate to severe anxiety than the referent arts and humanities students. Additionally, those who drink alcohol more regularly were less likely to have scores over the established clinical threshold for moderate to severe anxiety (odds ratio = 0.829, t = −2.385, 95% CI [0.711–0.967], p = 0.017).
Well-being
Model 4 explained the greatest proportion of variance for the linear regression predicting WEMWBS total scores (R 2 = 0.17, adjusted R 2 = 0.17, F(62, 12889) = 40.91, p < 0.001). Adjusted R 2 shows that demographic (4.8%), history (+2.6%) and university (+0.4%) factors explained far less of the variance in well-being scores than for depression and anxiety. However, lifestyle factors contributed an additional 8.7%.
Younger (β = 0.069, 95% CI [0.054–0.083], p < 0.001), female (β = –0.476, 95% CI [−0.638 to −0.314], p < 0.001), bisexual (β = −0.425, 95% CI [−0.630 to −0.221], p < 0.001), homosexual (β = −0.427, 95% CI [−0.732 to −0.122], p < 0.001), other sexual orientation (β = −0.542, 95% CI [−0.844 to −0.240], p < 0.001), Asian (β = −0.369, s.e. = 0.124, 95% CI [−0.610 to −0.127], p = 0.003) and disabled (β = −0.610, 95% CI [−0.824 to −0.396], p < 0.001) students had lower well-being scores than their counterparts.
Family history of mental illness (β = −0.431, 95% CI [−0.580 to −0.281], p < 0.001) and experience of childhood harsh treatment (β = −0.666, 95% CI [−0.853 to −0.478], p < 0.001), bullying (β = −0.658, 95% CI [−0.828 to −0.487], p < 0.001) and sexual abuse (β = −0.658, 95% CI [−0.272 to 0.146], p < 0.001) were associated with lower well-being scores. Students in University E had higher well-being than those at the referent University D (β = 0.393, 95% CI [0.173–0.612], p = 0.001). International students reported higher well-being scores (β = 0.535, 95% CI [0.336–0.733], p < 0.001), and students in second year and above reported lower well-being scores (β = −0.241, 95% CI [−0.420 to −0.061], p < 0.001). Those studying health and welfare (β = 0.310, s.e. = 0.127, 95% CI [0.059–0.560], p = 0.015) had higher well-being scores, while those studying information and technology (β = −0.419, 95% CI [−0.824 to −0.015], p = 0.043) had lower well-being scores than those studying arts and humanities.
Higher frequencies of exercise (β = 1.204, 95% CI [1.034–1.373], p < 0.001) and self-care (β = 2.546, 95% CI [2.309–2.784], p < 0.001) were associated with higher well-being scores, and increased caffeine intake was associated with lower well-being scores (β = −0.619, 95% CI [−0.872 to −0.366], p < 0.001). Higher frequencies of alcohol use were associated with higher well-being scores (β = 0.282, 95% CI [0.042–0.521], p = 0.025). Smoking (β = −0.549, s.e. =0.127, 95% CI [−0.802 to −0.297], p < 0.001) and drug use (β = −0.421, 95% CI [−0.619 to −0.222], p < 0.001) were associated with lower well-being scores.
Discussion
Over 25% of student participants scored above the standard cut-offs on self-report scales for anxiety and depression, comparable to findings from other student and age-matched general population surveys. Reference Campbell, Blank, Cantrell, Baxter, Blackmore and Dixon12,Reference King, Pickett, Pankow, Dimitropoulos, Cullen and McNevin24,25 A hierarchical regression analysis indicated a strong association between mental health and well-being and demographic and history variables, consistent with previous literature. Reference Campbell, Blank, Cantrell, Baxter, Blackmore and Dixon12,Reference King, Pickett, Pankow, Dimitropoulos, Cullen and McNevin24 Additionally, there were large effect sizes indicating strong associations between both exercise and self-care and better mental health and well-being, while drug use, caffeine intake and smoking were associated with poorer mental health.
A key finding is the significant association of lifestyle factors with well-being and mental health, even after accounting for well-established predictors such as gender, disability, adverse childhood experiences and minority status. Reference Campbell, Blank, Cantrell, Baxter, Blackmore and Dixon12,Reference King, Pickett, Pankow, Dimitropoulos, Cullen and McNevin24 This has important implications for the whole-university approach, providing further support that universities should not only bolster well-being services but also consider environmental strategies to encourage general well-being. The cross-sectional nature of our study does not infer causation, and reduced engagement in exercise or self-care, or increased drug use or smoking, may in themselves be symptoms of depression and anxiety. However, other studies in the university population do show causation, indicating that even light exercise can reduce depression and anxiety. Reference Li, Zhou, Hao and Zang26 Students want to adopt healthier behaviours but find it difficult to prioritise these without support. Reference Saengrotkittikhun and Choochom27 Our qualitative work demonstrates that students’ ability to engage in healthy lifestyle activities is shaped by environmental, financial and institutional constraints, and hence putting the onus on individuals to make these positive changes is likely to fail. Reference Dooley, Okobia, Alsaadi, Bate, Hyde and Prajapati10 Hence, universities should take proactive environmental measures to encourage healthy behaviours, focusing on providing accessible spaces and time within academic schedules. Reference Brown, Richardson, Halil-Pizzirani, Atkins, Yücel and Segrave28
When comparing models, the addition of university factors such as course of study and university provided the least explanatory power. However, being in the second year of study and above predicted poorer mental health, which has been attributed to intensification of academic pressure coupled with fewer support structures. Reference Wagner, Makuapane, Wagner and Masango29 Given that our sample consisted of 75% first-year students, the lesser impact of university factors may be due to our sampling methods. It is worth noting that students in the second year and above will have started university during the COVID-19 pandemic, although evidence demonstrates that this had differing impacts on mental health among university students. Reference Paton, Tiffin, Barkham, Bewick, Broglia and Edwards30 Those on humanities courses reported poorer mental health compared with those studying science, technology, engineering and mathematics (STEM), which has been found in other studies. Reference Lipson, Zhou, Wagner, Beck and Eisenberg31 Despite there being just five institutions, potentially constraining variability, there were some institutions where students consistently reported poorer mental health, and institutional variation has also been reported in the USA. Reference Ketchen Lipson, Gaddis, Heinze, Beck and Eisenberg32 Qualitative work conducted in Nurture-U indicates the importance of campus culture in mental health, which may explain these differences, although more exploration is needed. Reference Dooley, Okobia, Alsaadi, Bate, Hyde and Prajapati10
Disability had the biggest effect size of all the variables, but we did not differentiate those who declared a disability due to a mental health condition from those with other disabilities. Students are encouraged to disclose mental illness as a disability in order to access appropriate support from the outset at university, and hence may be more likely to see a mental health condition in terms of a disability than other populations. Reference Moriña33 However, with this caveat in mind, identifying as disabled or lesbian, gay, bisexual, transgender, queer, intersex, asexual or other (LGBTQIA+) was consistently associated with poorer mental health and well-being. These findings mirror findings in the general population and, in fact, evidence shows that the mental health of these populations is actually better for those attending university: positive university transitions with inclusive cultures and environments can provide opportunities for empowerment and freedom. Reference Brewer, Urwin and Witham34 However, the extra energy taken to ‘belong’ can be detrimental to academic success. Reference Glazzard, Jindal-Snape and Stones35 A systemic approach, which does not examine the experiences of students in isolation but instead explores these in the context of other individual, peer, university and wider societal factors, is crucial for these communities.
Non-Chinese Asian students reported elevated depression and lower well-being than White students. Students from India and Pakistan are now the highest proportion of international students to the UK and USA. 36,Reference Lu37 One explanation could be a lack of culturally appropriate support: barriers to belonging and institutional racism affects mental health and academic success. Reference Stoll, Yalipende, Byrom, Hatch and Lempp38 It is also important to note, however, that, while we did take into account whether students were domestic or international within the regression model, we did not separate Asian international students from Asian British students. Minoritised ethnic groups who study abroad will have completely different levels of social support from those who are studying in their home country, although it has been argued that the self-selection of those who choose to study abroad may in turn mean that international students have protective emotional coping mechanisms compared with other students. Reference Larcombe, Ryan and Baik39 This may explain why Chinese Asian students conversely reported lower anxiety levels compared with White students in our analysis, even though previous research reports that Chinese international students cite language barriers, novel learning systems and cultural differences in recreation as causing marginalisation. Reference Wang, Chang and Li40 However, there have been studies that demonstrate that the GAD-7 may not be sensitive for detecting mild anxiety in the Chinese student population. Reference Niwenahisemo, Zhang, Wang, Geng, Xu and Hu41 The impact of cultural differences and the intersectionality of ethnicity and nationality in the university student experience requires further exploration.
There was a positive relationship between frequency of alcohol use and higher well-being and being less likely to have clinically significant anxiety symptoms. Previous research explores students’ perceived benefits of alcohol consumption, including increasing social encounters and stress relief. Reference Park42 Relative benefits of alcohol use may relate to it being used in moderation, with current students drinking less alcohol than previous generations and reporting increased understanding of the negative consequences for both physical and mental health. Reference Steedley and Thomas43 However, students who chose not to drink report finding it harder to engage in university social life, creating risks for loneliness and mental health problems. Reference Rakow, Chang, Priestley, Slack, Furhrmann and Long44
The consistent association between foster care on better mental health scores runs contrary to previous findings. Reference Zlotnick, Tam and Soman45 Given the small group (3%), this finding should be interpreted with caution. This may reflect a form of ‘survivor bias’, in that individuals who achieved attendance at competitive universities despite childhood adversity are those with strong internal resources, but this also reflects the possibility that those with a combination of care experience and mental health difficulties do not have the support in place to enrol in higher education. Reference Killmer, Chiodo, Aguirre, Chapin, Oraison and Morda46 It is worth noting that there remain high levels of withdrawal from study among care leavers, alongside barriers to inclusion through stigma. Reference Bluff, King and McMahon47
Strengths and limitations
This study was the first student well-being survey using validated instruments across multiple UK institutions. The hierarchical regression models provided a robust method for comparing the impact of different factors on student mental health, but we cannot infer causation from a cross-sectional study. Future analyses will examine which factors prospectively predict changes in student mental health over time. The number of comparisons employed in the analysis increases the risk of type 1 errors, and hence additional caution should be used in interpreting the results, especially in light of unexpected findings relating to alcohol use and foster care. Participating universities were research-intensive institutions requiring higher grades to enrol, raising questions about the generalisability of findings. Including additional non-Russell Group universities may have captured a broader range of student experiences, although our findings are consistent with findings across the wider sector. Reference Liverpool, Moinuddin, Bracegirdle, Eddison, Joseph and Aithal48 It is also worth noting the potential for participation bias: those with experience of mental health difficulties may be more likely to participate in a mental health survey, as evidenced by the fact that half the sample indicated family history of mental illness. While benchmark demographic comparisons indicate that our sample was broadly representative (see Supplementary Table 3), we remain mindful of potential biases when interpreting the results.
Implications and future research
While further work needs to be done to infer the directionality of the associations, we present initial evidence that supports the importance of a whole-university approach to student mental health and well-being. The significant associations between exercise, self-care and positive mental health outcomes, particularly after accounting for demographic and family history, highlights potential key areas for universities to target policies and intervention to improve student well-being. This project also adds further evidence of the difficulties encountered by university students from marginalised groups and the need for universities to provide systemic support that actively supports those from all backgrounds. However, more longitudinal work is needed to explore what predicts the maintenance or improvement of well-being.
Supplementary material
The supplementary material is available online at https://doi.org/10.1192/bjp.2026.10777
Data availability statement
The data that support the findings of this study will be stored on DATAMIND TRE (https://datamind.org.uk/datamind-tre/) following an embargo. More details are available from the corresponding author. Research materials are available on reasonable request. Analytic code is not publicly available due to data governance restrictions associated with sensitive mental health data held across multiple institutions. The analytic approach is described in full, and code may be available from the corresponding author on reasonable request, subject to appropriate data access agreements.
Acknowledgements
We would like to thank all the students who took part in the Nurture-U survey. Their time and honesty were vital to the success of this research.
AI disclosure statement
Microsoft Copilot (GPT-5 chat model) assisted in generating example R code templates during the data analysis planning stage. All AI-generated code was subsequently reviewed, edited and adapted by the lead author (J.D.) to ensure accuracy, correct variable mappings and suitability for the Nurture-U data-set. No AI system contributed to the conceptualisation, interpretation of results, writing of the manuscript text or any other intellectual content.
Author contributions
J.D. and E.W. conceptualised the study. J.D., K.F.M., N.B., S.C., E.D., G.D.S., L.D., L.F., K.A.M., T.M., E.M., A.N., S.J.R., L.R., K.S., A.W. and E.W. curated the data. J.D. and K.F.M. conducted the formal analysis. E.W., A.D., N.B., S.C. and L.R. acquired the funding. J.D., K.F.M., N.B., S.C., E.D., G.D.S., L.D., L.F., K.A.M., T.M., E.M., A.N., S.J.R., L.R., K.S. and E.W. conducted the investigation. J.D., K.F.M. and E.W. developed the methodology. J.D., K.F.M., N.B., S.C., E.D., G.D.S., L.D., L.F., K.A.M., T.M., E.M., A.N., S.J.R., L.R., K.S. and E.W. administered the project. J.D., K.F.M., N.B., S.C., A.D., E.D., G.D.S., L.D., L.F., K.A.M., T.M., E.M., A.N., S.J.R., L.R., K.S. and E.W. provided resources. E.W. supervised the study. K.F.M. conducted the validation. J.D., K.F.M. and E.W. wrote the original draft. J.D., K.F.M., N.B., S.C., E.D., G.D.S., A.D., L.D., L.F., K.A.M., T.M., E.M., A.N., S.J.R., L.R., K.S., A.W. and E.W. reviewed and edited the manuscript.
Funding
This work was supported by the UKRI Adolescence, Mental Health and Developing Mind funding scheme (MR/W002442/1). For the purpose of open access, the author has applied a ‘Creative Commons Attribution (CC BY) licence to any Author Accepted Manuscript version arising from this submission’.
Declaration of interest
S.C.’s work is supported by the National Institute for Health and Care Research (NIHR) Applied Research Collaboration (ARC) Wessex, UK. The views expressed are those of the authors and not necessarily those of the NIHR, National Health Service (NHS) or Department of Health and Social Care. S.C. receives an honorarium for journal editorial work from Elsevier. K.S. is supported by the NIHR Oxford Health Biomedical Research Centre. In the past 3 years, K.S. has received research funding from Boehringer Ingelheim, NIHR and the Wellcome Trust outside of the submitted work, and has also received non-financial support from Big Health in the form of no-cost access to the digital sleep improvement programme, Sleepio, for use in clinical research, outside the submitted work. None of the other authors have conflicts of interest to declare.



 Open access


eLetters
No eLetters have been published for this article.