I. INTRODUCTION
Montmorillonite is a 2:1 physllosilicate with a basic unit where an octahedral sheet is sandwiched by two tetrahedral sheets (lamellae). The tetrahedron consists of one Si4+ atom surrounded by four O2− atoms. The octahedron consists of a central Al3+ or Mg2+ atom surrounded by six O2− atoms. The tetrahedron or octahedrons are joined by shared oxygen atoms to form the sheets. Substitutions of ions with approximately equal radii occur in tetrahedral and/or octahedral sheets, e.g., tetrahedral sheets (Al3+ for Si4+) and octahedral sheets (Mg2+ for Al3+). Substitutions can cause unbalanced internal negative charges in the lamellae. Unbalanced negative charges are compensated by adsorption of ions near the external surfaces of the clay minerals. Montmorillonite is a layered material, which exhibits a high density of structure defects. These defects range from local defects such as isomorphous substitutions, layer vacancies, or atomic displacements, to random or well-defined stacking faults induced by non-periodic layer rotations, translations or twinning, and to interstratification resulting from the coexistence within a given crystal of layers having different structure, thickness, or interlayer displacement. The occurrence of stacking faults in lamellar structures is favored by the energetic similarity of the different stacking modes, owing to the weak interactions between adjacent layers (Viani et al., Reference Viani, Gualtieri and Artioli2002). The reactivity of lamellar structures depends, to a large extent, on these structure defects, on their nature, abundance and distribution within crystals. These structure defects also exert an essential influence on the actual physicochemical properties of these layered structures. It is therefore essential to determine these parameters to gain additional insight into these physicochemical conditions in an effort to reconstruct reaction pathways, and/or to predict the reactivity of a given material/mineral. X-ray diffraction (XRD) has been the preferred method of investigation in order to consolidate these interpretations and to give a detailed structural characterization of defective lamellar structures. However, as a result of their non-periodicity or their reduced periodicity, the diffraction maxima recorded from these compounds do not strictly obey Bragg's law, thus hampering the use of conventional diffraction approaches, such as the Rietveld method (Drits and Tchoubar, Reference Drits and Tchoubar1990; Drits et al., Reference Drits, Srodon and Eberl1997, Reference Drits, Sakharov, Salyn and Lindgreen2005; Ben Rhaiem et al., Reference Ben Rhaiem, Tessier and Ben Haj Amara2000; Ferrage et al., Reference Ferrage, Lanson, Sakharov and Drits2005; Lanson, Reference Lanson2011; Oueslati et al., Reference Oueslati, Ben Rhaiem and Ben Haj Amara2011; Grangeon e t al., Reference Grangeon, Claret, Linard and Chiaberge2013). Indeed several authors (Gualtieri, Reference Gualtieri1999; Viani et al., Reference Viani, Gualtieri and Artioli2002, Gualtieri et al., Reference Gualtieri, Ferrari, Leoni, Grathoff, Hugo, Shatnawi, Paglia and Billinge2008; Lutterotti et al., Reference Lutterotti, Voltolini, Wenk, Bandyopadhyay and Vanorio2010) have investigated theoretical models based on techniques such as Rietveld method, which simulate the experimental XRD profiles obtained from layered structure and despite the encouraging results these techniques remain limited because of the large number of parameters to be taken into account (i.e. profiles and intensities of diffraction maxima are affected by the nature, abundance, and distribution of structure defects).
On the other hand, the main properties of clay minerals with 2:1 layer structure are the ability to expand and contract while maintaining its crystallographic integrity. The ability of montmorillonite to incorporate interlayer H2O molecules and the subsequent change in basal spacing has been widely studied (Mèring and Glaeser, Reference Mèring and Glaeser1954; Van Olphen Reference Van Olphen1965; Ben Brahim et al., Reference Ben Brahim, Armagan, Besson and Tchoubar1983; Sato et al., Reference Sato, Watanabe and Otsuka1992; Laird Reference Laird1996, Reference Laird1999, Claret et al., Reference Claret, Bauer, Schäfer, Griffault and Lanson2002; Bèrend et al., Reference Bèrend, Cases, François, Uriot, Michot, Masion and Thomas1995; Ferrage et al., Reference Ferrage, Sakharov, Michot, Delville, Bauer, Lanson, Grangeon, Frapper, Jimenez-Ruiz and Cuello2011, etc.). Indeed, using XRD analysis they showed that the basal spacing of smectite increases in steps as the amount of water increases in the sample environment. These discrete steps were later attributed to the intercalation of 0, 1, 2, or 3 planes of H2O molecules in the montmorillonite interlayer (Sato et al., Reference Sato, Watanabe and Otsuka1992). Thus, hydration properties are affected by such factors as the type of the interlayer cation, and the amount and the location of layer charge accordingly the crystalline swelling is controlled by the balance between the repulsive force owing to 2:1 layer interactions and the attractive forces between hydrated interlayer cations and the negatively charged surface (Moore and Reynolds, Reference Moore and Reynolds1997).
Clay minerals, and specifically montmorillonite, are used as clay barriers for nuclear and chemical wastes because of their cation-exchange capabilities (CEC), low permeability, and long term structural stability (Claret et al., Reference Claret, Bauer, Schäfer, Griffault and Lanson2002; Schäfer et al., Reference Schäfer, Claret, Bauer, Griffault, Ferrage and Lanson2003; Tournassat et al., Reference Tournassat, Neaman, Villiéras, Bosbach and Charlet2003). The montmorillonite crystal structure is closely related to the CEC. This latter has respectively, a direct microscopic effect on the structure (i.e. the interlamellar space configuration, the modification of the layer-type distributions, etc.) and a macroscopic fluctuations strongly related to the mechanical response and physical properties of the clay (Denis et al., Reference Denis, Keall, Hall and Meeten1991; Saravanan et al., Reference Saravanan, Ramamurthy and Madras2015; Tertre et al., Reference Tertre, Delville, Prêta, Hubert and Ferrage2015; Zheng et al., Reference Zheng, Rutqvist, Birkholzer and Liu2015; Zivica and Palou, Reference Zivica and Palou2015; El Hafid and Hajjaji, Reference El Hafid and Hajjaji2016; Zeng et al., Reference Zeng, Hong, Wang and Yang2016). In this context, the understanding of the mineral behavior with the possible transformations of the soil is mandatory. Several authors studied the effect of the stress response of montmorillonite under mechanical solicitation by investigating their elastic properties using various methods including theoretical, experimental, computational (molecular simulations), and hybrid methods (Vaughan and Guggenheim, Reference Vaughan and Guggenheim1986; Denis et al., Reference Denis, Keall, Hall and Meeten1991; Wang et al., Reference Wang, Wang and Wang2001; Manevitch and Rutledge, Reference Manevitch and Rutledge2004; Katti et al., Reference Katti, Ghosh, Schmidt and Katti2005).
Segad et al. (Reference Segad, Jönsson, Åkesson and Cabane2010) studied the structure, forces and the swelling properties of Ca/Na montmorillonite and demonstrate a fundamental result based on ion–ion correlations. Thakur and Singh (Reference Thakur and Singh2005) propose a rapid determination of clay swelling pressure and correlate the suction process with swelling pressure. Oueslati et al. (Reference Oueslati, Ben Rhaiem and Ben Haj Amara2012) studied the effect of an applied hydrous strain, in the case of Na-rich montmorillonite (Swy-Na), on the cation exchange process. They demonstrate the link between number of hydration–dehydration cycles and the starting materials CEC changes. Ammar et al. (Reference Ammar, Oueslati, Ben Rhaiem and Ben Haj Amara2013, Reference Ammar, Oueslati, Rhaiem and Ben Haj Amara2014) proves the relation between the hydration sequence orientation and structural changes in the case of Hg exchanged montmorillonite. Indeed, a heterogeneous hydration behavior characterized by presence of several mixed layer structures (MLSs) involving variables hydration state, is noted. The swelling is characterized by a stepwise expansion of the layer-to-layer distance with increasing water activity. This expansion has been described by the incorporation of 1, 2, and, 3 planes of interlayer H2O molecules, leading to the well-known 1W (d 001 = 11.6–12.9 Å), 2W (d 001 = 14.9–15.7 Å), and 3W (d 001 = 18–19 Å) hydration states, in addition to the dehydrated one, 0W (0W (d 001 = 9.6–10.6 Å) (Sato et al., Reference Sato, Watanabe and Otsuka1992).
The purpose of this study is to investigate the effect of the mechanical constraint (by varying swelling pressure) on the hydration properties and the appropriate structural changes using the quantitative XRD analysis under extreme RH conditions.
II. EXPERIMENTAL
A. Starting materials
The dioctahedral smectite used in this work is a reference montmorillonite sample (Swy-2) from the Source Clay Repository of The Clay Minerals Society (Moll, Reference Moll2001). The host material is originated from Wyoming geological deposit (USA) characterized by a half-cell structural formula as following (Mermut and Cano, Reference Mermut and Cano2001):
 $$\eqalign{& {\rm (Si}_{{\rm 3}{\rm. 923}} \;{\rm Al}_{{\rm 0}{\rm. 077}} )({\rm Al}_{{\rm 1}{\rm. 459}} \;{\rm Ti}_{0.018}^{4 +} \;{\rm Fe}_{0.039}^{3 +} \;{\rm Fe}_{0.045}^{2 +} \;{\rm Mg}_{0.382}^{2 +} ) \cr & {\rm O}_{10} ({\rm OH})_2 ({\rm Ca}_{0.177}^{2 +} \;{\rm Na}_{0.027}^ + ).} $$
Wyoming montmorillonite represent a major octahedral charge and exhibits an extremely limited substitution in the tetrahedral sheets where the CEC is 101 meq 100 g–1 (Mermut and Cano, Reference Mermut and Cano2001).
B. Experimental protocol
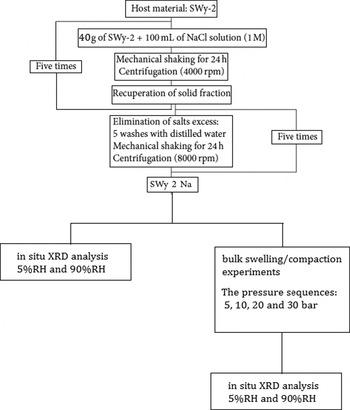
The detailed experimental protocol is reported in Figure 1.
Experimental protocol.

C. Mechanical constraint
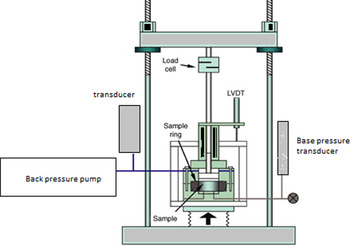
The oedometer testing device used is a front-loading oedometer (WF 24251) (Figure 2). The diameter of the oedometer cell is 50 mm. The race of the comparator extends 12 mm with an accuracy of 2 µm. The compaction/reswelling experiment is detailed by Denis et al. (Reference Denis, Keall, Hall and Meeten1991). Indeed, the piston pressure, applied to the clay sample, causes the fluid to be expelled through the filter until the system reaches equilibrium. During the oedometric testing, the measured equilibrium displacement permits the equilibrium void ratio e to be determined; this is defined as the ratio of the volume of fluid to that of solid particles. Along the experiments, the sample was maintained in contact with an external reservoir of deionized water. The compaction and swelling procedure is carried out by a stepwise loading and unloading of the clay suspensions each time. During both tests (compaction/swelling) the pressure sequence 5, 10, 20, and 30 bar are respected. The final void ratio e is determined by the cake at 140 °C overnight. For each pressure the equilibrium void ratio is calculated from the equation
 $$e(P) = e_{\rm f} + \displaystyle{{\Delta l\rho _{\rm c} A} \over M}$$
where Δl correspond to the final position of the piston, and may be positive or negative; ρ c, the dry clay density, which was taken as 2.75 g cm–3 as previously calculated; M, suspension weight (introduced into the cell); and A = 5.07 cm2, the cross-sectional area of the sample cell.
(Colour online) Schematic diagram of the oedometer used for the bulk swelling/compaction experiments.

D. XRD analysis
For all samples, oriented slides were prepared by drying at room temperature an aqueous clay suspension on glass slides. The XRD patterns were then recorded using a Bruker D8 diffractometer equipped with an MHG Messtechnik humidity controller coupled to an Anton Paar CHC+ chamber. The experimental XRD patterns are registered at the fixed relative humidity (RH) condition values. Intensities were measured with a SolXE Si(Li) solid-state detector (Baltic Scientific Instruments) for 4 s per 0.04° 2θ step over the 2°–32° 2θ CuKα angular range. Divergence slit, the two Soller slits, the antiscatter, and resolution slits were 0.3°, 2.3°, 0.3°, and 0.1°, respectively.
1. “Insitu” atmospheric constraint (5%RH and 90%RH)
Samples were kept at 23 °C in the CHC+ chamber during the whole data collection. Samples were kept also under a constant flow of mixed dry/saturated air to maintain the desired RH after an initial equilibration. RH was continuously monitored with a hygrometer (uncertainty of 2%RH) located close to the sample. To carry out the adsorption cycle, the RH value extends from 5%, to the almost saturated condition (90%RH).
2. Semi-quantitative XRD investigation
The qualitative parameters such as the basal spacing d 001 from the first-order (001) Bragg reflections, the [full-wide at the half-maximum (FWHM) for the 001 reflection] are determined using EVA release DIFFRACPlus software (Bruker AXS GmbH, Karlsruhe, Germany). The ξ parameter, which accounts for the departure from rationality of 00l reflections, is a good indicator of the hydration-state heterogeneity. Indeed, this parameters is calculated as the standard deviation of the l × d(00l) values calculated for the Xi measurable reflections over the explored 2θ CuK α angular range (Bailey, Reference Bailey1982). The combination of results obtained from semi-quantitative parameters with the profile geometry description (i.e. symmetric and asymmetric X-ray peaks) provide a preliminary information about the hydration state evolution of the studied complex all over RH range. In fact, this analysis type cannot supply information about structural characteristics such as the position and the organization of Na+ cations with H2O molecule in the interlamellar space along the c* axis (Drits and Tchoubar, Reference Drits and Tchoubar1990, 2013; Manceau et al., Reference Manceau, Drits, Silvester, Bartoli and Lanson1997; Lanson, et al., Reference Lanson, Drits, Feng and Manceau2002a , Reference Lanson, Drits, Gaillot, Silvester, Plançon and Manceau b ; Gaillot et al., Reference Gaillot, Flot, Drits, Manceau, Burghammer and Lanson2003; Grangeon et al., Reference Grangeon, Lanson, Lanson and Manceau2008; Lanson, Reference Lanson2011). In addition, it cannot provide real information, about the interlayer space configuration and the quantification of different hydration states that coexist in the same sample structure. For these reasons a quantitative XRD analysis is performed.
3. Quantitative XRD investigation
The algorithms developed initially by Drits and Sakharov (Reference Drits and Sakharov1976), and more recently by Drits et al. (Reference Drits, Srodon and Eberl1997) and Sakharov et al. (Reference Sakharov, Lindgreen, Salyn and Drits1999), were used to fit experimental XRD profiles over 2°–32° 2θ CuKα angular range using an indirect method. The XRD calculations, based on the mathematical formalism developed by Drits and Tchoubar (Reference Drits and Tchoubar1990), were successfully applied to simulate XRD patterns from phyllosilicates, phyllomanganates, and calcium silicate hydrates.
This indirect method consists to adjust the experimental patterns by fitting positions and profiles of the 00l reflections over the explored angular range. Theoretical XRD patterns are calculated using the algorithms and the Z atomic coordinates of the interlayer space developed by Drits and Tchoubar (Reference Drits and Tchoubar1990). The diffracted intensity along the 00l rod of the reciprocal space is given by Drits and Tchoubar (Reference Drits and Tchoubar1990). The detailed strategy used to fit experimental XRD patterns are fully explained by (Ferrage et al., Reference Ferrage, Lanson, Sakharov and Drits2005; Ammar et al., Reference Ammar, Oueslati, Chorfi and Ben Haj Amara2015; Oueslati et al., Reference Oueslati, Ammar and Chorfi2015).
III. RESULTS
A. The montmorillonite oedometric test: compaction and reswelling
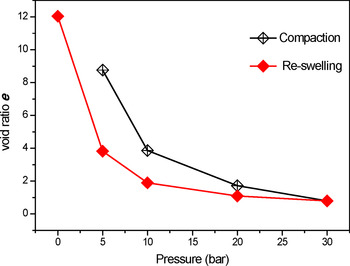
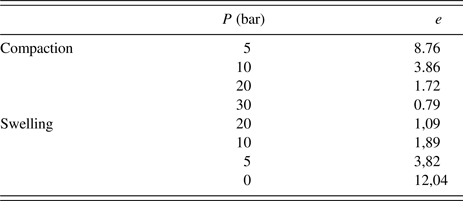
The deformation property of clay (soft soil) is dependent on several parameters such as: the clay origin (history), the clay structure, the bond between “particles” and the water content (Ben Rhaiem et al., Reference Ben Rhaiem, Pons, Tessier, Schultz, Van Ophen and Mumpton1987). The compaction/reswelling test of the Na-exchanged montmorillonite allows us to determine the evolution of the void ratio e vs. the applied pressure (Figure 3). All data are listed in Table I. It can be seen that the initial compaction (loading) and swelling (unloading) branches obeys to an irreversible process, the initial compaction curve always lying above the swelling curve indicating the nonlinear and anisotropic deformation behavior. This is in accordance with previous studies of the pressure response of montmorillonites (Barclay and Ottewill, Reference Barclay and Ottewill1970; Mesri and Olson, Reference Mesri and Olson1971). On reloading samples from a piston pressure lower than the maximum pressure, which the sample has previously experienced, the swelling curve is retraced. This behavior is qualitatively similar to that observed in classical soil mechanics consolidation tests (e.g. Atkinson & Bransby, Reference Atkinson and Bransby1978). Also, this qualitative interpretation is in concordance with results obtained by Tanaka et al. (Reference Tanaka, Shiwakoti, Mishima, Watabe and Tanaka2001) where authors demonstrate the non-linearity of the most prominent consolidation characteristic using the relation between the void ratio ( e ) and the consolidation stress (σ v). In this work the non-linearity remains valid as long as a series of loading/unloading tests has not been made (and this may be one of the limits to be respected in this study).
(Colour online) Equilibrium void ratio e for the compaction and reswelling vs. pressure.

The difference between the initial compaction and subsequent curves is due, at least in part, to irreversible energy losses, e.g. interparticle friction occurring during the progressive alignment of particles with increasing applied pressure (Ben Rhaiem et al., Reference Ben Rhaiem, Tessier and Pons1986, Reference Ben Rhaiem, Pons, Tessier, Schultz, Van Ophen and Mumpton1987; Tessier and Pedro, Reference Tessier and Pedro1987).
Equilibrium void ratio e for the compaction and reswelling data for Na-SWy-2 montmorillonite. Zero bar corresponds to “free” swelling.

Several interesting features can be observed:
-
(i) The gap between void ratio values, obtained during the compaction and the reswelling process, increases according to the variation of the applied pressure. In this optic, Tanaka et al. (Reference Tanaka, Tsutsumi and Ohashi2014) introduce the effective stress parameter as a key parameter to understanding the unloading behavior of clays (three clay types are studied) using the Constant Rate of Strain CRS test. An assumption based on cubic polynomial equation is used to simulate the excess pore water pressure during the unloading steps. They demonstrate that the relation between the swelling index (C s) and the compression index (C c) is influenced by the
 $\Delta e - {\rm log}\displaystyle{{\sigma {\rm ^{\prime}}_{\rm v}} \over {\sigma {\rm ^{\prime}}_{{\rm vmax}}}} $
fluctuation. This later depends on the duration of consolidation under the constant load before the unloading.
-
(ii) During the compaction, and to a pressure ranging from 5 to 30, Δe ≈ 8. On the other hand, for the same range of pressure and during the reswelling Δe ≈ 3. This fluctuation between Cs and Cc is interpreted by the intrinsic physical properties of the studied montmorillonite, rather than to any further interaction. Indeed, the presence of diffuse ion-layers around the particles leads to inter-particle repulsion because of osmotic activity of the ions. This force of repulsion is decreased with increasing distance between clay particles, with increasing electrolyte concentration, and with increasing valence of the exchangeable ion.
-
(iii) The data obtained for the “free” swelling state, in which the sample was constrained only by the friction of the piston, confirm this observation.

B. XRD analysis
1. “Insitu” XRD analysis at 5%RH
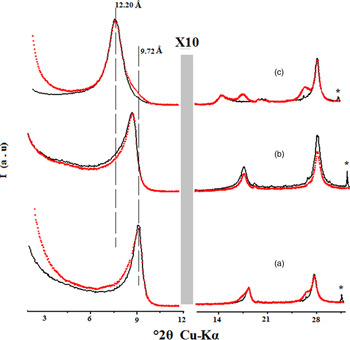
Three samples are collected and recorded “insitu”, at 5%RH, after environment equilibrium. Obtained XRD patterns are reported in Figure 4. The experimental d 001 basal spacing value are shifted from 9.72 Å, in the case of unstressed sample (e.g. before the oedometer test), to 12.20 Å, after the reswelling process.
(Colour online) Best agreement between theoretical (****) and experimental (————) XRD pattern recorded under 5%RH in the case of: (a) unstressed sample (b) sample collected after compaction constraint (c) sample collected after reswelling constraint.

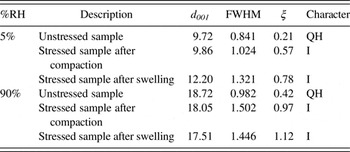
Qualitatively this result demonstrates that the studied sample undergoes a hydration 0W→ 1W transition (Sato et al., Reference Sato, Watanabe and Otsuka1992). By exploiting the FWHM value (Table II), the quasi-homogeneous hydration character, noted for the unstressed sample, is not respected after applying mechanical constraint and an interstratified character confirmed by the high FWHM value and ξ parameter is noted.
Qualitative XRD investigations for different studied samples vs. extreme %RH condition.

Notes: Position d 001 and FWHM of the 001 reflection are given in angstroms and in °2θ CuK α, respectively. The ξ parameter, which accounts for the departure from rationality of the 00l reflection series is calculated as the standard deviation of the l × d 00l values calculated for the X i measurable reflections (X i = 3 in this case) over the °2θ CuK α angular range. (I) and (QH) indicates interstratified hydration character and quasi-homogeneous hydration character.
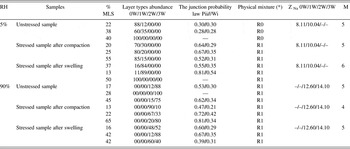
Quantitatively, all experimental XRD patterns are reproduced using several MLSs detailed in Table III. The modeling of XRD patterns was accomplished using the fitting strategy described by Oueslati et al. (Reference Oueslati, Ben Rhaiem and Ben Haj Amara2011), which consists of reproducing the experimental XRD pattern using a main structure with only one type of layer if possible and if necessary, additional contributions of a MLS to the diffracted intensity are introduced in order to achieve the optimum agreement between calculated and experimental patterns. Note that layers with the same hydration state, present in the different MLSs contributing to the diffracted intensity, are assumed to have identical properties (chemical composition, Layer Thickness, Z-coordinates of atoms) (Ferrage et al., Reference Ferrage, Lanson, Sakharov and Drits2005).The best agreements between theoretical and experimental patterns are reported in Figure 4. An R0 physical mixture type (random interstartification) is used in the case of unstressed sample and a partial segregation R1 for the sample collected after the compaction and reswelling process. The average layer number per stacking is ~5.
Structural parameters used to reproduce experimental XRD patterns.

Notes: 3W, 2W, 1W, and 0W are attributed to the layer hydration state. (*) R, Reichweit factor; R0 and R1 describe the MLS with random interstratifications or with partial segregation, respectively.
 $n_{{\rm H}_{\rm 2} {\rm O}} $
: number of H2O molecule per half unit cell is fixed to 2.5, 5.6, and 6.1, respectively for 1W, 2W, and 3W. Z
Na: position of exchangeable cations per half unit cell calculated along c* axis. M: average layer number per stacking. n
Na: number of H2O molecule per half unit cell is fixed to 0.33 indicating full saturation of the cationic exchange capacity CEC of the minerals.
2. “Insitu” XRD analysis at 90%RH
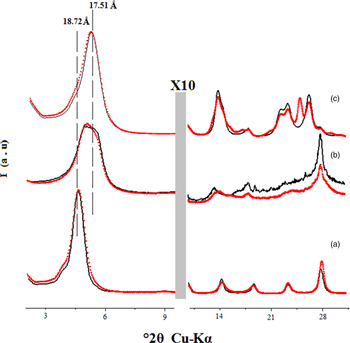
An extreme atmospheric condition is created “insitu” by increasing RH toward 90%. Obtained XRD patterns in the case of unstressed sample (Figure 5) present a d 001 = 18.72 Å characteristic of 3W layer hydration state. This result is in concordance with earlier works of Oueslati et al. (Reference Oueslati, Ben Rhaiem and Ben Haj Amara2011).
(Colour online) Best agreement between theoretical (****) and experimental (————) XRD pattern recorded under 90%RH in the case of (a) unstressed sample, (b) sample collected after compaction constraint, (c) sample collected after reswelling constraint.

For the sample collected after compaction, the 001 reflection (18.05 Å) presents a shoulder at high 2θ angles. This geometrical anomaly is accompanied by a considerable increase in the associated FWHM values and ξ parameter. By comparing reflections positions of the higher diffraction orders irrationality position is noted.
For the sample analyzed after the reswelling process a clear interstratified character appears especially at the superior diffraction orders. In this case, the 001 reflection is characterized by a basal spacing value equal to 17.51 and an FWHM = 1.446. This change confirms the effect of the applied mechanical stress. Indeed, the basal spacing shift is directly related to the applied mechanical stress. Hence, a new organization, very sensitive to the electrostatic and the chemical bonding forces, which govern the interlamellar space, is noted.
The main structural parameters used to obtain a good fit are summarized in Table III. For each model, several layer types with variable stacking mode are used in order to improve theoretical model. The partial segregation (R1) is the main MLS distribution noted for all studied sample. The best fit (Figure 5) is obtained using three MLS for all cases and a small decrease in the average layer number per stacking is noted (Table III).
IV. CONCLUSION
This work is done in order to understand the effect of a mechanical constraint on the hydration behavior of Na exchanged montmorillonite. Hydration behavior is investigated under extreme atmospheric conditions (5%RH and 90%RH). This study is achieved by modeling experimental XRD patterns. Obtained results demonstrates: (i) The void ratio e deviation increase along the compaction/reswelling process; (ii) For the samples studied at 5%RH, an increase on the interlamellar water content is the apparent effect of the applied mechanical constraint. This transition is accompanied by a structural change from R0 to R1 physical mixture indicating a transformation in the distribution and the stacking layer mode; (iii) For the samples studied at 90%RH, a low decrease of the d 001 value is noted and all samples keeps the 3W layer hydration state. The principle effect of the applied strain is observed for the high 2θ° CuKα angular range where a clear interstratified character appears and a segregation trends, governing the layer-type junction probabilities, dominates the mixture description. For this angular domain a bad agreement between theoretical and experimental XRD patterns is observed.
ACKNOWLEDGMENTS
The authors would like to extend their sincere appreciation to the Deanship of Scientific Research at King Saud University for funding this Research group No. RG-1435-026.