1. Introduction
Navigation devices have become an indispensable tool for drivers’ daily travel because they can provide drivers with geographic and traffic information about the surrounding area as well as directions towards destinations (Park and Kim, Reference Park and Kim2014). A survey conducted in 2019 reported that the percentage of drivers using navigation devices reached 85.9% in China (Zheng, Reference Zheng2019). Another survey on China mobile navigation applications reported that the average monthly active users and daily active users of main applications were 741.33 and 112.68 million in the third quarter of 2019, respectively (BigData-Research, 2019). These data imply that navigation systems are widely used in drivers’ daily travel. Through the assistance of navigation devices, drivers can obtain benefits such as saving time and avoiding traffic congestion and accidents (Chen and Chen, Reference Chen and Chen2011). However, the use of navigation devices can trigger some unavoidable secondary tasks, such as following route guidance instructions and operating the navigation system (Allert et al., Reference Allert, Van, Michiel, Marjan and Karel2016). Driving a vehicle is a complex task that requires the coordination and cooperation of four channel resources of vision, hearing, motion, and cognition (Walker and Stanton, Reference Walker and Stanton2001); while secondary tasks raised by navigation usage will also consume drivers’ attention. Thus, it is a problem deserving research whether the use of navigation devices will affect driver behaviour. To reveal the effects of the characteristics of navigation information on driving behaviours, scholars have carried out numerous studies, which have mainly focused on the output modes of navigation information and the content of navigation information.
Some studies have been conducted to identify what kind of output mode can provide better service for drivers. Audio, visual and audio-visual are three common navigation information output modes; these can output voice navigation information only, graphical navigation information only, or both voice and graphical navigation information, respectively. Jensen et al. (Reference Jensen, Skov and Thiruravichandran2010) compared driving behaviours (such as speeding violations and lane excursions) under the context of three different output modes and found that visual output led to a decrease in driving behaviour performance. Another study found that audio-visual output had minimal effect on driving behaviours (such as headway and lateral offset) (Hu, Reference Hu2017). In addition, some other research has also paid attention to the detailed settings of output mode of navigation information, such as the display of visual information (Liu and Wen, Reference Liu and Wen2004; Lin et al., Reference Lin, Wu and Chien2010) and the broadcast of auditory information (Wu et al., Reference Wu, Huang and Wu2009; Large and Burnett, Reference Large and Burnett2014; Yun et al., Reference Yun, Zhao, Zhao, Weng and Yang2017). These studies demonstrated the effects of different output modes of navigation information and their detailed settings on driving behaviours and vehicle operating status, which serves as a reference for the design optimisation of the output mode.
Other studies have examined what kind of content is easier for drivers to understand. Uang and Hwang (Reference Uang and Hwang2003) found that traffic congestion information may improve the route selection quality in terms of trip duration and navigation errors. Another study evaluated the aesthetics and usability of various in-vehicle electronic navigation maps and found that maps with the least detail delivered the best performance and highest evaluations (Lavie et al., Reference Lavie, Oron-Gilad and Meyer2011). These studies mainly probed into visual information content, but others have analysed auditory information content. Wu et al. (Reference Wu, Huang and Wu2009) found that a simple prompt message (such as ‘please turn left’ or ‘please drive straight’) was more easily accepted and understood due to shorter broadcasting time. Another study also found that the simple auditory route instruction (such as ‘turn left at the end of the road’) can be followed without significant interference in a simulated driving task (Dalton et al., Reference Dalton, Agarwal, Fraenkel, Baichoo and Masry2013). These studies provide guidance for designing visual and auditory information to meet drivers’ needs.
These studies mainly focused on the behavioural performance of drivers passing through a certain road cross-section, a certain road segment or a certain area. The differences in the efficacy of guidance of different navigation information can be identified through these behavioural performances; however, it is difficult for them to directly reflect the changing process of driving behaviours. During the transmission of guidance information to the driver by the navigation aid, the driver adjusts their driving operations dynamically according to the navigation instructions. Exploration of change in driving behaviour at this stage is conducive to understanding the driver's response to navigation information, which could offer guidance in identifying the mechanisms affecting drivers’ navigation and optimising the design of navigation information. Thus, it is necessary to explore a method that can describe the changing process of driving behaviours under the effects of navigation information, achieving accurate expression of driving behaviour characteristics.
The graph is a vital means to display the characteristics of complex, multidimensional, uncertain, incomplete and internally associated data due to its great advantages in information visualisation (Wu and Zhao, Reference Wu and Zhao2018). For example, knowledge graphs visually display complex knowledge and reveal the relationships between the knowledge development process and structure, via data mining, information processing, knowledge measurement and graphics drawing. Drawing on the manifestation of knowledge graphs, some scholars (Wu, Reference Wu2017; Chen, Reference Chen2019) have applied the graph concept to research into driving behaviours, constructing driving behaviour graphs in node extraction, node creation and graph construction to express the characteristics of driving behaviours and their mutual relations accurately. In other words, this method can fragment continuous driving behaviours, demonstrating the internal correlations of multidimensional driving behaviour changes.
At present, studies on driving behaviour graphs can be divided into two categories. One aims to realise the classification of driving styles or the identification of risky driving behaviours through the driving behaviour graph (Chen et al., Reference Chen, Fang and Tien2013, Reference Chen, Zhao, Zhang, Rong and Liu2019; Brun et al., Reference Brun, Cappellania, Saggese and Vento2014; Chandra et al., Reference Chandra, Bhattacharya, Mittal, Li, Bera and Manocha2019; Chen, Reference Chen2019); the other aims to explore the differences of driving behaviours under different factors (such as types of driver, levels of vehicle energy consumption or traffic conditions) through the driving behaviour graph (Wu, Reference Wu2017; Wu and Zhao, Reference Wu and Zhao2018; Liu et al., Reference Liu, Qi and Chen2019; Qi et al., Reference Qi, Liu, Wu and Zhao2019). Research has revealed that the driving behaviour graph can capture the microscopic characteristics of driving behaviours and identify the factors influencing driving behaviours, which lays the foundation of studies on driving behaviour graphs. Recently, driving behaviours under the effects of navigation information have attracted increasing researchers’ attention with the increasing application of navigation systems (Wu et al., Reference Wu, Huang and Wu2009; Jensen et al., Reference Jensen, Skov and Thiruravichandran2010; Dalton et al., Reference Dalton, Agarwal, Fraenkel, Baichoo and Masry2013). However, existing research has not paid enough attention to the question whether the driving behaviour graph is applicable to the description of driving behaviour characteristics stimulated by navigation information, resulting in a lack of methods for visual, systematic and detailed description of characteristics of driving behaviours at the stage of the navigation information broadcast.
To explore this problem, this study first selected two different prompt messages (one simple, one detailed), and designed a driving simulation experiment to collect empirical data on drivers’ responses to the two prompt messages. Two vehicle operating indicators (velocity and lateral offset) and two driver manoeuvre indicators (accelerator power and steering wheel angle) were selected, and the T-test was used to compare the differences of behavioural performance in two conditions. Next, graphs representing the driving behaviour of drivers using the simple and detailed prompt messages were constructed, and their characteristics were mined and their similarities were further discriminated. Finally, T-test results of behavioural performance and similarity results of driving behaviour graphs were compared to determine the applicability of the graph in describing driving behaviour characteristics guided by navigation information. The hypotheses are as follows:
H1: Driving manoeuvre behaviours (accelerator power and steering wheel angle) and vehicle operation performance (velocity and lateral offset) under the two different prompt messages are significantly different.
H2: Driving behaviour graphs covering driving manoeuvre behaviours (accelerator power and steering wheel angle) and vehicle operation performance (velocity and lateral offset) under the two different prompt messages are dissimilar.
H3: Driving behaviour graphs can be used to describe the characteristics of driving manoeuvre behaviours (such as accelerator power and steering wheel angle) and vehicle operation performance (such as velocity and lateral offset) under the guidance of navigation information.
2. Materials
2.1 Participants
Thirty-seven participants were recruited for this study. The numbers of male and female participants were 25 and 12, respectively. The ages of the participants ranged from 21 to 57 years (M = 37.76, SD = 11.89). All the participants held a valid driver's licence and had at least two years of driving experience (M = 8.72 years, SD = 5.84 years). All subjects had normal vision and hearing, without any history of motion sickness. All participants had normal vision or vision corrected to normal with contact lenses. The main reason for selecting participants with such vision was that they can wear the glass-type eye tracker. The number of participants having corrected vision was five.
2.2 Apparatus
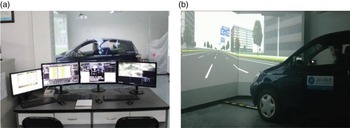
A fixed-base driving simulator was employed in the current research (Figure 1). Vehicle operating data (such as speed and acceleration) and driver manoeuvre data (such as gears and clutch) were collected. The data acquisition frequency of the driving simulator is 30 Hz. The road scenario was projected onto three big screens, providing the driver with a 130° wide-angle field of view. The effectiveness of this simulator in studying driver behaviour has been proven in previous research (Zhao et al., Reference Zhao, Zhang, Rong and Ma2011; Ding et al., Reference Ding, Zhao, Rong and Ma2013). In this study, the average score of the authenticity evaluations of the driving simulator, experiment scenarios and navigation voice information was approximately 9 (where 1 denotes not real and 10 means very real), which indicated that the participants highly approved the authenticity of the driving simulation experimental platform. Thus, it is feasible to obtain the driving behaviour data under the guidance of navigation voice information based on this driving simulation experimental platform.
Driving simulation experiment platform: (a) experimental equipment, (b) experimental scene. Note: (b) is an example of the experimental scene in the simple prompt message condition

2.3 Experimental design
Intersections are one of the most common nodes for navigation guidance (Li and Liu, Reference Li and Liu2013); thus, this study was conducted based on ordinary intersections. Two types of voice prompt messages were designed. One was a simple prompt message (SPM), and the other was a detailed prompt message (DPM). Each type of prompt message comprised a set of three sequential messages broadcast by the navigation unit. The details of the two prompt messages are shown in Table 1. In comparison with the simple prompt message with direction information, the detailed prompt message also contained distance information (500 m/100 m ahead), road information (‘Enter Wenhua Road’) and lane information (‘Take the rightmost lane’). The broadcast completion positions of the same sequence of simple and detailed prompt messages were the same: they were 500, 100 and 0 m upstream of the stop bar, respectively. The settings of the broadcast completion positions were consistent with those of advance guide signs. The broadcast start positions of the three sequential messages were, for the simple prompt message: 540, 140 and 20 m upstream of the stop bar, and for the detailed prompt message: 600, 200 and 50 m upstream of the stop bar.
Detailed contents of the two types of prompt messages

2.4 Driving scenario design
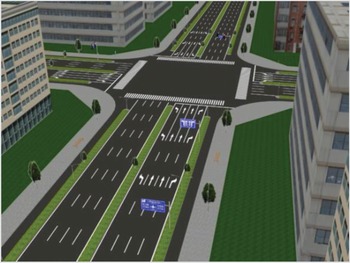
Two experimental intersections (as shown in Figure 2) were randomly assigned to two experimental routes. The length of each route was 10 km. In addition to experimental intersections, there were some intersections used for other studies in each experimental route. The road type was a main road with eight lanes (four lanes in each direction), the width of the lanes was 3.5 m, and the speed limit was 60 km/h. The traffic flow was set as free flow to exclude the effects of other vehicles on the experiment vehicle. The traffic signs and markings in the experiment scenarios were established according to Chinese national standard GB5768-2009 (AQSIQ and SA, 2009). The advance guide signs at intersections were set at 500, 100 and 0 m upstream of the stop bar. The audio files of the two different prompt messages, produced by navigation companies, were imported into the driving simulation platform through the application programming interface. In addition, according to the designs of the experimental intersections, the trigger functions of voice broadcasting were set to control the reading of the corresponding voice files, realising the correlations between prompt messages and experimental intersections. The subjects were in the first-person perspective when they were driving the vehicle.
Three-dimensional scene of the experimental intersection

2.5 Procedure
First, participants filled in the basic personal information form. The participants then familiarised themselves with the operation of the simulated vehicle with a 5 min pre-driving orientation. The participants then drove the two routes, in a randomised sequence to counterbalance the possible effects of learning or fatigue. They were required to drive to the destination according to the road traffic signs and navigation prompts. Each route took about 10 min and there was a 5 min break between the two experimental routes. Finally, the participants filled in the validity questionnaire about the driving simulation platform.
2.6 Data preprocessing
Four sets of data were extracted from the output data of the driving simulation experiment platform to systematically explore the vehicle operation performance and driver manoeuvre behaviours under two prompt messages. There were two sets of vehicle operating data, velocity $(V )$ and lateral offset $(L )$
 ; the other two sets were driver manoeuvre behaviour data: accelerator power $(A )$
 and steering wheel angle $(S )$
 . V and A mainly reflected the longitudinal operating status of vehicle and longitudinal manoeuvre behaviour of the driver, respectively; while L and S mainly reflected the lateral operating status of vehicle and lateral manoeuvre behaviour of the driver. The meanings of velocity, lateral offset, accelerator power and steering wheel angle are as follows:
$V$
 : the speed of the vehicle.
$L$
: the distance that the vehicle centreline deviates from the lane centreline.$A$
: the efficacy with which a driver steps on the accelerator$S$
: the angle at which the steering wheel rotates while the vehicle is in motion.


The zone starting from 600 m upstream of the intersection stop bar and ending at 100 m past the stop bar was defined as the whole data analysis zone. This range was selected to ensure drivers could see the first advance guide signs when entering the data analysis zone, and then complete the turning operation when leaving the data analysis zone. To facilitate data processing, a point was marked every 5 m on the whole data zone, and the 141 marked points were p (−600), p (−595), … , p (+95), p (+100) in turn. For any set of data, the data were extracted in the zone from 2.5 m on the left to 2.5 m on the right of each point based on the positional coordinates of data. The average value of data from each zone was taken as the value of the corresponding point. This process transformed the continuous velocity, lateral offset, accelerator power and steering wheel angle into 141 sets of point data, denoted as $P{V_i}$ , $P{L_i}$
 , $P{A_i}$
 , and $P{S_i}({i = 1,2, \ldots,141} )$
 .
2.7 Data analysis
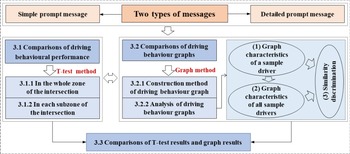
According to the hypotheses, the T-test was used to explore the differences in driving behavioural performance in response to the two prompt messages. The driving behaviour graphs in the two conditions were then constructed, and the characteristics of these graphs were mined and the similarities of these graphs were discriminated. Finally, the analysis results of T-test and graphs were compared. The detailed data analysis structure is shown in Figure 3.
The data analysis structure

3. Results
3.1 Comparisons of driving behavioural performance under the two prompt messages
3.1.1 In the whole zone of the intersection
To gain a preliminary understanding of vehicle operation performance and driver manoeuvre behaviours in the whole zone guided by the two prompt messages, four indicators were proposed based on preprocessed data, and T-test was conducted to examine the differences between the simple and detailed prompt messages on these indicators. The four indicators were denoted as ${V_w}$ , ${L_w}$
 , $\; {A_w}$
 and ${S_w}$
 , being the average of all point velocity, the absolute value of all point lateral offset, all point accelerator power and the absolute value of all point steering wheel angle in the whole zone, respectively. It should be noted that lateral offset and steering wheel angle were vectors, thus, their values were absolutised to exclude the effects of direction symbols on the experimental results.
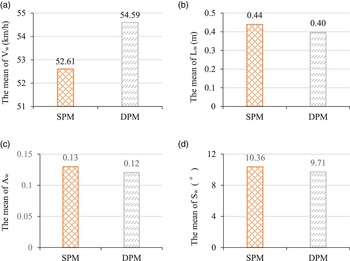
The results are shown in Figure 4. From vehicle operation performance, the mean of ${V_w}$ using simple and detailed prompt messages was 52.61 km/h and 54.59 km/h, respectively, and the means of ${L_w}$
 using them were 0.44 m and 0.40 m. T-test results showed that the means of ${V_w}$
 for the two prompt messages had significant difference (T = −2.464, p = 0.019); however, there was no significant difference in the mean of ${L_w}$
 (T = 0.547, p = 0.588). From driver manoeuvre behaviours, the mean of ${A_w}$
 using simple and detailed prompt messages was 0.13 and 0.12, respectively, and the mean of ${S_w}$
 using them was 10.36° and 9.71°, respectively. T-test results indicated that the difference of two prompt messages was not significant in the mean of ${A_w}$
 (T = −1.013, p = 0.318), but it was significant in the mean of ${S_w}$
 (T = 2.400, p = 0.022). Through the above analysis, it can be seen that there were significant differences in two behavioural performance indicators among the selected four indicators, thus, H1 was supported.
Driving behaviour and performance in the whole zone of the intersection: (a) the mean of ${V_w}$ of two prompt messages, (b) the mean of ${L_w}$
 of two prompt messages, (c) the mean of ${A_w}$
 of two prompt messages, (d) the mean of ${S_w}$
 of two prompt messages

3.1.2 In each subzone of the intersection
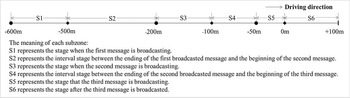
To systematically explore vehicle operation performance and driver manoeuvre behaviours at different broadcasting stages guided by the two prompt messages, the whole zone was divided into six subzones (S1–S6) based on the broadcast start and completion positions of the detailed prompt message. The range and meaning of each subzone are shown in Figure 5. The averages of the velocities, lateral offsets, accelerator powers and steering wheel angles at all points of each subzone were calculated; and they are denoted as ${V_j}$ , ${L_j}$
 , $\; {A_j}$
 , and ${S_j}({j = 1,2,3,4,5,6} )$
 . It should be noted that lateral offset and steering wheel angle are vectors, thus, their values at each point are absolutised to exclude the effects of direction symbols on experimental results.
The range and meaning of each subzone

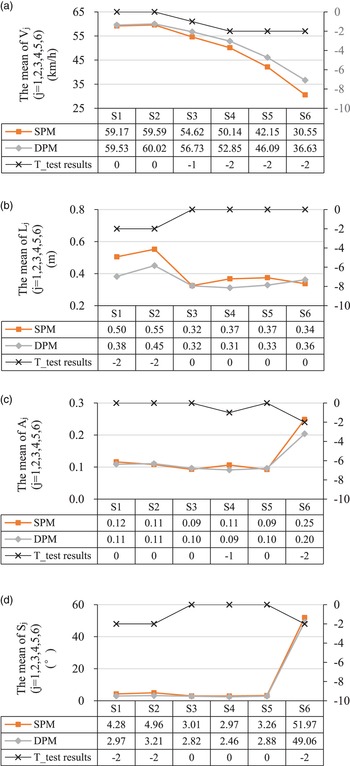
Figure 6(a) shows that velocity under the detailed prompt message condition was partially or entirely significantly higher than under the simple message condition in S3 (T = −1.741, p = 0.090), S4 (T = –2.528, p = 0.016), S5 (T = −3.421, p = 0.002) and S6 (T = −6.922, p = 0.000), but the velocity showed no significant difference in S1 (T = −0.264, p = 0.794) and S2 (T = −0.374, p = 0.711). Figure 6(b) indicated that the difference of lateral offset when guided by the two prompt messages was significant in S1 (T = 4.470, p = 0.000) and S2 (T = 3.975, p = 0.000), and not significant in S3 (T = 0.022, p = 0.983), S4 (T = 1.080, p = 0.287), S5 (T = 0.821, p = 0.417) and S6 (T = −0.454, p = 0.653). Figure 6(c) shows that the accelerator power in response to the simple prompt message was partially or entirely significantly higher than that of detailed prompt message in S4 (T = 1.849, p = 0.073) and S6 (T = 2.880, p = 0.007), and there was no significant difference in S1 (T = 1.584, p = 0.122), S2 (T=−0.696, p = 0.491), S3 (T=−0.559, p = 0.579) and S5 (T=−0.374, p = 0.711). Figure 6(d) indicates that the change in steering wheel angle in response to the simple prompt message was significantly larger than under the detailed prompt message in S1 (T = 2.505, p = 0.017), S2 (T = 2.685, p = 0.011) and S5 (T = 4.226, p = 0.000), but there were no significant differences in S3 (T = 0.718, p = 0.477), S4 (T = 1.474, p = 0.149) and S6 (T = 1.099, p = 0.279).
Driving behaviour and performance in each subzone of the intersection: (a) the mean of Vj(j = 1, 2, 3, 4, 5, 6) using two prompt messages, (b) the mean of Lj(j = 1, 2, 3, 4, 5, 6) using two prompt messages, (c) the mean of Aj(j = 1, 2, 3, 4, 5, 6) using two prompt messages, (d) the mean of Sj(j = 1,2,3,4,5,6) using two prompt messages

Based on above analysis, it can be seen that the driving behaviour performance in each subzone exhibited significant differences between the simple and detailed prompt message conditions in at least one indicator and at most three indicators. Thus, H1 is supported.
3.2 Comparisons of driving behaviour graphs for the two prompt messages
3.2.1 Method of driving behaviour graph construction
The driving behaviour graph was constructed on the basis of the preprocessed data of velocity, lateral offset, accelerator power and steering wheel angle. Each subzone was treated as an individual graph construction unit in order to describe the driving behaviour characteristics at different broadcasting stages visually and in detail. There were four steps for constructing a driving behaviour graph, namely: node extraction, node creation, graph construction and graph similarity discrimination. Node extraction was to identify the behaviour or performance with significant changes. Node creation was to use circles with certain attributes to represent the characteristics of the extracted nodes. Graph construction was to connect the created nodes based on the ordering of their occurrence position. Graph similarity discrimination was to calculate the similarity values of driving behaviour graphs using the two prompt messages.
3.2.1.1 Node extraction
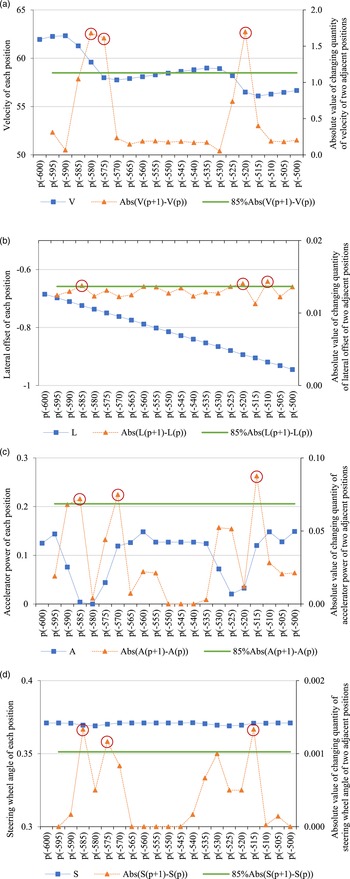
In this study, the 85th percentile value of absolute value in behaviour change at adjacent positions was taken as the reference value to extract nodes. This method of node extraction has been proved to be feasible in a previous study (Wu, Reference Wu2017). The formula of node extraction is as follows:

where $f(p)$ is the data on vehicle operation performance and driver manoeuvre behaviours at position p, including velocity, lateral offset, accelerator power and steering wheel angle; $\Delta f$
 is the changing quantity of driving behaviour and performance at positions p and $p + 1$
 ; Percentile (0.85) is the 85th percent value of a set of data.
According to Equation (1), the change nodes of velocity, lateral offset, accelerator power and steering wheel angle can be obtained. The node extraction process for a driver in S1 is shown in Figure 7, where the points circled in red represent the extracted nodes.
Schematic diagram of node extraction of S1: (a) extraction of velocity change nodes, (b) extraction of lateral offset change nodes, (c) extraction of accelerator power change nodes, (d) extraction of steering wheel angle change nodes

3.2.1.2 Node creation
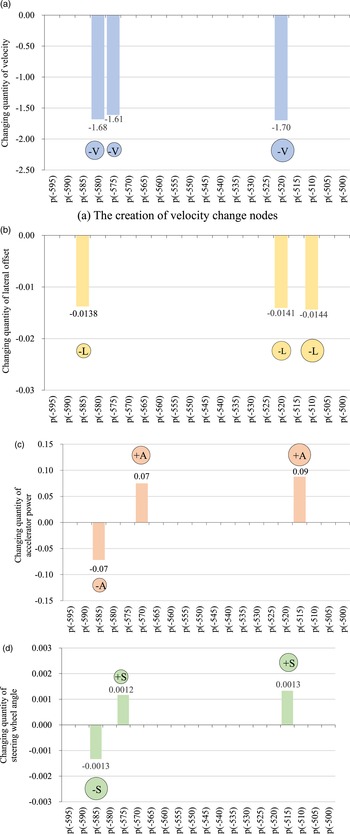
In this study, circles are used to represent the extracted nodes, and they are also given certain attributes to better describe the changing characteristics of driving behaviour or performance, as shown in Figure 8. The letters in the circles represent the type of node. V, L, A and S represent velocity change node, lateral offset change node, accelerator power change node and steering wheel angle change node, respectively. The signs in the circle represent the changing trend or direction of the behaviour or performance of two adjacent positions. The sizes of these circles represent the changing quantity of behaviour or performance of two adjacent positions. The smallest circle representing the absolute value of changing quantity is between the 85% quantile and 90% quantile. The medium-sized circle is between the 90% quantile and 95% quantile. The largest circle is above 95%. According to the above node creation criteria, the extracted nodes are represented by circles with certain attributes.
Schematic diagram of node creation of S1: (a) creation of velocity change nodes, (b) creation of lateral offset change nodes, (c) creation of accelerator power change nodes, (d) creation of steering wheel angle change nodes

3.2.1.3 Graph construction
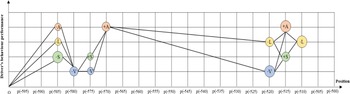
The created nodes, shown in Figure 8, are the basic elements of graph construction. First, a coordinate system was created, and the point positions of each subzone were taken as the horizontal axis, and the driving behaviour and performance were taken as the vertical axis. The intervals of the horizontal axis and vertical axis were all set equally. All the extracted nodes are represented in the constructed coordinate system according to the occurrence position of each node. For a specific position, only one behaviour or performance generates a node; the code of this position is the single node. When there are two or more driving behaviour- and performance-generated codes, the code of this position is the combination of the generated nodes, and the nodes are placed from top to bottom according to the alphabetical order of the node symbol. Next, a straight line which starts from the origin is used to connect each node in obedience to the sequence of occurrence position. The graph thus constructed based on the created nodes is shown in Figure 9.
Schematic diagram of graph construction of S1

3.2.1.4 Graph similarity discrimination
To quantify the difference of behaviour and performance of each driver in response to the two prompt messages, a method is proposed to calculate the similarity of driving behaviour graphs based on a previous study (Wu, Reference Wu2017). For two driving behaviour graphs to be compared, their longest common subsequence (LCSS) should be calculated first. LCSS is defined as the longest common sequence in two or more sequences (Gong et al., Reference Gong, Pei, Sun and Luo2011), and its calculation formula is as follows:

where $LCSS\; ({I,J} )$ is the LCSS of driving behaviour graphs I and J; K is a function representing the type of behaviour performance of drivers at a specific position, which includes individual change nodes of velocity, lateral offset, accelerator power and steering wheel angle, and any combination of these four types of nodes; m is the number of point positions with node data of graph I; n is the number of point positions with node data of graph J. The distance of LCSS $({{D_{LCSS}}} )$
 is then used to discriminate the similarity of graphs of I and J. The calculation formula of ${D_{LCSS}}({I,J} )$
 is as follows:

where ${D_{LCSS}}({I,J} )$ is the similarity distance between driving behaviour graphs I and J; min (m, n) is the minimum value of m and n.
The value of ${D_{LCSS}}$ is between 0 and 1, and it is inversely proportional to the similarity degree of the graph. Specifically, the smaller is the ${D_{LCSS}}({I,J} )$
 value, the greater the similarity of graphs of I and J.
3.2.2 Analysis of driving behaviour graphs
3.2.2.1 Analysis of driving behaviour graph characteristics of a sample driver
According to the graph construction method, the driving behaviour graph for each driver using the two prompt messages was constructed in units of subzones. However, in view of the word limit, this paper presents only the driving behaviour graphs of one sample driver (N27) in six subzones. Table 2 shows that the value of ${D_{LCSS}}$ of driver N27 is the smallest among all participants. Considering that the value of ${D_{LCSS}}$
 is inversely proportional to the similarity degree of graphs, if the driving behaviour graphs with the smallest ${D_{LCSS}}$
 value have obvious differences, then the differences in the driving behaviour graphs with larger ${D_{LCSS}}$
 values will be more significant. Thus, this study selected driver N27 as a sample driver to identify in a preliminary way the differences of behavioural performance under the guidance of two prompt messages.
Similarity discrimination results of driving behaviour graphs

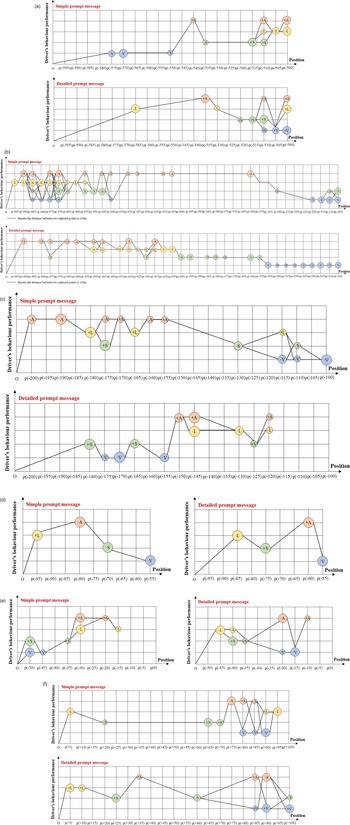
As shown in Figure 10, in S1, the behaviour changes of this driver mainly occurred between p (−520) and p (−500), but the direction and types of behaviour changes varied with the type of prompt messages. In S2, the behavioural changes guided by the simple prompt message mainly occurred between p (−495) and p (−400), and p (−220) and p (−205), while the changes guided by the detailed prompt message were relatively balanced across the whole subzone. In S3, the behaviour changes when the driver used the simple prompt message mainly occurred at both ends of the whole subzone [p (−200)–p (−155); p (−130)–p (−100)] while the changes mainly occurred in the middle of the whole subzone [p (−180)–p (−120)] when the driver used the detailed prompt message. In S4, although the types of change nodes guided by the two prompt messages were the same, there were differences in change trend (or direction). In S5, when the driver used the detailed prompt message, the change positions of driver manoeuvre behaviour and vehicle operating performance in the same dimension were closer than those when the driver used the simple prompt message. In S6, the behaviour changes of this driver mainly occurred between p (+60) and p (+100). There were more types of behaviours with significant changes guided by the simple prompt message than with the detailed prompt message. In general, there were obvious differences in the positions, types and frequencies of driving behaviours of driver N27 when guided by two prompt messages.
Driving behaviour graphs for sample driver guided by two prompt messages in six subzones (S1–S6) of the intersection: (a) S1, (b) S2, (c) S3, (d) S4, (e) S5, (f) S6

3.2.2.2 Analysis of driving behaviour graph characteristics of all drivers
To further explore the behavioural performances of all drivers in the two conditions, this section analyses the types of node combinations of all drivers and the frequencies of all the node combinations. However, it should be noted that this section does not analyse the changing positions of driving behaviours of all drivers because this paper has not listed the driving behaviour graphs of all drivers.
As shown in Table 3, whether guided by the simple or detailed prompt message, one-node and two-node were the main types of node combinations because their frequencies were far greater than the frequencies of three- and four-node combinations. Further analysis found that in the first four subzones, the sum of one-node and two-node types and the sum of the frequencies of all one-node and two-node combinations when the driver was guided by the detailed prompt message were greater than that when the driver was guided by the simple prompt message; while the sum of three-node and four-node types and the sum of the frequencies of all three-node and four-node combinations when the driver was guided by the detailed prompt message were less than that when the driver was guided by the simple prompt message. However, results from the last two subzones were the opposite to that of the first four subzones. From the behavioural performance of all driver samples, there were obvious differences between the simple and detailed prompt messages in the types of node combinations and frequency of all node combinations.
Summary of node combination of all drivers guided by the two prompt messages

3.2.2.3 Similarity discrimination of driving behaviour graphs
Through the above analyses, it can be seen that whether from one sample driver or all drivers, there were significant differences in the behaviour changes of drivers when guided by the two different prompt messages. To further quantify these differences, the similarities of driving behaviour graphs in the whole zone under the two conditions were evaluated. The similarity discrimination results of driving behaviour graphs are shown in Table 2. The values of ${D_{LCSS}}$ of all drivers were all above 0.9, and there were 14 drivers whose ${D_{LCSS}}$
 values were 1. It has been pointed out that two driving behaviour graphs are deemed to be not similar when the value of ${D_{LCSS}}$
 is greater than 0.7 (Wu, Reference Wu2017). According to this criterion, it can be found that the driving behaviour graphs of each driver under the guidance of the simple and detailed prompt messages were dissimilar. Therefore, H2 is supported.
3.3 Comparisons of T-test results and graph results
T-test results showed that from the driving behaviour performance in the whole zone and each subzone of the intersection, there were some differences between responses to the simple and detailed prompt messages. And the similarity discrimination results indicated that driving behaviour graphs in the whole zone guided by the two prompt messages were dissimilar. The T-test results on driving behaviour performance were consistent with the similarity results of driving behaviour graphs, as expected, which indicates that the H3 is supported.
4. Discussion
Through Figure 4, it can be seen that, when guided by the detailed prompt message, drivers had better ability to control the steering wheel, and the operation of the vehicle was more efficient. These findings imply that the detailed prompt message offered better guidance. However, some previous studies on navigation voice prompt messages found that drivers had a better driving performance when guided by a simple prompt message (Wu et al., Reference Wu, Huang and Wu2009; Dalton et al., Reference Dalton, Agarwal, Fraenkel, Baichoo and Masry2013). The difference between the results of this study and previous studies may be attributed to the variations in the contents of the simple and detailed prompt messages, the experimental schemes and the driving performance indicators. In addition, this study found that the subzones with higher velocity also had larger lane offset (such as S1, S2), which may be related to the driver's workload. A study found that the driving load increased with the increase of driving speed (Yuan et al., Reference Yuan, Guo, Fu and Chen2014). The velocities in S1 and S2 were higher, which indicates that the drivers’ workload was also higher in these two subzones. Higher driving load will weaken the driver's ability to control the vehicle; thus, the lateral offsets in these two subzones were also larger.
As shown in Table 3, the frequency of node combinations with no less than three nodes was larger with a simple prompt message than with the detailed prompt message in the first four subzones, while the results of the last two subzones were opposite to those of the first four subzones. This difference may be caused by the content of the prompt messages. In this study, the simple prompt message only provided direction information, without distance, road and lane information like the detailed prompt message, which may lead drivers to pay more attention to road information because the navigation instructions were too simple, especially in the first four subzones. However, a driver's cognitive resources are limited (Tversky and Kahneman, Reference Tversky and Kahneman1973); and the extra attention to road information may affect the driver's handling of the vehicle. Thus, the vehicle ran less smoothly when the driver was guided by the simple prompt message at these subzones. Because drivers had made relatively sufficient preparations for the turn in the first four subzones, they did not need to continue to adjust the vehicle operation drastically when they arrived at the last two subzones. Thus, the smoothness of the vehicle when the driver was guided by the simple prompt message was better than when the driver was guided by the detailed prompt message in the last two subzones.
This study found that the T-test results on behavioural performance were consistent with the similarity results of driving behaviour graphs, which indicates that the proposed method of constructing the driving behaviour graph was feasible based on the four indicators of velocity, lateral offset, accelerator power and steering wheel angle. This method laid a foundation for exploring the characteristics of operating performance and driver manoeuvre behaviours of other vehicles because of the expandability of indicators in graph. In addition, through the values of ${D_{LCSS}}$ of all drivers, it can be seen that although the two prompt messages provided to each driver are exactly the same, their effects on each driver still had some differences. These differences were mainly caused by individual differences of drivers in that other potential factors were strictly controlled. Previous studies have confirmed that the individual characteristics of drivers (such as age and driving experience) will affect the behaviour of drivers while using navigation aids (Li and Yuan, Reference Li and Yuan2011; Emmerson et al., Reference Emmerson, Guo, Blythe, Namdeo and Edwards2013). This result implies that individual differences among drivers cannot be ignored when constructing the overall driving behaviour graph for all drivers while under the guidance of navigation information.
Although this study indicates that it is feasible to use the driving behaviour graph to express driving behaviour characteristics guided by different navigation information, there are still some limitations. Firs, the proposed driving behaviour graph is mainly suitable for describing the characteristics of individual driving behaviours, which cannot describe the overall behaviour pattern for all drivers well. In future study, the authors will actively explore other graph methods that can display well the overall behaviour pattern for all drivers, to provide a reference for exploring the overall behaviour change characteristics under the guidance of navigation information. Second, this study mainly focused on the differences of individual driving behaviour graphs guided by two prompt messages. In future study, the authors will explore the characteristics of driving behaviour graphs under the effects of navigation information for drivers with different individual characteristics (such as age and driving experience) to identify the guidance effects of different navigation information, further promoting the popularisation of personalised navigation information services. Third, this study selected the 85% quantile as the threshold value of behaviour node extraction based on existing applications and research. How quantile size affects the characteristics of driving behaviour graphs was not explored in this paper. In future study, the authors will explore the differences in driving behaviour graphs of different quantile values, and determine an appropriate quantile value, providing theoretical support for the selection of quantiles in the research of driving behaviour graph.
5. Conclusion
This study took two different voice prompt messages as a case study to verify whether a graph is suitable for describing the driving behaviour characteristics of drivers under the effects of navigation information. The conclusions of this study are as follows:
1. There were some differences in behavioural performance of drivers guided by simple and detailed prompt messages, both from the whole zone of the intersection or from each subzone of the intersection.
2. There were also significant differences in the behavioural changes (such as change types and frequency) demonstrated by driving behaviour graphs under the two conditions of the simple and detailed prompt messages, which is true for both a sample driver and all drivers.
3. The driving behaviour graphs for the zone between 600 m upstream and 100 m downstream of the intersection stop bar under the guidance of simple and detailed prompt messages were dissimilar.
4. The developed method of construction of the driving behaviour graph can be used for describing the driving behaviour characteristics of drivers under the effects of navigation information.
A major contribution of this study is to confirm that a graph is applicable to the description of driving behaviour characteristics under the guidance of navigation information. The driving behaviour graph can reveal how navigation information affects driving behaviours, what driving behaviours are affected by navigation information, and how often navigation information affects driving behaviours, which provides a new method for exploring the mechanism for the effects of different navigation information on drivers and for other traveller information systems. In addition, this method can analyse the driving behaviour characteristics of each driver under the effects of navigation information systematically and visually, providing a measurement criterion for individual-oriented evaluation of navigation information effectiveness, and promoting the development of an individual-oriented optimisation mode of navigation information.
Acknowledgements
The authors thank Dr Li of China Foreign Affairs University for helping them with the English language editing.
Financial Support
This study was sponsored by the State Key Laboratory of Automotive Safety and Energy under Project No. KF2017.
Conflict of Interest
There are no known competing financial interests or personal relationships that could have appeared to influence the work reported in this paper.