1. Introduction
Deforestation and forest degradation significantly affect the global carbon (C) cycle: directly when forest biomass is burned and carbon dioxide (CO2) is emitted into the atmosphere, and indirectly after land-use change takes place, resulting in further decomposition of organic matter, soil respiration and soil degradation and erosion processes (Schulze et al., Reference Schulze, Beck and Müller-Hohenstein2002). Globally, land-use changes contributed to a net release of 5.5±2.6 Pg CO2 yr−1 during the period 1990–2005, which represented about 12 per cent of the total anthropogenic CO2 emissions (Le Quéré et al., Reference Le Quéré, Raupach and Canadell2009). While the African continent contributes less than 4 per cent to the global balance of CO2 emissions (Canadell et al., Reference Canadell, Raupach and Houghton2009), it accounts for 20 per cent of the global net CO2 emissions from land-use, mainly from forest degradation and deforestation, and for approximately 40 per cent of emissions from forest fires (Kituyi et al., Reference Kituyi, Wandiga, Andreae, Helas and Low2005; van der Werf et al., Reference van der Werf, Randerson, Giglio, Collatz, Kasibhatla and Arellano2006). Since forests contain large aboveground C stocks, up to 255 MgC ha−1 in tropical rainforests (IPCC, 2003), there is a growing concern to avoid the loss of such stocks.
Tropical forests are particularly vulnerable to climate change itself. Evidence has been presented that the tropical rainforest zone of sub-Saharan Africa (SSA) was the driest tropical rainforest region over the period 1960–1998 and that it has become drier in recent decades (Malhi and Wright, Reference Malhi, Wright, Malhi and Philips2005). The African continent was also identified as being the most vulnerable to climate change and a priority region by the United Nations Framework Convention for Climate Change (UNFCCC, 2006). Climate perturbations could lead to further drying, making the forests more vulnerable to extreme climate phenomena and increasing the risk of forest fragmentation and fires. Therefore, the preservation of the health of forest ecosystems in Africa is central to any mitigation policy in the region (Williams et al., Reference Williams, Hanan, Neff, Scholes, Berry, Denning and Baker2007).
Forests have increasingly been considered a critical issue under the UNFCCC negotiations, as the objective of mitigating climate change is unlikely to be reached without substantial action on deforestation and forest degradation. However, the question of how to include deforestation and forest degradation in an international mitigation scheme under the UNFCCC has been a difficult technical and political issue to resolve from the start of the negotiations in 1992 (Gitz, Reference Gitz2004). This is also reflected in the great number of proposals and incentive frameworks made on the topic (Parker et al., Reference Parker, Mitchell, Trivedi and Mardas2008). Following a process that started during the 13th Conference of Parties (COP) to the UNFCCC at Bali in 2007, a Decision (4/CP.15) was adopted in Copenhagen (UNFCCC, 2009) on methodological guidance for what is now called ‘REDD+’ (for ‘Reducing Emissions from Deforestation and forest Degradation and the role of conservation, sustainable management of forests and enhancement of forest C stocks in developing countries’). This agreement at the methodological level was accompanied by several financial pledges by developed countries. During the Oslo Climate and Forest Conference, convened in May 2010, several developed countries jointly pledged $4 billion to support REDD+ policies and measures. In December 2010 in Cancun, the 16th meeting of the COP adopted a Decision including ‘Policy approaches and positive incentives on issues relating to reducing emissions from deforestation and forest degradation in developing countries; and the role of conservation, sustainable management of forests and enhancement of forest carbon stocks in developing countries’. While there is high interest in seeing such initiatives take form, more work remains to be done to ensure that national-level REDD+ programmes are successfully established and implemented. Specifically, a key challenge for developing countries wishing to take part in the expected REDD+ mechanism will be to design operational, national forest monitoring systems to support the Measurement, Reporting and Verification (MRV) requirements of the Decisions and the UNFCCC.
Challenges to ensure a suitable implementation of REDD+ activities are further complicated by three important distinctive issues. First, many human-induced drivers of various kinds (economic, institutional, etc.) interact and may result in forest cover loss and degradation. As the dynamics that animate the various political, institutional, economic and social factors that shape land-use decisions and trends are both complex and interrelated, it is difficult to assess their specific role in driving deforestation and forest degradation. Any REDD+ mitigation mechanism seeking to provide effective incentives to reduce forest loss should take into account the complexity of the aforementioned underlying drivers and, under the recent COP16 Decision, parties are indeed encouraged to find effective ways to reduce the human pressure on forests that results in greenhouse gas (GHG) emissions, including actions to address the drivers of deforestation (article 68).
Second, the establishment of accurate quantification systems is essential in the context of REDD+ as it is a results-based mechanism. This means that countries would only receive compensation for reducing loss, enhancing or conserving based on verifiable results that have been measured and reported to the UNFCCC. The need for accurate quantification applies both to the determination of any reference levels and/or reference emission levels, and to the estimation of the results as they are compared to such levels. Consequently, countries will have to put in place a system to assess forest cover, C stocks and their changes, in space and time, and report on any uncertainties in their data. This requires a harmonized approach for the identification of different types of forests and the obtention of sufficient and reliable ground data on forest C stocks and stock change.
Third, several countries face important technical, financial and institutional challenges that exacerbate the difficulty of designing and implementing national forest monitoring systems. Technologies exist such as satellite imagery and in situ flux measurement techniques. Ways must be found for appropriate integration of specific national circumstances while taking into account the UNFCCC reporting guidelines; these elements are considered in the REDD+ Decisions.
Any effective REDD+ system in SSA will have to address the three challenges of the fight of multiple underlying drivers (section 2), the necessity of accurate quantification of C budgets (section 3), and the implementation of forest and carbon monitoring systems for REDD+ (section 4).
It should be noted that COP 16 has requested that the Subsidiary Body for Scientific and Technological Advice develop a work program: to identify land use, land-use change and forestry activities in developing countries, in particular those that are linked to the drivers of deforestation and forest degradation; to identify the associated methodological issues to estimate emissions and removals resulting from these activities; and to develop, as necessary, modalities for measuring, reporting and verifying anthropogenic forest-related emissions by sources and removals by sinks, forest carbon stocks, forest carbon stock and forest area changes resulting from the implementation of REDD+ activities. This paper aims at characterizing the challenges for implementing effective REDD+ mitigation activities in SSA.
2. Drivers of forest degradation and deforestation in Sub-Saharan Africa
The design of REDD+ policies should first rely on the identification and understanding of the drivers of deforestation and forest degradation. Previous studies have identified, described and assessed numerous drivers and impacts of the process of deforestation (Angelsen and Kaimowitz, Reference Angelsen and Kaimowitz1999; Soares-Filho et al., Reference Soares-Filho, Nepstad, Curran, Cerqueira, Garcia, Ramos, Voll, McDonald, Lefebvre and Schlesinger2006; DeFries et al., Reference DeFries, Rudel, Uriarte and Hansen2010). Quantification of the relative strength and impact of the different drivers of deforestation is a difficult task, particularly in SSA where data on deforestation itself is not well known (Tiffen, Reference Tiffen2003). Below we present some of the proximate and underlying deforestation and forest degradation factors in the SSA context, such as unsustainable forest management, fuelwood and agriculture, and drivers related to the social, economic and political context of forests.
2.1 The forestry sector
Forestry in SSA represents a major source of livelihood for a large proportion of the population. It is an important source of employment in the region, providing jobs for approximately 500,000 people (Lebedys, Reference Lebedys2008). It is a particularly important source of income and employment in remote areas. Still, the contribution of forestry to the wider economy remains quite marginal. In the countries of the Congo Basin, for instance, forestry represents just 0.22–6.5 per cent of GDP (de Wasseige et al., Reference de Wasseige, Devers, de Marcken, Eba'a Atyi, Nasi and Mayaux2009). It has also been reported that the productivity of the timber industry in SSA is the lowest in the world (Lebedys, Reference Lebedys2008).
The evolution of the forestry sector in SSA over the past century has witnessed a gradual transition from large-scale concessions (pre-independence) to smaller scale and more specialized operations (post-independence) (Nasi et al., Reference Nasi, Cassagne and Billand2006). The high demand for timber coming from Europe in the post-World War II years contributed significantly to the expansion of the infrastructure, facilitating the growth of the forestry sector in SSA. More recently, European demand for timber from SSA is supplemented by North American and, increasingly, Asian markets (ITTO, 2008). This process has occurred in conjunction with the development of technical capacity as well as infrastructure, such as roads, which have in turn facilitated access for agricultural expansion and harvesting of fuelwood and non-timber forest products such as bushmeat (Geist and Lambin, Reference Geist and Lambin2001). Little consideration was given to the sustainability of the forestry industry for most of the 20th century; it was only in the 1990s that ecological criteria and formal management plans were incorporated into SSA forestry policies (Nasi et al., Reference Nasi, Cassagne and Billand2006). In many instances, roads have been created specifically to facilitate the timber trade, thereby making forests more accessible to further exploitation. As a result, it has been reported that the forests of SSA are among the most fragmented in the world, especially in the western part of the continent (Rudel and Roper, Reference Rudel and Roper1997).
The impacts of timber extraction on forest cover extend beyond the removal of trees, due to the creation of roads, skid trails, logging bays and tree falls in the exploited areas. Cases of over-exploitation of the timber resource have also been observed (Birikorang et al., Reference Birikorang, Okai, Asenso-Okyere, Afrane and Robinson2001). This study found that in 1995, the timber industry's extraction was far above the annual allowable cut with an over-exploitation ranging from 22 to 532 per cent for different tree species in Ghana. Fluctuations in timber prices vary according to market demand but also according to the type of tree species being exploited. It has been found that only 50 per cent of the total volume of the biomass is extracted, leaving the other half in the forest to decompose (Aina et al., Reference Aina, Adetogun, Adedokun and Onilude2005). While significant progress has been made in terms of developing best practices for the timber industry, such as those certified by the Forest Stewardship Council, only 5.2 per cent of the forests of the Congo Basin are currently certified (de Wasseige et al., Reference de Wasseige, Devers, de Marcken, Eba'a Atyi, Nasi and Mayaux2009). High costs as well as lack of technical and institutional capacity have been highlighted as significant barriers to the implementation of sustainable forest management in the region (Kalu and Modugu, Reference Kalu and Modugu2010).
2.2 Fuelwood
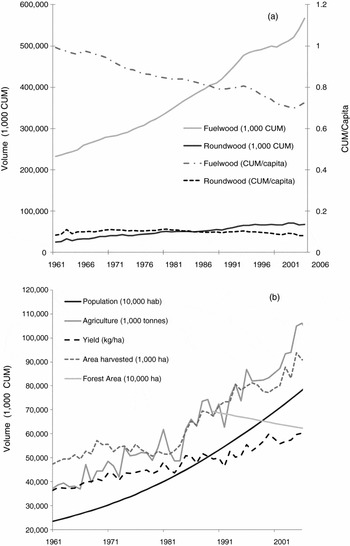
In SSA, the extraction of timber from forests is eight times less significant than the extraction of fuelwood (figure 1a). Approximately two-thirds of global fuelwood use occurs in SSA (FAOSTAT), where it is used by 80 per cent of the population as the main source of energy (UN, 2007). Despite a growing urban population, the use of fuelwood remains the main source of energy in cities (Arnold et al., Reference Arnold, Köhlin and Persson2006). Recent trends suggest that, in urban centres, fuelwood is gradually being replaced by charcoal, which is considered a ‘transition fuel’ on the road towards the greater integration of electricity and LPG (Arnold et al., Reference Arnold, Köhlin and Persson2006). As is the case for timber and other resources, the availability of fuelwood continues to decrease as the demands of a growing population increase. Current levels of extraction largely exceed the regenerative capacity of the forests (Arnold et al., Reference Arnold, Köhlin and Persson2006). Although it is difficult to clearly map the relationship between the removal of fuelwood and deforestation, as a lot of fuelwood is collected from non-forest lands (e.g. pastures, savannahs), the extraction of fuelwood has been found to be the most significant driver of the loss of forest cover in SSA (Ninnin, Reference Ninnin1994). However, it remains difficult to assess the impacts of this activity, as it is largely informal and difficult to monitor.
Evolution of agricultural, timber and roundwood production in SSA: (a) represents the evolution of fuelwood and roundwood production; (b) represents the evolution of cereal production, population and forest losses.
Note: CUM, cubic meters.
Source: The data were obtained from FAOSAT.

2.3 Agriculture
With a population that is mainly rural (62 per cent of the total population) (UNFPA, 2007), agriculture represents the main source of income in SSA. Approximately 70 per cent of the population works in the agricultural sector, of whom about half live on less than $1 per day (World Bank, 2008). As shown in figure 1b and data from FAOSTAT, agricultural productivity has almost stagnated in the last decade, and is increasingly unable to meet the demands of a growing population (Tiffen, Reference Tiffen2003; Hazell and Diao, Reference Hazell and Diao2005; FAO, 2006c). Some of the factors limiting the productivity of agriculture include the degradation of soils and loss of fertility, diseases, climate change, insufficient capital and inadequate policies.
It has been suggested that the slow development of the agricultural sector in SSA can be explained by the poor competitiveness of the African model of agricultural development in the international marketplace, which has led to a strong dependency on foreign supply (Diao et al., Reference Diao, Hazell and Thurlow2010). Moreover, the underdeveloped transport systems and infrastructure have significantly limited the capacity of developing national and regional markets for agricultural products, thereby allowing greater competitiveness for foreign products (Hazell and Diao, Reference Hazell and Diao2005). More recently, it has been observed that African agricultural policies have tended to enhance comparative advantages for specific cash crops, at the expense of subsistence agriculture on which most of the smallholders depend (Beintema and Stads, Reference Beintema and Stads2004).
Agricultural intensification, through the increase of yields, is a cornerstone of both food security and land-use policies in SSA. The Food and Agricultural Organisation of the United Nations (FAO) estimates that the population in SSA is expected to rise by 102 per cent until 2050 (FAOSTAT). However, the current trend in cereal yield increase in SSA is only +0.14% yr−1 for cereals for the period 2000–2007. Without an increase in yields, necessary increases in agricultural production in SSA are likely to result from further land clearing or massive imports. Maintaining the current SSA per capita domestic food production and consumption rates, trade levels, market prices and agricultural mix without increasing SSA agricultural areas would require an additional intensification of the agricultural production per ha of +1.8% yr−1 until 2050, more than 10 times the current rate of increase in agricultural yields in SSA.
2.4 Underlying factors of forest degradation and deforestation
Several indirect factors have been associated with the processes of deforestation and forest degradation in SSA. Generally speaking, the FAO (2003) mentions forest policy, persistent conflict and war, demography and population movement, low economic growth and poverty, debt and dependence on development assistance, constraints arising from globalization, predominance of the informal sector and inadequate investment as the main underlying drivers of deforestation and degradation in the region.
Arguably one of the most complex factors that has hindered efforts to ensure a more sustainable management of forest resources in SSA is the issue of land tenure. In many instances, deforestation is motivated via attempts by people to secure their land rights through commercial exploitation. In many countries, the unclear (and often conflicting) relationship between traditional and administrative entities has made land tenure and property rights particularly complex issues to resolve (Cox et al., Reference Cox, Munro-Faure, Dey-Abbas, Rouse and Baas2003). It has been shown in Ghana that the formalization of land tenure has facilitated the process of intensified agricultural production and enhanced productivity (Kasanga, Reference Kasanga1988; Goldstein and Udry, Reference Goldstein and Udry2005).
More generally, inadequate implementation and compliance with forest and related policies has been a considerable hurdle to overcome in many countries (Buba et al., Reference Buba, Karsenty and Bassaler2010). The persistent presence of conflicts in many parts of the continent has seriously compromised the capacity of many governments to adequately manage their natural resources. Weak governance makes the development prospects more difficult, especially in terms of attracting foreign investments (Buba et al., Reference Buba, Karsenty and Bassaler2010). As a result, most countries lack the means and the capacity required to implement the tasks needed to ensure a sustainable management of their natural resources. This is one of the reasons that REDD+ was built on a three-phase approach: (1) readiness process, (2) results-based demonstration activities, and (3) results-based actions that should be fully measured, reported and verified (article 73 in the Cancun agreements).
The lack of institutional capacity is a particularly important constraint in the implementation of the reforms necessary to both meet people's needs and better manage the natural resources that are increasingly degraded (UNEP, 2006). First, we note that most of the institutions lack the financial, technical and human resources to enable the management of their territory. Second, agricultural R&D is declining in half of the SSA countries (Beintema and Stads, Reference Beintema and Stads2004), putting at risk their ability to produce the necessary information for the implementation of sustainable land management policies. In the following section we seek to analyze the state of knowledge, the quantification of C stocks, C flows and the contribution from deforestation and forest degradation.
3. The current sub-Saharan carbon budget
3.1 Carbon stocks in SSA
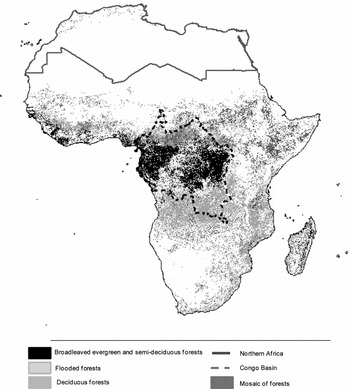
Forest C can be divided into aboveground and belowground C, the latter including the root component and the soil organic matter component. Most of the forest C stock in Africa is situated in the SSA region and more precisely in the Congo Basin (figure 2). Estimates of average forest C density in SSA biomes range from 63 to 265 MgC ha−1 (Bombelli et al., Reference Bombelli, Henry, Castaldi, Adu-Bredu, Arneth, de Grandcourt, Grieco, Kutsch, Lehsten, Rasile, Reichstein, Tansey, Weber and Valentini2009). Tropical rain forests reveal the highest C density (155, 57 and 52 MgC ha−1 for, respectively, aboveground carbon (AGC), root carbon (RC) and soil organic carbon (SOC), while minimum values are found in subtropical mountain forests due to climatic and soil fertility constraints (25, 5 and 33 MgC ha−1 for AGC, RC and SOC respectively).
Forest distribution in Africa based on GLOBCOVER

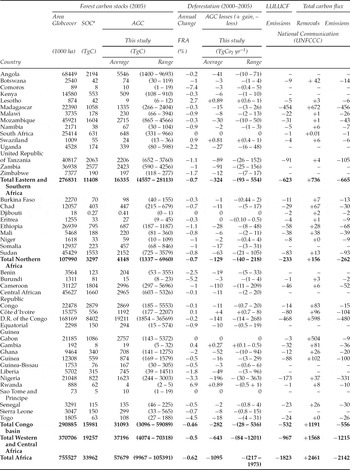
In an attempt to improve the aboveground C stock estimates for SSA we used the Globcover map (Defourny et al., Reference Defourny, Vancutsem, Bicheron, Brockmann, Nino and Schouten2006) and the average C density data used by the Intergovernmental Panel on Climate Change (IPCC, 2003) and the Carbon Dioxide Information Analysis Center (Gibbs, Reference Gibbs2006) (see figure A1 in online appendix available at http://journals.cambridge.org/EDE). Previous carbon stock assessment in SSA used coarser spatial resolution or did not consider the whole continent (Gibbs et al., Reference Gibbs, Brown, Niles and Foley2007; Baccini et al., Reference Baccini, Laporte, Goetz, Sun and Dong2008; Goetz et al., Reference Goetz, Baccini, Laporte, Johns, Walker, Kellndorfer, Houghton and Sun2009). The assessment of forest area was made based on the Globcover map and using a definition of forest with a tree cover above 15 per cent. The average C density data were assigned to their respective land cover descriptors using ArcGis 3.2 (ESRI, 2008). We estimated that aboveground forest C stocks for SSA were 57,679 TgC (ranging from 9,967 to 105,391 TgC) (table 1) which is lower than the 59,514 TgC estimated by FAO (2007). In addition, the FAO data did not consider 12 SSA countries and each country reported the data using different methodologies, thereby limiting data comparability. The important variations of AGC are related to the variation of forest cover within each class of land cover and the variability for the associated AGC amount for each of the land cover classes. For example, the AGC in tropical rainforest ranges from 65 to 255 MgC, forest cover in forest land cover ranges from 40 to 100 per cent and AGC in forest land cover class ranges from 42 to 255 MgC ha−1.
The impact of deforestation on forest carbon stocks in SSA

Notes: Estimation of the C emissions from LULUCF, total emissions, removals and the net emissions is based on the UNFCCC national communication to the UNFCCC. The data for Sao Tome and Principe, Uganda, Sierra Leone, Guinea-Bissau and Comoros were not taken into account because the data were considered not reliable. In total, nine countries submitted a forest definition to the UNFCCC, except for Gambia 1993, Sierra Leone 1990, Togo 1995 and Burundi 1998. The minimum and maximum AGC were calculated using the minimum and maximum forest cover and carbon stocks in each of the land cover classes. The average was calculated assuming a normal distribution of AGC.
aFrom Henry et al. (Reference Henry, Valentini and Bernoux2009).
Using the Harmonized World Soil Database (FAO/IIASA/ISRIC/ISSCAS/JRC, 2008), the ISRIC soil properties database, the Globcover map and the methodology described in Henry et al. (Reference Henry, Valentini and Bernoux2009), it was possible to estimate the SOC in the 0–30 cm soil layer in forest ecosystems. We found that the soil compartment of the forests contains 33,962 TgC (table 1). Unfortunately, it was not possible to estimate the variability of the soil C content as only one value of C content per soil type was reported in the original database. Furthermore, 63 per cent of the C stock in forest ecosystems is contained in the aboveground component, while the rest is contained as SOC in the 0–30 cm soil layer. It is important to note that this estimate does not consider the litter, the root and the soil below 30 cm depth. However, carbon in aboveground biomass and in topsoils (0–30 cm) are the most affected by deforestation and forest degradation (Bombelli et al., Reference Bombelli, Henry, Castaldi, Adu-Bredu, Arneth, de Grandcourt, Grieco, Kutsch, Lehsten, Rasile, Reichstein, Tansey, Weber and Valentini2009, Henry et al., Reference Henry, Valentini and Bernoux2009).
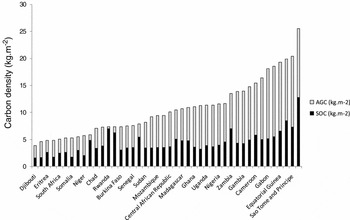
Unsurprisingly, C density in forests varies considerably between countries (table 1; figure 3), and also within countries. We find that the Democratic Republic of Congo (DRC) has the highest C density both in AGC and SOC (128 and 128 MgC ha−1 respectively). However, estimates found in the literature for a given country can vary significantly, pointing to the importance of uncertainties. The uncertainty is close to 100 per cent for the case of DRC: our AGC estimate is 19,211 TgC AGC, while FAO (2006b) reported 18,688 TgC, Baccini et al. (Reference Baccini, Laporte, Goetz, Sun and Dong2008) 17,350 TgC, Gibbs et al. (Reference Gibbs, Brown, Niles and Foley2007) 20,400–36,672 TgC, Nasi et al. (Reference Nasi, Mayaux, Devers, Bayol, Eba'a Atyi, Mugnier, Cassagne, Billand, Sonwa, de Wasseige, Devers, de Marcken, Eba'a Atyi, Nasi and Mayaux2009) 27,258 TgC and Gaston et al. (Reference Gaston, Brown, Massimiliano and Singh1998) 16,316 TgC. Existing uncertainties in present land carbon stocks estimates will have to be taken into account in the challenge of quantification under REDD+, and highlight the need for a harmonized set of assessment and measurement techniques (see section 4).
Average densities for AGC and SOC in SSA countries. AGC was obtained using the IPCC and CDIAC carbon stock data and the GLOBCOVER land cover product. SOC was based on the data reported by Henry et al. (Reference Henry, Valentini and Bernoux2009)

3.2 Deforestation
The impact of deforestation on C stocks can be broadly calculated based on the C stock change and the forest land area converted to other land uses. When considering the C stock change, the conversion of forests to other land-use types involves significant changes in C stocks, in AGC, RC and SOC. Regarding SOC, for example, the conversion of forest or woodlands to farmland in the tropics reduces the SOC content by about 20–50 per cent of the original C in the topsoil at equilibrium (Henry et al., Reference Henry, Valentini and Bernoux2009). According to Bombelli et al. (Reference Bombelli, Henry, Castaldi, Adu-Bredu, Arneth, de Grandcourt, Grieco, Kutsch, Lehsten, Rasile, Reichstein, Tansey, Weber and Valentini2009), in the humid tropical ecosystems of Cameroon, the lowest SOC was observed in cropland (44 MgC ha−1), while primary forests SOC density is as high as 50 MgC ha−1 (for open forests) to 100 MgC ha−1 (for undisturbed forests).
When using the forest definition provided by Globcover, the C stock calculation presented above (see figure A1), and national rate of deforestation from the 2005 Forest Resource Assessment of the FAO (2006b), it appeared that 1,095 (227–2,028) TgCO2 year−1 were lost from deforestation (table 1). Moreover, 59 per cent of the CO2 losses from deforestation were found in western and central Africa, with the Congo Basin representing 279 (216–1,973) TgCO2 and 26 per cent of the CO2 losses from deforestation in SSA. These estimates were lower than those reported by Houghton and Hackler (Reference Houghton and Hackler2006), of 946 TgCO2 yr−1, which were based on the total forest area in SSA in 2000. If we extrapolate for the total forest area of SSA (756 Mha), our estimate is 1,104 TgCO2 yr−1, which is 158 TgCO2 yr−1 higher than Houghton and Hackler's estimate. The discrepancies mainly arise from different C density data rather than estimates of deforestation since the rate is supposed to decrease between the periods 1990–2000 and 2000–2005. However, since the FAO estimate is based on the national communications, discrepancies can also be observed on the rate of deforestation. The use of remote sensing presents the advantages of providing consistent data over time and being a more appropriate tool for forest monitoring (DeFries et al., Reference DeFries, Asner, Achard, Justice, Laporte, Price, Small, Townshend, Moutinho and Schartzman2005; Achard et al., Reference Achard, DeFries, Eva, Hansen, Mayaux and Stibig2007).
3.3 Selective logging and forest degradation
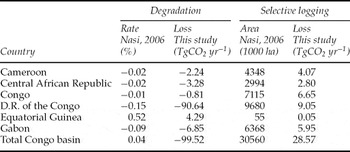
So far, few studies have attempted to estimate the impact of forest degradation in SSA both in terms of degraded forest land area and degraded C stock losses. Here we differentiate selective logging and forest degradation resulting from fuelwood, grazing, mining, etc. Examining the impact of logging activities on C stocks in tropical forests, Brown et al. (Reference Brown, Pearson, Moore, Parveen, Ambagis and Shoch2005) and Gineste et al. (Reference Gineste, Martel, Henry, Adu-Bredu and Saint-André2008) reported CO2 losses of approximately 37 and 44 MgCO2 ha−1 in Congo and Ghana respectively. By assuming that the forest area under selective logging follows a rotation period of 40 years, and that 37 MgCO2 ha−1 is directly lost when logging, we calculated an annual emission rate of 29 TgCO2 yr−1 for the Congo Basin, which represents 2.7 per cent of deforestation emissions (tables 1 and 2). Scaling-up selective logging rates of the Congo Basin to SSA results in emission equal to 103 TgCO2 yr−1. This result is close to the 110 TgCO2 yr−1 calculated by Houghton and Hackler (Reference Houghton and Hackler2006). Our calculation is, however, limited by the fact that the CO2 uptakes from forest regeneration and the emission from the wood products were not considered.
CO2 emissions from selective logging and forest degradation in SSA

When considering the impact of forest degradation, estimates of the impact of forest degradation on C stocks were obtained from Bombelli et al. (Reference Bombelli, Henry, Castaldi, Adu-Bredu, Arneth, de Grandcourt, Grieco, Kutsch, Lehsten, Rasile, Reichstein, Tansey, Weber and Valentini2009) and the degraded area in the Congo Basin was obtained from Nasi et al. (Reference Nasi, Cassagne and Billand2006). From the difference between C stock of a natural forest and a degraded one, and the degraded forest area, we estimated that the conversion from forest to degraded forest has led to CO2 losses of about 9,360 Mg ha−1 and about 99 TgCO2 yr−1 in the Congo Basin. Moreover, this implies that the C losses from forest degradation were about four times more important than selective logging in the Congo Basin. Unfortunately, we were not able to estimate the impact of degradation for the other countries and the different types of forest degradation other than selective logging, as no data on the extent of forest degradation is currently available.
3.4 Carbon balance
Due to low fossil fuel emissions, the general SSA carbon balance is dominated by two large fluxes: net emissions from land-use change and net uptake (sinks) by land-use change-unaffected ecosystems. According to the National Communication to the UNFCCC Secretariat, Land Use, Land Use Change and Forestry (LULUCF), related emissions amount to 1,823 TgCO2 yr−1 and LULUCF removals amount to 2,461 TgCO2 yr−1 (table 1). Combining fossil fuel emissions and land-based emissions and removals, SSA is currently a net sink of 319 TgCO2 yr−1. It appears that AGC loss from deforestation represents 60 and 51 per cent of the LULUCF and total emissions in SSA respectively. In some countries such as Madagascar and the DRC the AGC contribution is much lower. This is mainly explained by the fact that the contribution to the LULUCF emissions from the soil compartment is about 70 and 50 per cent respectively for the two countries. Additional contributions come from the conversion of grassland and biomass burning. The DRC represents 31 per cent of the LULUCF emissions of SSA, Madagascar the highest removal with 27 per cent of SSA, and Gabon the highest net emissions with 495 TgCO2 yr−1. It should be noted that the data for 14 countriesFootnote 1 (representing 27 per cent of the area, 18 per cent of the population, 25 per cent of the total C stocks and 27 per cent of CO2 emissions from deforestation (table 1)) were not included in this calculation as the data were not communicated to the UNFCCC or were not considered reliable.
3.5 Uncertainties of C balance assessment
The uncertainties associated with the current knowledge of the SSA ecosystems carbon balance are rather high, as shown by the different estimates (section 3.1). Our understanding and knowledge of the C cycle in SSA and its global scale is limited by the integration of spatio-temporal data. Important variability of AGC (10–105 PgC) and AGC losses from deforestation (0.2–2 PgCO2 yr−1) results from the combination of several factors. Most important are the variation of C in one vegetation form, forest cover in one land cover class, and deforestation rate estimates. The current land cover descriptors are different from those used during field measurements. Developing a common classification system such as the SOTER soil classification (FAO, 1995) would make a meaningful contribution to improving the classification of vegetation forms. Presently, the ecological classification used in this study may not represent the AGC variability found in the different vegetation forms. This induces an important variability within each of the ecological zones. While developing ecological zones that are more representative to the AGC will decrease the AGC variability, applying complex and numerous vegetation classes is limited by the number of available ground C data.
Additionally, several methodological choices such as the diameter threshold, the allometric model, the carbon pool, the stratification, the plot size and the sampling strategy influence the consistency and comparability of the results. The uncertainties associated with the current knowledge of the SSA ecosystems carbon balance are rather high as shown by the different estimates (section 3.1). Ciais et al. (Reference Ciais, Bombelli, Williams, Piao, Chave, Ryan, Henry, Brender and Valentini2011) showed that the uncertainties are particularly high for ecosystems such as savannas and tropical African forests; and vegetation dynamics such as deforestation, forest degradation and the impact of fires.
The implementation of actions to reduce GHG emissions from deforestation and forest degradation in the framework of the REDD+ mechanism requires the quantification of emission reductions and removals. This in turn raises the crucial issue of available methods to estimate C stocks and stock changes, and their adaptation to the SSA context. The development of national forest monitoring systems will facilitate the development of methods to measure C and improve the quality of the data. The next section will discuss the different technical and methodological issues related to the quantification of emission reductions under REDD+ in SSA.
4. Quantification of emission reduction and removals through the REDD+ mechanism in SSA
Several issues have to be successively solved when implementing an MRV system, such as: (1) the definition of forest and degraded forest; (2) the monitoring of forest activities; (3) the estimation of forest area and area changes (activity data (AD)); (4) the estimation of C stocks and their changes (emission factors (EF)); and (5) the estimation of the net balance from emissions and/or removals by sinks on the forest land (through a GHG inventory). Each of these points will be briefly discussed.
4.1 REDD+ and the IPCC guidance and guidelines
The IPCC provides guidelines and guidance that form the basis for how countries can estimate and monitor emissions and removals from REDD+ activities (IPCC, 2003, 2006). Based on the principles of consistency, transparency, comparability, completeness and accuracy, the guidelines allow the countries to establish national systems for GHG reporting under the UNFCCC that are comparable between Parties. For REDD+, the use of the IPCC guidance and guidelines by developing countries is requested in Decision 4/CP.15.
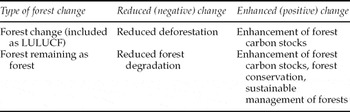
The result of human-induced activities on land-use change can fall into three categories in the IPCC good practices guidance for LULUCF: (i) forest land converted to other land, (ii) forest land remaining forest land, and (iii) other land converted to forest land (table 3).
Mitigation activities potentially included under REDD

4.2 Defining forest and degraded forest
Forest types differ widely, determined by factors including latitude, temperature, rainfall patterns, soil composition and human activity. A study of the various definitions of forests (FAO, 2006a) found that more than 800 different definitions for forests were in use in the world. Different definitions are required for different purposes and at different scales. In the context of REDD+, the responsibility of defining forest and degraded forest will be held by the countries and the definitions will be submitted to the UNFCCC Secretariat. It is probable that the REDD+ activities will have to be defined, too. However, there is no clear frontier to categorize forest degradation and deforestation. It is important to note that, for the moment, only nine countries in SSAFootnote 2 have communicated a definition for ‘forest’ under the UNFCCC. Another issue for SSA is that forest ‘degradation’ is a more widespread and important phenomenon than ‘deforestation’ and that there is currently no agreed definition for it under the UNFCCC.
4.3 Measuring activity data
Assessing AD consists of providing spatially explicit forest changes towards other land uses and management types of forest area and vice versa. In order to obtain such data, the use of remote sensing was identified as the most reliable way to produce data to allow reporting based on the IPCC requirements. Several methods and technologies can be used to identify forest changes. Different types of sensors can be used, such as optical, radar and laser/Lidar (see table A1 in online appendix). According to GOFC-GOLD (2009) and Achard et al. (Reference Achard, DeFries, Eva, Hansen, Mayaux and Stibig2007), it is possible to detect deforestation with confidence from the 1990s using medium-resolution optical images such as Landsat. However, the use of Landsat imageries is currently limited because of the low time frequency and the difficulty of obtaining cloud-free images. If cloud cover is a limiting factor, cloud-free satellite images with higher time frequency such as AVHRR, MODIS and SPOT-VGT, and radar sensors such as ALOS-PALSAR can be used. While the two options are cost effective, it appears that coarse images may not be adapted for direct estimation at a national level and the use of radar sensors for this purpose is still in its infancy in tropical forests.
When identifying the various forms of forest degradation in SSA, most of the current attempts to monitor forest cover change with remote sensing focused on selective logging (Laporte et al., Reference Laporte, Merry, Baccini, Goetz, Stabach and Bowman2007) and forest fires (Roy and Boschetti, Reference Roy and Boschetti2009), and other forms of forest degradation have been considered as almost undetectable (Peres et al., Reference Peres, Barlow and Laurance2006). It appears that it is challenging to identify forest degradation with mid- and coarse-resolution imagery (Imbernon, Reference Imbernon and Babin2004; Souza et al., Reference Souza, Roberts and Cochrane2005). The use of fine-resolution images such as IKONOS and Quickbird could be an alternative, but may not satisfy operational national forest monitoring systems for REDD+ due to their low temporal resolution, their relatively small-area coverage and their cost (see table A1). However, they can still be used for the verification of forest maps from coarse- to mid-resolution imagery (Fuller, Reference Fuller2006). Lidar technology is a promising method because it provides information on the forest structure in three dimensions. However, it has to be used with high spatial resolution imagery (Hilker et al., Reference Hilker, Wulder and Coops2008), is particularly expensive, and provides only one estimate in time. Nonetheless, the need for a synergetic and complementary use of approaches is necessary to monitor the dynamics of forests in SSA.
4.4 Measuring emission factors
The emission factors are derived from assessments of the changes in C stocks in the various C pools of a forest. The IPCC recognizes five forest pools where C is stored: aboveground biomass, belowground biomass, litter, dead wood and SOC. The estimation of tree biomass is mostly based on the use of allometric equations, which adds complexity to the relation between dendrometric parameters that are directly measurable during the field inventories and the biomass that is not directly measureable. While several biomass allometric equation databases were developed for Europe (Zianis et al., Reference Zianis, Muukkonen, Mäkipää and Mencuccini2005) and for South America (Návar, Reference Návar2009), no inventory data exists for SSA.
Most of the available and accessible data for SSA are volume estimates from national forest inventories. However, conversion of volume to biomass is limited by the availability of conversion factors and wood density data (Henry et al., Reference Henry, Besnard, Asante, Eshun, Adu-Bredu, Valentini, Bernoux and Saint-André2010). Assessing C in the other C pools (dead biomass, belowground biomass, litter and SOC) is even more difficult. For example, the impact of the conversion of forest to other land use on the SOC is little known. While conversion of forests to pasture or selectively logged forest is not believed to significantly change SOC (Guo and Gifford, Reference Guo and Gifford2002) and may actually increase the soil organic matter content (Sombroek et al., Reference Sombroek, Nachtergaele and Hebel1993), shifting cultivation results in a reduction of soil C by half (Detwiler, Reference Detwiler1986). To our knowledge, no study reported estimates of the impact of forest degradation on SOC.
When analysing the national communication for the Forest Resource Assessment of the FAO, it appeared that only seven SSA countries use specific national data. Even the default values proposed by the IPCC do not cover all the ecological zones (e.g. subtropical humid forests). Moreover, there is an important need to support scientific research to improve the methods and the coefficients used to estimate C stocks.
5. Conclusion
Deforestation and forest degradation already represent an important part of worldwide CO2 emissions (20 per cent, of which 25–35 per cent are in SSA), and therefore reducing the loss of forest C stocks is likely to represent an essential part of any worldwide atmospheric CO2 stabilization policy. Within the international negotiations on climate change, growing consideration has been given to issues of land-use change and incentives to reduce deforestation, forest degradation, and the conservation of existing forests, especially in developing countries. The adoption of REDD+ as a mitigation action under the UNFCCC is a promising step towards these goals. To be appropriately designed, implemented and effective, it will, however, require: (1) a close understanding of the underlying drivers of land-use change; (2) an accurate knowledge of past and present forest state, related C stocks and their changes; and (3) the existence of robust, accurate, locally adapted national systems to allow for suitable monitoring. It will also need solid institutional, legal and control frameworks at national and local levels. Since REDD+ is a results-based incentive scheme, it cannot exist without measured, reported and verified emission reductions (Cancun agreements, article 73). This highlights the paramount need for national forest and forest carbon monitoring systems, with important technical, institutional and financial difficulties to be solved regarding the production, availability, accuracy, comparability, consistency and transparency of forest C data, EF and AD.
The effectiveness of REDD+ will also require creating incentives outside the forest frontier. To feed the world population, any attempt to limit forest loss is likely to be successful only if accompanied by policies aiming at the intensification of agricultural production. Agricultural intensification at the global scale had an important mitigation effect in the past, by providing greater yields per ha and avoiding substantial land-use changes that would have occurred without the increases in yields obtained since 1960 (Burney et al., Reference Burney, Davis and Lobell2010). Reducing emission from deforestation needs to happen simultaneously with efforts to increase yields in non-forested lands to satisfy demands for agricultural products (DeFries et al., Reference DeFries, Rudel, Uriarte and Hansen2010). To date, considerations relating to agricultural policies remain marginal to ongoing REDD+ discussions. However, domestic agricultural intensification has a potentially central role in a domestic REDD+ policy because it allows for decreasing the pressure on national forest resources. It will also have an impact in terms of reduced forest loss elsewhere, through a reduction of the need to import agricultural products.