

1. Introduction
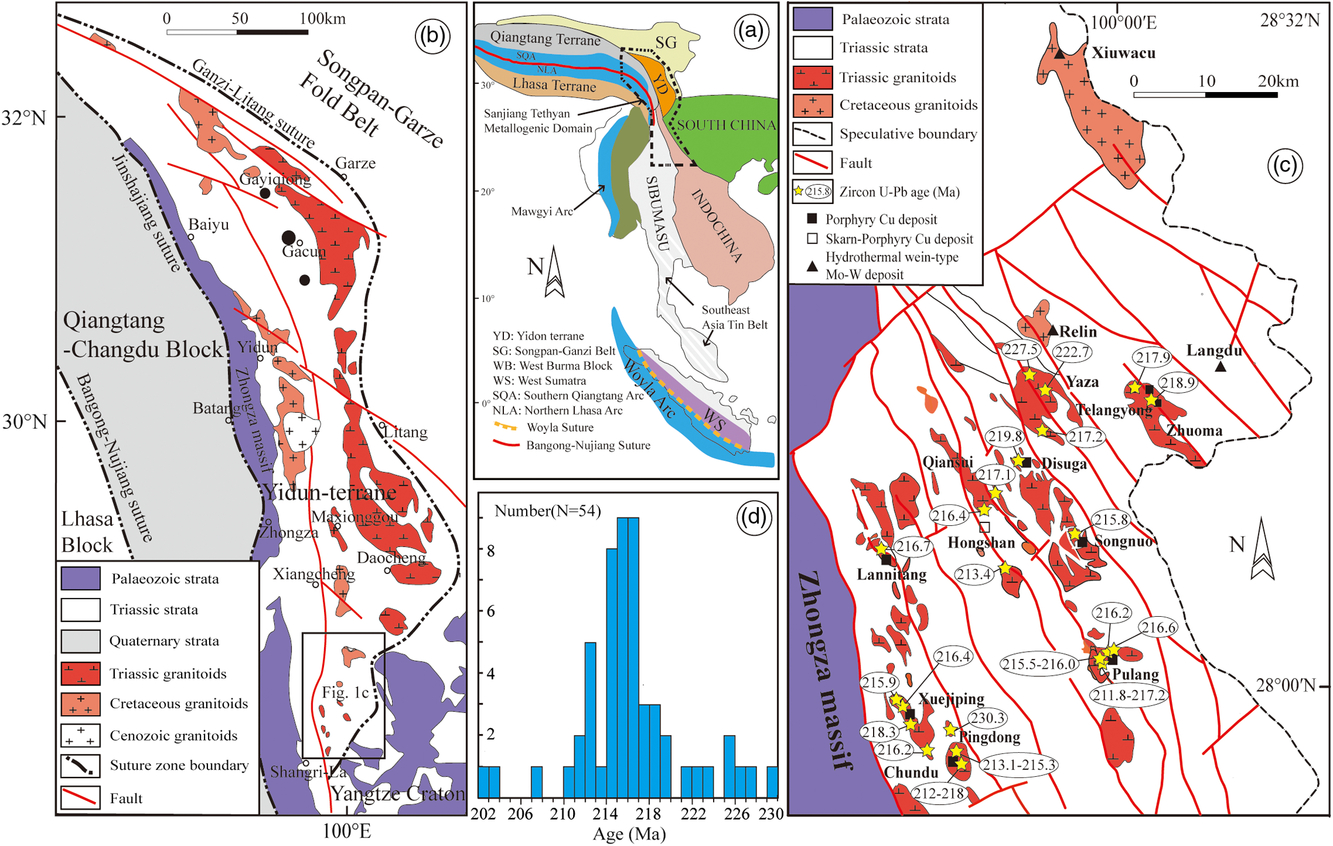
The Yidun Terrane is a part of the Sanjiang Tethyan Metallogenic Domain, which includes various igneous rocks and several types of Cu–Mo polymetallic deposits (Hou et al. Reference Hou, Zaw, Pan, Mo, Xu, Hu and Li2007; Fig. 1a). The Zhongdian arc (ZA) is located in the southern part of the Yidun Terrane, where Late Triassic magmatism has produced NW–SE-trending porphyries and related porphyry-type Cu-polymetallic deposits (Fig. 1c).
(a) Regional terranes accreted during Late Palaeozoic time in southeast Asia (modified after Wang et al. Reference Wang, Bi, Leng, Zhong, Tang, Chen, Yin, Huang and Zhou2014). (b) Simplified geological map of the Yidun Terrane (modified after Cao et al. Reference Cao, Xu, Chen, Huang, Ren, Zhao and Liu2016). (c) Simplified geological map and the distribution of zircon U–Pb ages of the Zhongdian arc (modified after Cao et al. Reference Cao, Xu, Chen, Huang, Ren, Zhao and Liu2016). (d) Age frequency of Triassic porphyries in the Zhongdian arc; data sources are provided in online Supplementary Material Table S3.
The Late Triassic porphyries are characterized by high Sr/Y, which is considered to be closely related to the porphyry deposits (Wang et al. Reference Wang, Zhou, Li and Yan2011, Reference Wang, Dong, Santosh, Li and Dong2017; Cao et al. Reference Cao, Xu, Chen, Huang, Ren, Zhao and Liu2016). Although high Sr/Y magma can be generated through the melting of oceanic crust (Defant & Drummond, Reference Defant and Drummond1990), partial melting of lower crust (Ma et al. Reference Ma, Zheng, Xu, Griffin and Zhang2015) or partial melting of a peridotitic mantle that has been modified by slab melts (Martin et al. Reference Martin, Smithies, Rapp, Moyen and Champion2005), the trace-element contents of magma can be easily changed by crustal contamination or magmatic processes (Richards, Reference Richards2011), and thus cannot be used as an indicator of specific petrogenesis. Previous studies have focused on utilizing the properties of high Sr/Y and La/Yb to constrain the petrogenesis and related mineralization of the porphyries in the ZA (Wang et al. Reference Wang, Zhou, Li and Yan2011, Reference Wang, Dong, Santosh, Li and Dong2017; Cao et al. Reference Cao, Xu, Chen, Huang, Ren, Zhao and Liu2016) but have neglected the origin of the high Sr/Y and La/Yb.
In this study, we use new whole-rock major- and trace-element compositions, U–Pb ages and Hf isotopic compositions of zircons, and whole-rock Sr–Nd–Pb isotopic composition data together with data from the literature to constrain the magmatic conditions, the origin of the high Sr/Y, the source and petrogenesis, and the implications for mineralization of the Late Triassic porphyries in the ZA.
2. Geological setting
The Yidun Terrane, the Qiangtang block to the west and the Songpan–Garzê Terrane to the northeast are three microcontinents in the eastern Tibetan Plateau (Fig. 1a; Roger et al. Reference Roger, Jolivet and Malavieille2010; Yang et al. Reference Yang, Hou, Wang, Zhang and Wang2012). The Yidun Terrane is linked with the Qiangtang block by the Jinshajiang suture and the Songpan–Garzê Terrane by the Garzê–Litang suture. Although the Garzê–Litang suture combines with the Jinshajiang suture at the north end of the Yidun Terrane, the southern segment of the Garzê–Litang suture is poorly preserved (Li et al. Reference Li, Zeng, Hou and White2011; Yin & Harrison, Reference Yin and Harrison2000; Wang et al. Reference Wang, Zhou, Chen, Gao and Yan2013). The two sutures are related to the closure of two different Palaeo-Tethys oceans at different times (Wang et al. Reference Wang, Metcalfe, Jian, He and Wang2000; Reid et al. Reference Reid, Wilson and Liu2005; Pullen et al. Reference Pullen, Kapp, Gehrels, Vervoort and Ding2008).
The Yidun Terrane has been divided into two parts by the N–S-trending Xiangcheng–Geza Fault (Fig. 1b; Wang et al. Reference Wang, Zhou, Chen, Gao and Yan2013). The western part is the Zhongza massif, which is considered to be a micro-continent rifted from the western Yangtze Block in Late Permian time during the opening of the Garzê–Litang Ocean (Chang, Reference Chang1997; Chen et al. Reference Chen, Wang, Liu, Cai, Zhang, Peng, Qiu and Zheng1987; Hou, Reference Hou1993; Xiao et al. 2008). The eastern part is the Triassic Yidun Terrane, which is generally accepted to be related to the westward subduction of the Garzê–Litang oceanic crust (Hou, Reference Hou1993; Hou et al. Reference Hou, Wang, Zaw, Mo, Wang, Li and Pan2003, Reference Hou, Zaw, Pan, Mo, Xu, Hu and Li2007; Wang et al. Reference Wang, Zhou, Chen, Gao and Yan2013).
The Yidun Terrane is dominated by Triassic volcano-sedimentary successions and has been divided into northern and southern parts according to differences in rocks and mineralization characteristics (Hou et al. Reference Hou, Zaw, Pan, Mo, Xu, Hu and Li2007). The northern part of the Yidun Terrane (NYD) includes widespread Late Triassic bimodal volcanic suites and large granitic plutons. Several volcanic-hosted massive sulfide deposits have developed in the volcanic sequences, such as the Gacun polymetallic deposit (Hou, Reference Hou1993; Hou et al. Reference Hou, Wang, Zaw, Mo, Wang, Li and Pan2003), although no mineralization was found related to the granitic plutons in the NYD (Fig. 1b). The southern part of the Yidun Terrane, also referred to as the ZA, is characterized by intermediate to felsic volcanic sequences and relatively small porphyritic and granitic plutons formed at different times. Several porphyry- and skarn-type Cu polymetallic deposits have been detected in relation to the porphyritic and granitic plutons (Fig. 1c). These include the Late Triassic porphyry-type Cu polymetallic deposits related to the porphyritic plutons at Pulang, Xuejiping and Chundu, and the Late Cretaceous skarn-type Mo–Cu polymetallic deposits related to the granitic plutons at Hongshan–Hongniu, Xiuwacu, Relin and Tongchanggou (Leng et al. Reference Leng, Zhang, Hu, Wang, Zhong, Wang and Bi2012; Chen et al. Reference Chen, Xu, Ren, Huang and Wang2014).
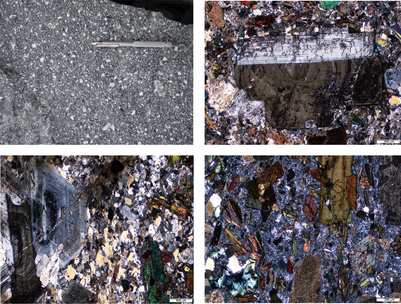
The NW–SE-trending Triassic porphyritic intrusions in the ZA crop out in a relatively small area compared with the granitic intrusions in the NYD (Fig. 1c). The porphyries have been divided into east and west porphyry belts emplaced at 218–203 Ma and 242.9–237.5 Ma, respectively, based on the ages determined by K–Ar and Rb–Sr dating (Zeng et al. Reference Zeng, Li, Wang and Li2006; Li et al. Reference Li, Zeng, Hou and White2011). However, more reliable zircon U–Pb ages suggest that all Triassic porphyries in the ZA were emplaced at the same time, at 221–211 Ma (Chen et al. Reference Chen, Xu, Ren, Huang and Wang2014). The samples analysed in this study, collected from Pulang, Songnuo, Disuga, Langdu, Yaza, Telangyong and Xuejiping, are characterized by their porphyritic textures. The phenocrysts consist of 15–25 vol. % plagioclase, 5–15 vol. % amphibole, 3–5 vol. % biotite and lesser amounts of quartz (Fig. 2). The matrix is composed of plagioclase, K-feldspar, biotite, quartz and accessory minerals including zircon, apatite, magnetite and titanite.
(a) Hand sample of the porphyry at Pulang. Pen for scale is 13.5 cm long. (b–d) Photomicrographs of the Chundu, Pulang and Xuejiping samples. Amp – amphibole; Bi – biotite; Pl – plagioclase; Kf – K-feldspar; Q – quartz.

3. Analytical methods
Seventeen samples were collected for major- and trace-element composition analysis at Wuhan SampleSolution Analytical Technology Co., Ltd. The whole-rock major-element compositions were measured by an X-ray fluorescence spectrometer (XRF) on glass discs, with precision and accuracy better than 5 %. The trace-element compositions were determined using an Agilent 7500a inductively coupled plasma mass spectrometer (ICP-MS), with precision and accuracy better than 5 %.
The zircons were separated using heavy-liquid and magnetic separation techniques and were then handpicked under a binocular microscope. They were mounted in epoxy, polished and coated with carbon, and cathodoluminescence (CL) images were then taken to select appropriate locations for U–Pb and Hf isotopic analysis. U–Pb dating was performed using a laser ablation (LA)-ICP-MS at the Key Laboratory of Isotope Geochronology and Geochemistry, Tianjin Institute of Geology and Mineral Resources. The LA was completed at an energy density of 13–14 J/cm2 and an 8–10 Hz repetition rate with a spot size of 35 μm. The laser denudation material was carried into the ICP-MS by highly pure He. Standard zircon GJ-1 was used as an external standard for elemental fractionation correction and analysed every eight samples. The NIST SRM 610 silicate glass was used for the instrument optimization. Off-line correction and selection were performed using CPMSDataCal (Liu et al. Reference Liu, Hu, Gao, Gunther, Xu, Gao and Chen2008).
In situ zircon Hf isotopic analysis was conducted on a Neptune multi-collector (MC)-ICP-MS with a New Wave 193 nm laser, also at the Key Laboratory of Isotope Geochronology and Geochemistry, Tianjin Institute of Geology and Mineral Resources. The LA was completed at an energy density of 10 J/cm2 and a 10 Hz repetition rate with a spot size of 50 μm. The Hf isotopic analysis was conducted on the U–Pb dating analysis position. The detailed operating conditions for the LA system and analytical methods have been described by Geng et al. (Reference Geng, Li, Zhang, Zhou and Li2011).
The whole-rock Sr–Nd–Pb isotopic compositions were measured at Wuhan SampleSolution Analytical Technology Co., Ltd. Whole-rock Sr–Nd isotope data were measured using a Micromass Isoprobe MC-ICP-MS. The details of the analytical techniques and analytical precision are similar to those of Ling et al. (Reference Ling, Duan, Xie, Zhang, Zhang, Cheng, Liu and Yang2009). For Pb isotope analysis, the weighed samples were dissolved with purified HF in Teflon capsules at 190 °C for more than 24 hours. HNO3 was added to the capsules, and the solution was desiccated. The isotopic analysis was performed using a Micromass Isoprobe MC-ICP-MS.
4. Analytical data
4.a. Zircon U–Pb ages and Hf isotopic compositions
The analytical data for the zircon U–Pb dating and Hf isotopic compositions are provided in online Supplementary Material Tables S1 and S2.
Three samples from the ZA were selected for LA-ICP-MS zircon U–Pb dating and in situ zircon Hf isotopic analysis. The zircons are colourless or pale yellow, transparent and euhedral to subhedral, with obvious oscillatory zoning in the CL images (Fig. 3) and high Th/U values of 0.45–0.91, which indicates a magmatic origin. The Hf isotopic analysis results revealed that all 176Lu/177Hf values are low, at <0.002, which indicates that little radioactive Hf was accumulated after the formation of the zircons. Therefore, the 176Lu/177Hf ratio reflects the Hf isotope composition in the formation process of the zircon (Kinny & Mass, Reference Kinny and Mass2003).
Zircon U–Pb concordia diagrams for the porphyries in the Zhongdian arc. Full circles show the locations of U–Pb dating, and dashed circles show the locations of Hf analyses. (a) 17PL42; (b) 17PL49; (c) 17RY35.

Samples 17PL42 and 17PL49 were collected from porphyries in the Pulang area at 28° 2′ 18″ N, 99° 59′ 23″ E and 28° 2′ 25″ N, 99° 59′ 28″ E, respectively. Thirty-six zircons from sample 17PL42 yielded 206Pb–238U ages of 210 ± 2 Ma to 224 ± 3 Ma with a weighted mean age of 217 ± 1 Ma and mean square weighted deviation (MSWD) of 1.9 (Fig. 3a); 24 zircons showed 176Hf/177Hf values of 0.282614–0.282745, εHf(t) values of −1.03 to 3.75, and two-stage Hf model ages (TDM2) of 1.31–1.02 Ga. Thirty-three zircons from sample 17PL49 yielded 206Pb–238U ages of 210 ± 2 Ma to 223 ± 3 Ma with a weighted mean age of 216 ± 1 Ma and MSWD of 1.0; (Fig. 3b) 25 zircons showed 176Hf/177Hf values of 0.282581–0.282674, εHf(t) values of −2.59 to 1.50, and TDM2 of 1.42–1.21 Ga.
Sample 17RY35 was collected from the quartz diorite intrusions in the Telangyong area at 28° 14′ 39″ N, 100° 0′ 52″ E. Thirty-one zircons from this sample yielded 206Pb–238U ages ranging from 214 ± 2 Ma to 225 ± 3 Ma with a weighted mean age of 218 ± 1 Ma and MSWD of 1.19 (Fig. 3c); 24 zircons have 176Hf/177Hf values of 0.282622–0.282771, εHf(t) values of −0.53 to 4.73, and TDM2 of 1.29–0.95 Ga.
On the basis of previous zircon U–Pb dating studies (Fig. 1c), the porphyries in the ZA were emplaced mainly at 230–203 Ma with a peak occurring at 218–215 Ma (Fig. 1d). The zircon U–Pb ages from this study, at 218–216 Ma, suggest that the porphyries in Pulang and Telangyong were formed during the peak time.
4.b. Major- and trace-element compositions
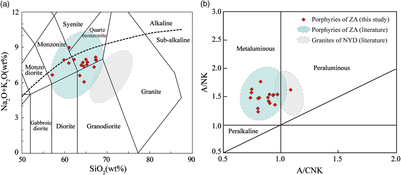
The major- and trace-element data are listed in Table 1. The loss on ignition (LOI) values range from 0.72 wt % to 5.44 wt %, reflecting various degrees of alteration. The oxides described below were recalculated to 100 % in a volatile-free environment. The porphyries have SiO2 contents of 56.46–66.45 wt %, belonging to intermediate rocks, and total alkali contents of 5.73–8.65 wt %. All of the samples fall in the diorite, monzonite and quartz monzonite fields on the total alkali–silica (TAS) diagram (Fig. 4a). The porphyries have A/CNK values of 0.74–1.08, and A/NK values of 1.23–1.77; most fall in the metaluminous field except for one sample falling in the peraluminous field (Fig. 4b). The porphyries also have high contents of Al2O3 and MgO, at 13.44–16.87 wt % and 1.50–4.00 wt %, respectively. In summary, the major-element compositions of the porphyries are consistent with previous data reported for the ZA and are different from the granites in the NYD (Fig. 4).
Major- (wt %) and trace-element (ppm) data for the porphyries in the Zhongdian arc

(a) Total alkali versus SiO2 (TAS) diagram based on Middlemost (Reference Middlemost1994). (b) A/NK versus A/CNK diagram based on Maniar & Piccoli (Reference Maniar and Piccoli1989). Data sources: Ren et al. (Reference Ren, Xu and Chen2011), Wang et al. (Reference Wang, Zhou, Li and Yan2011, Reference Wang, Zhou, Chen, Gao and Yan2013, Reference Wang, Dong, Santosh, Li and Dong2017), He et al. (Reference He, Zhu, Zhong, Ren, Bai and Fen2013), Jin et al. (Reference Jin, Fan, Zhang, Zhang, Shen and Gao2013), Chen et al. (Reference Chen, Xu, Ren, Huang and Wang2014), Cao et al. (Reference Cao, Xu, Chen, Huang, Ren, Zhao and Liu2016), Lai et al. (Reference Lai, Li, Liu, Yang and Li2016), Liu et al. (Reference Liu, Li and Zhang2016), Wu et al. (Reference Wu, Xiao, Wilde, Ma and Zhou2017).

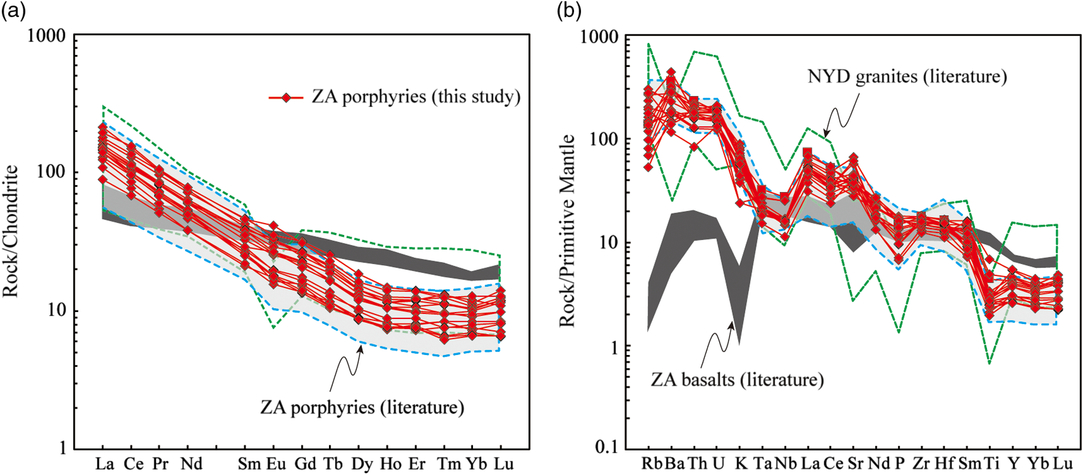
The rare earth element (REE) contents indicate that the porphyries in the ZA have ΣREE of 98.84–214.81 ppm, (La/Yb)N ratios of 11.83–20.98 and light RRE/heavy RRE (LREE/HREE) ratios of 9.82 and 14.73, respectively. As also reported in the published data, the porphyries in the ZA have a listric-shaped chondrite-normalized REE diagram (Fig. 5a), which indicates strong fractionation between LREEs and HREEs. In the primitive mantle-normalized trace elemental spider diagram (Fig. 5b), the porphyries in the ZA are enriched in large ion lithophile elements (LILEs) such as Rb, Ba, La, Sr and Hf and are depleted in high field strength elements (HFSEs). Compared with the granites in the NYD, which have stronger negative Eu anomalies and are more depleted in Ba, Sr, P and Ti, the porphyries in the ZA have weak negative Eu anomalies (Eu/Eu*) of 0.78–1.08; high Sr and Ba contents at 591–1391 ppm and 804–3048 ppm, respectively; and high Sr/Y ratios of 29.5–108.6.
(a) Chondrite-normalized rare earth element (REE) diagram. (b) Primitive mantle-normalized trace elemental spider diagram. The normalizing values are from Sun & McDonough (Reference Sun, McDonough, Saunders and Norry1989). The data sources are the same as those in Figure 4.
4.c. Sr–Nd–Pb isotopic compositions
The Sr–Nd–Pb isotope results of eight samples from the porphyries in the ZA are given in Table 2 and Table 3. The initial 87Sr/86Sr and εNd(t) values and initial Pb isotopic ratios are calculated at the age of 217 Ma (zircon U–Pb age). The initial 87Sr/86Sr values are 0.704770–0.706308, and the εNd(t) values are negative, ranging from −3.6 to −1.4, with Nd-isotope-depleted mantle model ages (TDM) between 1.3 Ga and 1.1 Ga. The radiogenic Pb isotopic compositions are high, with present-day whole-rock 206Pb/204Pb, 207Pb/204Pb and 208Pb/204Pb ratios of 18.050–18.530, 15.587–15.619 and 38.236–38.753, respectively. The calculated initial ratios of (206Pb/204Pb)t (207Pb/204Pb)t and (208Pb/204Pb)t are 17.788–18.007, 15.568–15.604 and 37.821–38.124, respectively.
Whole-rock Sr–Nd isotope data for the porphyries in the Zhongdian arc

Whole-rock Pb isotope data for the porphyries in the Zhongdian arc

5. Discussion
5.a. Magmatic conditions
Zircon-saturation thermometry is widely used in temperature calculations (Watson & Harrison, Reference Watson and Harrison1983). The porphyries in the ZA are zircon saturated, as confirmed by the abundant zircons in the samples used for U–Pb dating (>1000) and the results of extensive zircon dating studies conducted in the ZA (Wang et al. Reference Wang, Zhou, Li and Yan2011; Chen et al. Reference Chen, Xu, Ren, Huang and Wang2014; Cao et al. Reference Cao, Xu, Chen, Huang, Ren, Zhao and Liu2016). Various mineral geothermobarometers have been used on the porphyries in the ZA. The Ti-in-zircon geothermometer suggests temperatures of 640–683 °C, 648–744 °C and 644–716 °C for the zircons of Pulang, Lannitang and Disuga, respectively (Kong et al. Reference Kong, Xu and Chen2016). The Si-in-amphibole geothermometer of Ridolfi et al. (Reference Ridolfi, Renzulli and Puerini2010), T = −151.487Si* + 2041, suggests higher temperatures of 783–829 °C (Table 4). According to the zircon-saturation thermometry of Watson & Harrison (Reference Watson and Harrison1983), T = 12900/(2.95 + 0.85 × M + ln(496000/Zrmelt)) − 273.15, in which M is the cation ratio of (Na + K + 2Ca)/(Al × Si), and Zrmelt is the Zr content of the melt.
Magmatic conditions data (temperature, pressure, water content and oxygen fugacity) for amphiboles from the porphyries in the Zhongdian arc

* The temperatures (T) are calculated using the Si-in-amphibole geothermometer (T = −151.487Si* + 2041) from Ridolfi et al. (Reference Ridolfi, Renzulli and Puerini2010). The pressures (P) are calculated using the Al-in-amphibole geobarometer (P (kbar) = 0.5 + 0.331(8) × Altot + 0.995(4) × (Altot)2) suggested by Mutch et al. (Reference Mutch, Blundy, Tattitch, Cooper and Brooker2016). The water contents (H2Omelt) are calculated using the formula (H2Omelt = 5.215[6]Al* + 12.28) proposed by Ridolfi et al. (Reference Ridolfi, Renzulli and Puerini2010). We calculated the magmatic oxygen fugacity using the Mg-in-amphibole ΔNNO-equation (ΔNNO = 1.644Mg* − 4.01) suggested by Ridolfi et al. (Reference Ridolfi, Renzulli and Puerini2010).
The porphyries crystallized at calculated temperatures of 726–778 °C. The calculated temperatures show a large variation, which might be attributed to the crystallization of different minerals under different temperature conditions such that the amphiboles crystallized earlier than the zircons when the temperature of the magma was relatively high. In general, the mineral geothermobarometers indicate that the porphyries in the ZA crystallized at c. 640–829 °C.
We calculated the magmatic pressures using the Al-in-amphibole geobarometer (P (kbar) = 0.5 + 0.331(8) × Altot + 0.995(4) × (Altot)2) suggested by Mutch et al. (Reference Mutch, Blundy, Tattitch, Cooper and Brooker2016). The results indicate that the porphyries in the ZA crystallized at pressures of 2.1–2.8 kbar (Table 4), which is consistent with the crystallization pressures of 2.1–4.1 kbar estimated by Cao et al. (Reference Cao, Yang, Xu, Fu, Li and Sun2018) for the porphyries at Pulang and suggests crystallization depths shallower than 8 km.
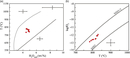
According to the relationship between the Al in the amphibole and the water content in the melt proposed by Ridolfi et al. (Reference Ridolfi, Renzulli and Puerini2010), H2Omelt = 5.215[6]Al* + 12.28, the calculated water content of the porphyries is 4.47–4.94 wt % (Table 4; Fig. 6a), indicating water-rich conditions. The wide development of amphibole and biotite phenocrysts suggests high magmatic water contents for the porphyries in the ZA (Richards, Reference Richards2011). Several porphyry-type Cu polymetallic deposits related to these porphyries, such as the Pulang giant porphyry-type Cu polymetallic deposit, and their high Sr/Y indicates that the porphyritic magmas in the ZA are water-rich (H2O > 4 wt %) and oxidized (Richards & Kerrich, Reference Richards and Kerrich2007; Richards, Reference Richards2011; Sun et al. Reference Sun, Huang, Li, Hua, Zhang, Sun, Zhang, Ding, Li, Zartmana and Ling2015).
Plots of (a) temperature (T) versus H2O and (b) oxygen fugacity (logfO2) versus T, modified after Ridolfi et al. (Reference Ridolfi, Renzulli and Puerini2010).
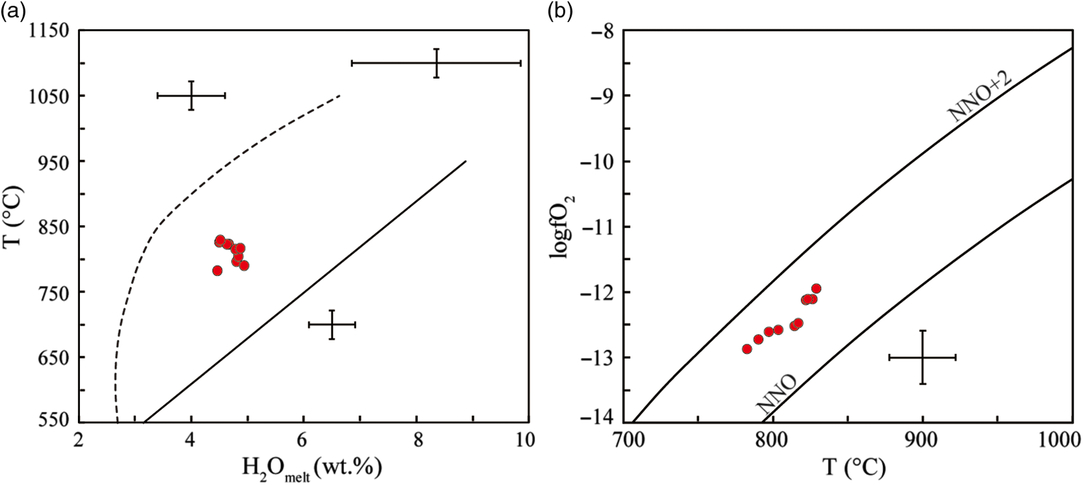
Titanite occurs as an accessory mineral in the porphyries, which reflects relatively high magmatic oxidation states (Foley & Wheller, Reference Foley and Wheller1990). We calculated the magmatic oxygen fugacity using the Mg-in-amphibole ΔNNO-equation (ΔNNO = 1.644Mg* − 4.01) proposed by Ridolfi et al. (Reference Ridolfi, Renzulli and Puerini2010) to obtain a relatively high magmatic oxygen fugacity (ΔNNO = 1.04–1.38; Fig. 6b).
5.b. Magma source
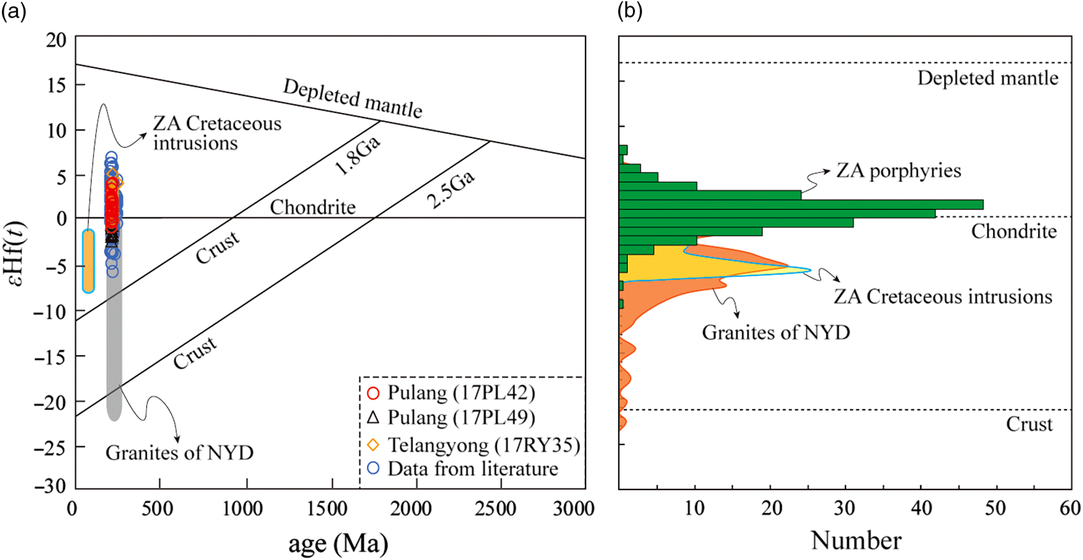
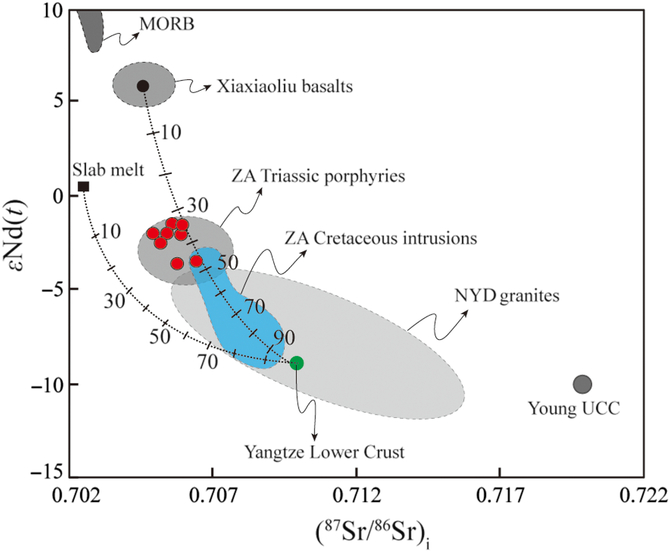
The porphyries in the ZA are enriched in LILEs and depleted in HFSEs and have high H2O contents; these geochemical features are generally related to subduction zone settings (Gill, Reference Gill1981). The high Mg no. values of 48–72 and the εHf(t) values of c. −5 to 7 are close to the chondrite line and are obviously different from the Late Cretaceous granites in the ZA and contemporaneous granites in the NYD that were derived from an old crustal source (Fig. 7; Reid et al. Reference Reid, Wilson, Shun, Pearson and Belousova2007; He et al. Reference He, Zhu, Zhong, Ren, Bai and Fen2013; Cao et al. Reference Cao, Xu, Chen, Huang, Ren, Zhao and Liu2016; Wang et al. Reference Wang, Dong, Santosh, He, Li and Dong2016; Wu et al. Reference Wu, Xiao, Wilde, Ma and Zhou2017). Therefore, the magma source must have significant contributions of mantle components. However, the εNd(t) values of the porphyries in the ZA are between the values of the Xiaxiaoliu basalts and the Yangtze lower crust (Fig. 8), indicating the addition of some crustal materials. Melting experiment results suggest that partial melting of hydrated peridotite is not a plausible explanation for any of the geochemical features associated with subduction zone magmas (LaTourrette et al. Reference LaTourrette, Hervig and Holloway1995). Moreover, the Mg no. values are significantly higher than those of the melts of mafic lower crust with H2O added, at <50 (Winther & Newton, Reference Winther and Newton1991; Rapp, Reference Rapp1995; Winther, Reference Winther1996). In addition, the high H2O content suggests that the porphyries in the ZA were not likely produced by dehydration melting of basaltic amphibolites (Sisson et al. Reference Sisson, Ratajeski, Hankins and Glazner2005; Lu et al. Reference Lu, Loucks, Fiorentini, Yang and Hou2015). Therefore, a mantle source with a certain contribution of crustal components appears to be plausible.
(a) Relationship between εHf(t) values and U–Pb ages, and (b) the frequency of εHf(t) values for zircons from the porphyries in the ZA. Data for the granites of the NYD are from He et al. (2013) and Wu et al. (Reference Wu, Xiao, Wilde, Ma and Zhou2017); those for the ZA Cretaceous intrusions are from Wang et al. (Reference Wang, Bi, Leng, Zhong, Tang, Chen, Yin, Huang and Zhou2014) and Cao et al. (Reference Cao, Xu, Chen, Huang, Ren, Zhao and Liu2016).
εNd(t) versus (87Sr/86Sr)i diagram. The data for the Xiaxiaoliu basalts are from Chen et al. (Reference Chen, Xu, Ren and Huang2017); those for the ZA porphyries are from Chen et al. (Reference Chen, Xu, Ren, Huang and Wang2014) and Wang et al. (Reference Wang, Zhou, Li and Yan2011); those for the NYD granites are from He et al. (2013), Wang et al. (Reference Wang, Zhou, Chen, Gao and Yan2013) and Wu et al. (Reference Wu, Xiao, Wilde, Ma and Zhou2017); and the Yangtze lower crust data were estimated by Chen et al. (Reference Chen, Luo and Liu2001), Xu et al. (Reference Xu, Yu, Wang, Lu and Fang2002) and Kong et al. (Reference Kong, Xi, Jin and Deng2003).
We inferred that most of the porphyries in the ZA were emplaced mainly during the peak time of 218–216 Ma, which is close to the time of the break-off of the Garzê–Litang oceanic slab at 218–215 Ma (Chen et al. Reference Chen, Xu, Ren, Huang and Wang2014). The mantle components of the porphyries were most likely derived from upwelling of the asthenospheric mantle beneath the ZA, which is similar to the enriched mid-ocean ridge basalt (E-MORB)-like Xiaxiaoliu basalts (Chen et al. Reference Chen, Xu, Ren and Huang2017). The continental crustal components were possibly derived from the basement of the Zhongza massif, which shares a similar basement with the western Yangtze Craton (Chang, Reference Chang1997; Chen et al. Reference Chen, Wang, Liu, Cai, Zhang, Peng, Qiu and Zheng1987; Hou, Reference Hou1993; Xiao et al. Reference Xiao, He, Pirajno, Ni, Du and Wei2008).
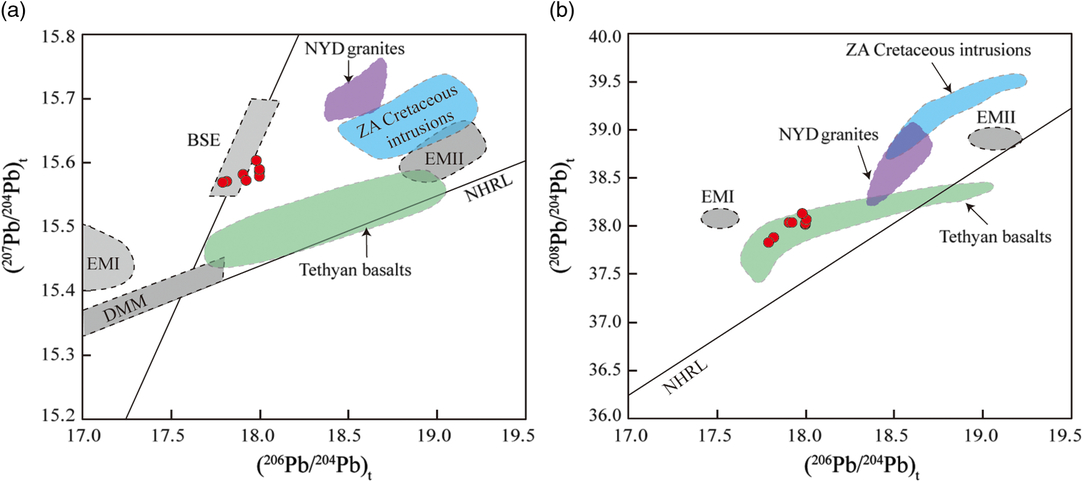
The εNd(t) values of the porphyries in the ZA are lower than those of the Xiaxiaoliu basalts and are significantly higher than those of the Yangtze lower crust (Chen et al. Reference Chen, Luo and Liu2001; Xu et al. Reference Xu, Yu, Wang, Lu and Fang2002; Kong et al. Reference Kong, Xi, Jin and Deng2003) and Cretaceous intrusions derived from partial melting of the ancient lower crust (Fig. 8; Gao et al. Reference Gao, Yang, Meng and Zhang2017; Wang et al. Reference Wang, Dong, Santosh, Li and Dong2017). The initial Pb isotopic ratios of the porphyries in the ZA are lower than those of the ZA Cretaceous intrusions and the NYD granites and are close to the bulk silicate Earth (BSE; Fig. 9a) and Tethyan basalts (Fig. 9b). In the εNd(t) versus (87Sr/86Sr)i diagram (Fig. 8), the porphyries in the ZA have higher εNd(t) values and lower (87Sr/86Sr)i values than the granites in the NYD that were derived from old Yangtze lower crust (He et al. Reference He, Zhu, Zhong, Ren, Bai and Fen2013; Wang et al. Reference Wang, Zhou, Chen, Gao and Yan2013; Wu et al. Reference Wu, Xiao, Wilde, Ma and Zhou2017), which plotted on the mixing curve with the Xiaxiaoliu basalts at the basic end and the western Yangtze lower crust at the felsic end. This indicates a source of 50–65 % asthenospheric mantle and 35–50 % crustal composition. Hence, the magma of the porphyries in the ZA was derived mainly from asthenospheric mantle with a certain contribution of crustal material.
Plots of (a) initial 207Pb/204Pb versus 206Pb/204Pb, and (b) 208Pb/204Pb versus 206Pb/204Pb for the porphyries in the ZA. The data for the ZA Cretaceous intrusions are from Gao et al. (Reference Gao, Yang, Meng and Zhang2017); those for the NYD granites are from Wu et al. (Reference Wu, Xiao, Wilde, Ma and Zhou2017); and those for the Tethyan basalts are from Fan et al. (Reference Fan, Wang, Zhang, Zhang and Zhang2010). Mantle source reservoirs BSE (bulk silicate Earth), DMM (depleted MORB mantle), EM I (enriched mantle type I) and EM II (enriched mantle type II) are from Zindler & Hart (Reference Zindler and Hart1986). NHRL represents the Northern Hemisphere reference line of Hart (Reference Hart1984).
5.c. Fractional crystallization
The components of the porphyries in the ZA show a large diversity, from dioritic to granitic, and the SiO2 contents range from 56.46 to 66.45 wt %. Most of the major and trace elements show a negative correlation with the SiO2 content (Fig. 10), which indicates the process of fractional crystallization. The trends of decreasing MgO, FeOT, Al2O3 and CaO with increasing SiO2 (Fig. 10b–e) suggest fractionation of minerals such as biotite, amphibole and plagioclase, which is consistent with the phenocrysts from the ZA porphyries. In addition, the trends of P2O5 and TiO2 versus SiO2 (Fig. 10a, f) reflect fractionation of apatite and Fe–Ti oxides such as titanite. The Ta and Nb anomalies also suggest crystallization of titanite, which is an accessory mineral in the porphyries.
Variation diagrams of major and trace elements versus SiO2.
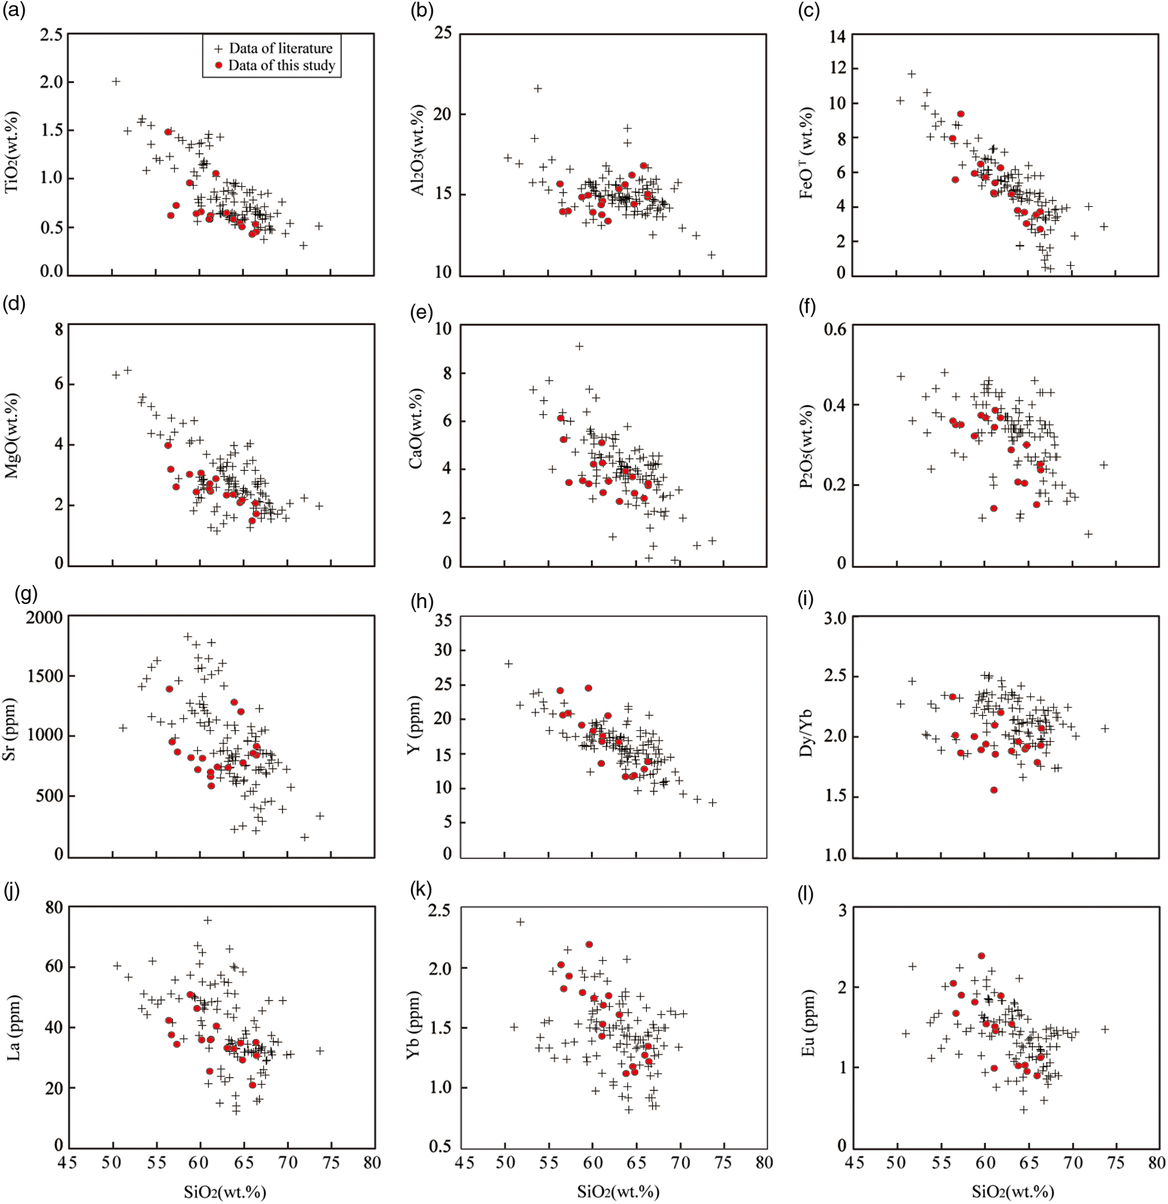
Plagioclase is the main mineral that preferentially incorporates Sr and Eu (Castillo et al. Reference Castillo, Janney and Solidum1999). A negative correlation between these two elements and SiO2 suggests that the plagioclase was fractionating or in a residual phase in the deep magma chamber (Richards, Reference Richards2011). However, the weak negative Eu anomalies (Fig. 5a) may reflect inadequate fractionation, which can be attributed to the high water content of the magma that suppressed the plagioclase crystallization (Moore & Carmichael, Reference Moore and Carmichael1998).
Both amphibole and garnet preferentially partition medium REEs (MREEs) and HREEs. The decreasing trends of Yb and Y versus SiO2 in the ZA porphyries (Fig. 10h, k) suggest fractionation of amphibole and garnet. Moreover, amphibole preferentially incorporates MREEs over HREEs, and garnet can strongly fractionate LREEs from HREEs so that the garnet fractionation will increase the Dy/Yb values, and the amphibole fractionation will conversely decrease the Dy/Yb values (Gao et al. Reference Gao, Santosh, Hou, Wei, Ma, Chen and Wu2012). The Dy/Yb values of the ZA porphyries show a slowly decreasing trend versus SiO2 (Fig. 10i), indicating amphibole fractionation. The listric-shaped chondrite-normalized REE diagram (Fig. 5a) is different from the downward-trending patterns produced by garnet fractionation, which also indicates fractionation of amphibole (Richards, Reference Richards2011).
Obviously, the above correlation of major and trace elements with SiO2 content suggests that the fractional crystallization possibly occurred during the porphyry-forming process in the ZA.
5.d. Origin of the high Sr/Y signature
The porphyries in the ZA have high Sr/Y and La/Yb signatures and are considered to be adakitic rocks. They are usually closely related to porphyry-type Cu polymetallic deposits and differ significantly from the barren granites in the NYD that have low Sr/Y and La/Yb values (Wang et al. Reference Wang, Zhou, Chen, Gao and Yan2013, Reference Wang, Dong, Santosh, Li and Dong2017; Cao et al. Reference Cao, Xu, Chen, Huang, Ren, Zhao and Liu2016). The high Sr/Y and La/Yb signatures of these porphyries are attributed to different processes, such as interaction between slab melts and the mantle wedge (Wang et al. Reference Wang, Zhou, Li and Yan2011); partial melting of the mantle wedge contaminated by minor crustal components (Leng et al. Reference Leng, Zhang, Hu, Wang, Zhong, Wang and Bi2012; Wang et al. Reference Wang, Dong, Santosh, Li and Dong2017); partial melting of a metasomatized mantle wedge that later experienced melting, assimilation, storage and homogenization (MASH) processes (Chen et al. Reference Chen, Xu, Ren, Huang and Wang2014); and partial melting of the juvenile lower crust (Cao et al. Reference Cao, Xu, Chen, Huang, Ren, Zhao and Liu2016).
However, the trace-element contents of the magma can easily be changed by crustal contamination or magmatic processes such as partial melting and crystal differentiation. Theoretically, high Sr/Y and La/Yb magma can be formed by the melting magmatic process of the lower continental crust or oceanic crust with abundant residual garnets or by the post-melting processes of fractionation of abundant garnets or amphiboles ± titanite ± zircon (Richards & Kerrich, Reference Richards and Kerrich2007; Richards, Reference Richards2011; Lu et al. Reference Lu, Loucks, Fiorentini, Yang and Hou2015). Hence, this characteristic cannot be used to indicate a specific magma source or geodynamic condition (Richards, Reference Richards2011; Ma et al. Reference Ma, Zheng, Xu, Griffin and Zhang2015).
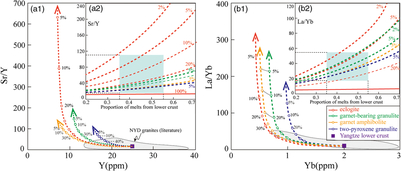
The mechanism for the high Sr/Y and La/Yb signatures produced during the formation processes of the porphyries in the ZA thus remains undetermined. We have inferred that the porphyries were derived from an asthenospheric mantle source with a certain contribution of crust that experienced subsequent fractional crystallization processes. Although the lack of a linear relationship between Sr/Y and La/Yb versus SiO2 suggests that the high Sr/Y and La/Yb values cannot be the result of fractional crystallization, they could be signatures of the magma source. The E-MORB asthenospheric mantle of the ZA has low Sr/Y and La/Yb values of ~11 and ~4.5, respectively, with no evolutionary processes indicated (Chen et al. Reference Chen, Xu, Ren and Huang2017). The western Yangtze lower crust also has low Sr/Y and La/Yb values of ~15.4 and ~6.5, as estimated by Kong et al. (Reference Kong, Xi, Jin and Deng2003). However, high Sr/Y and La/Yb magma can be produced by partial melting of lower continental crust with abundant residual garnets (Ma et al. Reference Ma, Zheng, Xu, Griffin and Zhang2015), and the calculations of batch melting with the initial components of the western Yangtze lower crust suggest that a lower degree of partial melting of lower continental crust could produce higher Sr/Y and La/Yb magma (Fig. 11a1, b1). Therefore, the high Sr/Y and La/Yb signatures of the ZA porphyries could suggest the contribution of western Yangtze lower crust melt that experienced low-degree partial melting. We used a two-component mixing model for Sr, Y, La and Yb to constrain the degree of partial melting based on the formula M = MA × fA + MB × (1 − fA). In our model, the MORB in the ZA is mixed with different proportions of melts from the western Yangtze lower crust with different degrees of partial melting, and the mixed melts have variable Sr/Y and La/Yb values (Fig. 11a2, b2). In combination with the 35–50 % contribution of crust constrained by the Nd and Sr isotopes, 2–10 % partial melting of eclogite from the western Yangtze lower crust is a plausible explanation for the geochemical features of high Sr/Y and La/Yb values, which reached maxima of ~110 and ~55 (Fig. 11a2, b2), respectively.
Partial-melting curves of (a1) Sr/Y versus Y; (a2) Sr/Y versus the proportion of melts from the lower crust; (b1) La/Yb versus Yb; and (b2) La/Yb versus the proportion of melts from the lower crust. The partial-melting curves calculated for batch melting with the initial components of the western Yangtze lower crust (Y = 25 ppm, Sr/Y = 15.4, Yb = 2 ppm and La/Yb = 6.5) are from Kong et al. (Reference Kong, Xi, Jin and Deng2003), and the partition coefficients used for calculation are from Qian & Hermann (Reference Qian and Hermann2013). Different curve colours represent different lower-crustal rocks, and the circles on each curve represent melt fractions of 5 %, 10 %, 20 %, 30 %, 40 % and 50 %. The green fields represent the porphyries in the ZA.
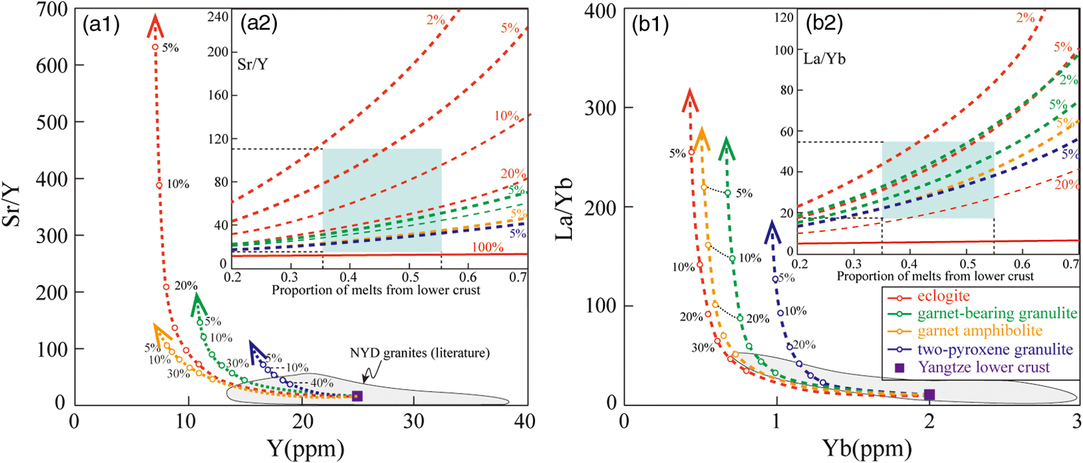
In summary, the break-off of the Garzê–Litang oceanic slab resulted in asthenospheric mantle upwelling. The magma of the ZA porphyries was possibly derived from a mixed melt of 50–65 % asthenospheric mantle and 35–50 % eclogite from the western Yangtze lower crust that experienced low-degree partial melting of 2–10 %, and subsequent fractional crystallization resulted in the decreasing trends of the major- and trace-element contents. The barren granites in the NYD with low Sr/Y and La/Yb values likely resulted from high-degree partial melting of the lower crust (Fig. 11a1, b1).
5.e. Implications for Cu–Au mineralization
The parental magmas of porphyry Cu–Au deposits must be rich in water and sulfur and must be oxidized (Sun et al. Reference Sun, Huang, Li, Hua, Zhang, Sun, Zhang, Ding, Li, Zartmana and Ling2015). A high magmatic water content is the sine qua non of magmatic–hydrothermal ore-forming systems, and the oxidation state and sulfur content play important roles in extracting chalcophile elements such as Cu and Au in residual melts (Richards, Reference Richards2011).
The porphyries in the ZA have high water contents of 4.47–4.94 wt % and magmatic oxidation (Fig 6), which are conducive to porphyry Cu–Au mineralization. The initial Cu content of the magma source is also an important parameter for porphyry Cu–Au mineralization (Zhang et al. Reference Zhang, Sun, Wang, Zhang, Sun and Wu2017). The Xiaxiaoliu basalts have a high Cu concentration of ~160 ppm (Chen et al. Reference Chen, Xu, Ren and Huang2017), which suggests that the asthenospheric mantle in the ZA is enriched in Cu. The lower crust is relatively infertile; however, with the increase in the degree of partial melting under a high oxygen fugacity, the Cu concentration of the melt increases to a maximum, then decreases, and the melt contains the highest Cu concentration of ~220 ppm at a 6 % degree of partial melting (Zhang et al. Reference Zhang, Sun, Wang, Zhang, Sun and Wu2017). The 2–10 % partial melting of the Yangtze lower crust likely produced melt with a high Cu concentration. Mixing of this melt and asthenospheric mantle melt created a magma source with a relatively high Cu concentration. Subsequent fractional crystallization under a high magmatic oxidation state enabled the evolved residual magma to become more fertile and to subsequently form the porphyry Cu–Au deposits.
Compared with the porphyries in the ZA, the barren granites in the NYD were derived mainly from lower crust that experienced a high degree of partial melting (Fig. 11a1, b1) and had a lower oxidation state (Fig. 6). This indicates an infertile granite source and magmatic conditions unfavourable for mineralization regardless of the degree of evolution.
Therefore, a fertile magma source and favourable magmatic conditions including high water content and oxidation state are the determining factors for the porphyry Cu–Au deposits in the ZA.
6. Conclusions
The results of this study are summarized in the following points:
(1) The porphyries in the ZA crystallized at c. 640–829 °C at pressures of 2.1–2.8 kbar, in water-rich (H2O > 4 wt %) and relatively oxidizing conditions.
(2) The porphyries in the ZA were derived from a mixed melt of 50–65 % asthenospheric mantle and 35–50 % western Yangtze lower crust eclogite that experienced a low degree of partial melting of 2–10 %. Subsequent fractional crystallization resulted in the decreasing trends of the major- and trace-element contents. The high Sr/Y signature originated from the low degree of partial melting of the western Yangtze lower crust.
(3) A fertile magma source and favourable magmatic conditions including high water content and oxidation state are the determining factors for the porphyry Cu–Au deposits in the ZA
Acknowledgements
This work was supported by the Fundamental Research Funds for the Central Universities (grant No. 292018150) and the Program of China Geological Survey (grant No. 1212011220920). The authors appreciate the Key Laboratory of Isotope Geochronology and Geochemistry, Tianjin Institute of Geology and Mineral Resources, for providing help with LA-ICP-MS U–Pb analysis. The two anonymous referees and editor Chad Deering are also thanked for offering constructive comments and suggestions on this manuscript.
Supplementary material
To view supplementary material for this article, please visit https://doi.org/10.1017/S0016756819000700.