
I. INTRODUCTION
With the development of science and technology, the living standard of human beings has been continuously improved, while the demand for energy sources is also greatly increased. Among them, the uncontrolled mining and use of fossil fuels have resulted in awfully serious environmental pollution, which will even threaten the survival of human beings. To solve such a problem, finding highly efficient methods to degrade various organic/inorganic pollutants for environmental remediation has become the focus of today’s research. To date, semiconductor nanomaterial-based photocatalysis has been an efficient way for degrading various pollutants together with producing new clean and recyclable energy. Reference Liu, Tian, Tan, Li and Chen1–Reference Wen, Li, Liu, Fang, Xie and Xu3 And generally, one of the key parameters to improve a photocatalyst is how to enhance its carrier density. Reference Hu, Liu, Chen, Shen and Yu4,Reference Feng, Zeng, Chen, Ma, Zhao, Jin, Lu, Wu and He5
As an important member of semiconducting transition metal oxides, MoO2 nanomaterials have many advantages in optical and electrical applications like field emission devices Reference Liu, Zhang, Pan, Zhao, Su, Zhou and Yu6,Reference Wang and Lu7 and some sensors. Reference Alsaif, Field, Murdoch, Daeneke, Latham, Chrimes, Zoolfakar, Russo, Ou and Kalantar-zadeh8 In addition, because the valence band (VB) of Mo4+ in MoO2 has high density of free electrons, MoO2 may have good catalytic activity. Reference Sun, Hu, Luo and Huang9–Reference Scanlon, Watson, Payne and Atkinson12 Therefore, in recent years, MoO2 has been explored for various photoelectrochemical catalysis applications, such as energy storage, Reference Li, Shao, Li, Zhang, Qu and Zheng13–Reference Yoon, Jung, Jin and Shin16 electrocatalysis, Reference Zhang, Xue, Jiang, Xue, Li and Hao17 photocatalysis, Reference Hu, Liu, Chen, Shen and Yu4,Reference Gu, Qin, Zhang, Ma, Wu and Qu18 and photoelectrical conversion. Reference Silaev, Khubezhov, Ramonova, Grigorkina, Kaloeva, Demeev, Bliev, Sekiba, Ogura, Fukutani and Magkoev19,Reference Dukstiene and Sinkeviciute20 However, to the best of our knowledge, there were rarely reports on MoO2 nanomaterial photocatalysts Reference Hu, Liu, Chen, Shen and Yu4,Reference Gu, Qin, Zhang, Ma, Wu and Qu18 possibly because of the inferior conductivity of semiconducting MoO2 inhibiting the carrier transfer and strong recombination of photogenerated electron–hole pairs in them, finally leading to their low photocatalytic performance, which are generally existed phenomena among semiconductor photocatalysts. Reference Zou, Shen, Wang, Wang, Yang and Jing21,Reference Lu, Yu, Ma, Chen and Zhang22
To reduce the recombination of photogenerated electrons and holes in semiconductor photocatalysts, thus improving their photocatalytic efficiency, the compositing of their nanostructures with other catalysts and/or conductive materials is an effective way. Reference Zou, Shen, Wang, Wang, Yang and Jing21,Reference Lu, Yu, Ma, Chen and Zhang22 Therefore, on the one hand, scientists are now trying to explore more MoO2 nanostructures to extend their application for environmental remediation. On the other hand, they are looking for more effective partners to improve the photocatalytic performance of MoO2 nanostructures. Among them, because carbon materials are highly conductive, nontoxic, and generally inexpensive, which can provide effective channels for electron transfer to reduce the recombination of photogenerated-hole pairs in semiconductor photocatalysts, Reference Hu, Liu, Chen, Shen and Yu4,Reference Peng, Wang, Sa, Wu and Sun23–Reference Li, Su and Zhang29 the compositing between carbon and MoO2 nanostructures might be an ideal approach to improve their photocatalytic performance. In the literature, it was reported that the combination of MoO2 and carbon could enhance the conductivity, reduce the particle size, increase the specific surface area, and improve the recycling stability of the materials, Reference Alsaif, Field, Murdoch, Daeneke, Latham, Chrimes, Zoolfakar, Russo, Ou and Kalantar-zadeh8,Reference Chen, Li, Tang, Yin and Qi30–Reference Li, Fu, Jiang, Hu, Liu and Xie32 all of which are positive factors for improving the photocatalytic performance of MoO2.
Moreover, there have been several methods for preparing MoO2/C composite nanomaterials, such as solvothermal synthesis, Reference Pan, Li, Wang, Yang, Zhu, Ren, Lei and Liu33,Reference Wang, Yu and Lou34 hydrothermal process, Reference Jiang, Yang, Wang, Zhao, Guo, Zhao, Beidaghi and Gao35,Reference Liu, Zhao, Yuan, Zhao, Hu and Gao36 electrospinning method, Reference Chen, Yang, Shi, Wang, Zhang and Cao37 and spray pyrolysis. Reference Cho, Song, Kim, Jeong, Lee and Kim38 However, these methods have their intrinsic shortcomings. The products prepared by solvothermal/hydrothermal processes have low purity with various by-products and impurities. The electrospinning method and spray pyrolysis require complicated equipments and processes and usually result in low yield of products. Therefore, to develop a facile approach to prepare MoO2/C composite nanomaterials is still much desirable. And more essentially, to the best of our knowledge, rare reports have addressed their photocatalytic performance. Reference Hu, Liu, Chen, Shen and Yu4,Reference Gu, Qin, Zhang, Ma, Wu and Qu18
In this work, we reported a novel C fibers@MoO2 nanoparticles core–shell composite (NPCSC), which was prepared simply by the high-temperature pyrolyzing pre-oxidized polyacrylonitrile (PAN) fiber together with MoO3 through using a PAN fibers@MoO3 powder composite as the precursor. The composite has high density of MoO2 nanoparticles grown in situ on the surface of carbon fiber. And the photocatalytic activity of the composite was evaluated by degrading organic model dyes, methylene blue (MB) and rhodamine B (RhB), and real environmental pollutants, phenol and potassium dichromate (K2Cr2O7) in aqueous solution under simulated sunlight irradiation (SSI), respectively. Due to the combination of MoO2 and C fibers, the recombination of photogenerated electron–hole pairs is effectively reduced and the lifetime of free carriers is prolonged, significantly improving the solar-driven photocatalytic activity and structure stability of the catalyst during degrading various pollutants, showing the great potential for environmental remediation. Moreover, the compositing of MoO2 with C fibers in the present form of C fibers@MoO2 NPCSC can also facilitate the recycling use of MoO2, due to the fiber feature of the catalyst. In addition, this one-step approach is an easy-to-handle, environmentally friendly, and low-cost synthesis method for large-scale production, which is beneficial for practical application and might be used to prepare other semiconductor-based composite catalysts.
II. EXPERIMENTAL SECTION
A. Samples’ preparation
The reported C fibers@MoO2 NPCSC was synthesized by using a SK-G08123K-610 horizontal quartz tube furnace (Tianjin Zhonghuan Lab Furnace Co., Ltd., Tianjin, China). In the optimized process (please also see Fig. S1 in the Supplementary Material), 1.0 g of commercially purchased reagent grade MoO3 nanopowder with a particle size of 1–5 μm was first dispersed within 5 mL of absolute ethanol, resulting in a white MoO3 suspension. Then, 0.2 g of commercially available PAN fibers was immersed in the suspension for 10 min. After that, the PAN fibers were taken out from the suspension and dried quickly in air, acquiring a PAN@MoO3 composite. After drying, 0.30 g of the acquired PAN@MoO3 composite was laid on an alumina plate at the center of the vacuum furnace.
Before pyrolysis, the quartz tube was evacuated and flushed by 99.99 vol% Ar gas repeatedly for several times. After that, the furnace was first heated up to 400 °C at a rate of 20 °C/min, soaking at 400 °C for 10 min. Then, the temperature was further increased up to 950 °C at a rate of 20 °C/min, maintaining at 950 °C for 1 h. After heating, the furnace was cooled naturally to room temperature. Throughout the whole heating process, the Ar gas flow inside the quartz tube was maintained at 200 sccm, while the vacuum system was continuously operated. Finally, a large amount of purple fiber-like products were collected on the alumina plate.
B. Materials’ characterization
A Sony A580 optical microscope (OM; Sony Corporation, Tokyo, Japan) and a Quanta FEG-650 field emission scanning electron microscope (FE-SEM; FEI, Hillsboro, Oregon) were used to examine the morphology and microstructure of the as-synthesized products. The chemical composition was measured by using an energy dispersive X-ray (EDX) spectroscope attached to the SEM. The phase composition was identified by using a D/max-RB X-ray diffractometer (XRD; Rigaku, Tokyo, Japan; Cu Kα radiation, and λ = 1.5418 Å) in a continuous scanning mode at a speed of 8°/min. A Horiba Jobin Yvon LabRAM HR800 Raman spectroscope (Kyoto, Japan; Nd-YAG laser, λex = 532 nm) was used to characterize the elaborate chemical structure. A Cary 5000 UV-vis spectrometer equipped with a DRA-CA-30I integrating sphere for solid-phase characterization was utilized to record the UV-vis absorption spectra (Varian, Palo Alto, California). The specific surface area was measured by the Brunauer–Emmett–Teller (BET) N2 adsorption method using an ASAP2460 surface analyzer (Micromeritics, Norcross, Georgia). X-ray photoelectron spectroscopy (XPS; Thermo Fisher Scientific, Waltham, Massachusetts; non-monochromated Al Kα radiation, photon energy 1486.6 eV) was applied to examine the chemical state, in which the spectrum was calibrated with the binding energy of C 1s line (284.9 eV). Electrochemical impedance spectroscopy (EIS) was performed at room temperature on a CHI660E electrochemical workstation (Shanghai Chenghua, Shanghai, China) in the frequency from 1 to 10k Hz at a DC bias of 0.03 V across the working electrodes. A Keithley 2410 source meter (Keithley Instruments, Inc., Solon, Ohio) was used to record the transient photocurrent response curves at room temperature under the irradiation of a 300 W Xe lamp while a voltage of 1 V was applied across the electrodes.
C. Photocatalysis tests
The photocatalytic activity of the as-synthesized C fibers@MoO2 NPCSC was evaluated by the degradation of MB, RhB, phenol, and K2Cr2O7 in aqueous media under SSI. For comparison, the commercially bought MoO2 powder, consisting mainly of MoO2 nano-/micro-particles (See Fig. S2), was also investigated under the same condition. Typically, 50 mg of the photocatalysts was immersed into 50 mL of the degraded targets with a concentration of 10 mg/L in a 50 mL quartz reaction flask. Then the reaction flask was placed in the dark for 60 min to achieve the adsorption–desorption equilibrium (See Fig. S3). Subsequently, the reaction flask was exposed to SSI provided by a 5 W white LED light (PCX50A Discover, Beijing Perfectlight Technology Co., Beijing, China) with a light intensity of 36 mW/cm2 on the surface of reaction solutions. For the measurement, throughout the whole testing process, 2–3 mL supernatant samples were extracted regularly from the reaction flask and the dispersed powders in the solution were removed by centrifuging. Among them, 1 mL of 4-aminoantipyrine was also added into the phenol extract in alkaline condition, and 1 mL of 1,5-diphenylcarbazide was added into the K2Cr2O7 extract in acidic condition. The obtained clear solution was then analyzed by using an UV-vis spectrophotometer (SP-752, Spectrum Instruments, Shanghai, China). The measured absorbance value, which is in accordance with the concentration of the degraded targets, was evaluated as a function of irradiation time. After the analysis, the clear solution with the sediment during centrifuging was immediately poured back into the reaction flask so as to keep the irradiation reaction in almost the same state. The above absorbance tests on the organic pollutant solutions were performed at a reaction interval of every 10 min, while those on the inorganic K2Cr2O7 solution was performed of every 20 min.
In addition, the apparent quantum efficiency (φx) of the degradation on MB, RhB, phenol, and K2Cr2O7 in aqueous media over the as-synthesized C fibers@MoO2 NPCSC catalyst was evaluated through irradiation under 420 nm monochromatic light (light intensity 58 mW/cm2) provided by a 300 W Xe lamp but with a band-pass filter. For comparison, those over the commercially available MoO2 powder were also investigated. For the above four reactions, the φx was defined as follows:
 $${\varphi _{\rm{x}}} = {{ \pm \left( {{\rm{d}}\left[ x \right]{\rm{d}}t} \right)} \over {{{{\rm{d}}{{\left[ {hv} \right]}_{{\rm{inc}}}}} / {{\rm{d}}t}}}}\quad ,$$
where d[x]/dt is the change rate of the concentration of the photodegraded target and d[hv]/dt is the incident flux per unit volume of light irradiation. For the evaluation, the incident flux per unit volume of light irradiation was calculated from the intensity of the light irradiation, which was measured by using a FZ-A photometer (Photoelectric Instrument Factory of Beijing Normal University, Beijing, China).
D. Active species trapping experiments
The active species during the photocatalytic degradation over the present C fibers@MoO2 NPCSC catalyst were examined by taking MB as an example according to the method proposed by Huang et al. Reference Huang, Liu, Chen, Zhang, Zhang and Wang39 During typical examination, 1 mM of benzoquinone (BQ), ethylenediaminetetraacetic acid disodium salt (EDTA), and tertbutyl alcohol (TBA), respectively, were also added into the photocatalytic reaction system, while all the other experimental parameters were maintained unchanged. As is reported by Huang et al., in such system, the added BQ, EDTA, and TBA would serve as the quenchers of superoxide radicals (˙O2 −), holes (h+), and hydroxyl radicals (˙OH), respectively.
III. RESULTS AND DISCUSSION
A. Composition, structure, and growth mechanism
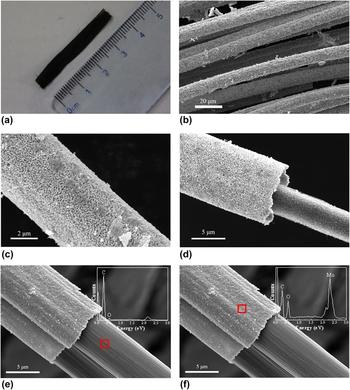
Figure 1(a) presents a typical OM image of the sample. It can be seen from this image that a large bundle of purple fiber-like products could be obtained by the proposed method. The length and number of the obtained fibers are dependent on those of the original PAN fibers, presenting almost no change during pyrolysis. Figures 1(b)–1(f) shows typical FE-SEM images of the sample at different magnifications. From the low magnification image [Fig. 1(b)], it is seen that the sample consists of a large number of fibers, which is consistent with the observation in Fig. 1(a). The high magnification image as shown in Fig. 1(c) indicates that the diameter of the fibers is about 5.7–11.4 μm and a large amount of nanoparticles are aggregating on the sample surface, while those in Figs. 1(d)–1(f) further reveal that the products are of core–shell structures, for which the samples are the fractured segments of the fibers from the sample preparation by ultrasonic vibration in ethyl alcohol. EDX spectroscopy reveals that the core consists dominantly of C atoms [see Fig. 1(e)] and the shell is composed mainly of Mo and O in a ratio of about 1:2.35 [see Fig. 1(f)], indicating that the core is carbon fiber and the shell is molybdenum oxide nanoparticles. It should be noted that due to the low SEM–EDX spatial resolution, C atoms were also detected on the surface of the molybdenum oxide nanoparticles, which might be derived from the core C fibers. Moreover, it was measured that the size of the nanoparticles was in the range of 280–620 nm with a mean value of approximately 410 nm (see Fig. S4), the diameter of the carbon core was approximately 4.9–9.8 μm, and the thickness of the nanoparticles shell was about 0.7–3.2 μm.
Morphology and microstructure of the sample. (a) Typical OM image. (b) Typical low-magnification SEM image. (c) Typical high-magnification SEM image. (d–f) Typical SEM images of a fractured fiber prepared by ultrasonic oscillation in ethyl alcohol, where the insets show the EDX spectra on the inner core and the outer shell, respectively.

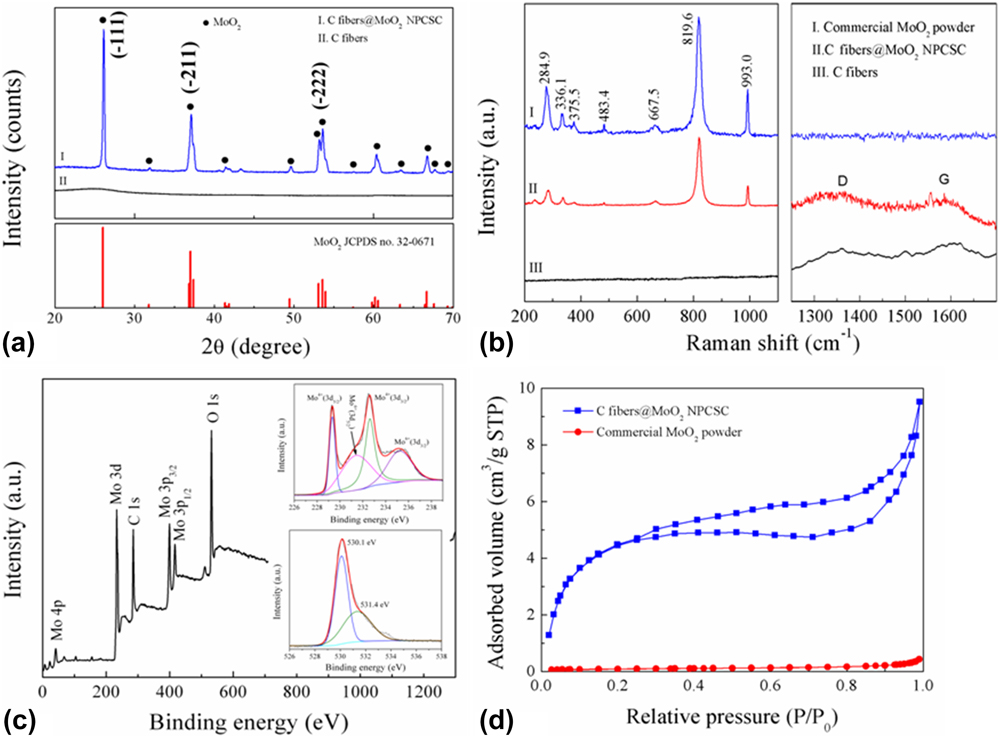
Figure 2(a) displays the typical XRD pattern of the as-synthesized products. For comparison, the XRD pattern of pure C fibers prepared by heating PAN fibers alone under similar conditions is also presented. As is seen, all the diffraction peaks of the prepared samples could be assigned to those of the MoO2 phase (JCPDS card no. 32-0671) and match well with those of the commercially available MoO2 powder (see Fig. S2). This result shows that MoO2 nanoparticles are successfully synthesized under the present conditions.
Phase composition and chemical structure of the sample. XRD pattern (a), Raman spectrum (b), XPS data (c), and N2 adsorption–desorption isotherm (d) of the as-prepared C fibers@MoO2 NPCSC. For comparison, that of the commercially available MoO2 powder and/or pure C fibers prepared by heating PAN fibers alone under similar conditions for the composite are also presented.

The Raman spectrum of the as-synthesized products is presented in Fig. 2(b), together with those of pure C fibers and the commercially bought MoO2 powder. The results clearly confirm the stretching vibration modes of MoO2 at 667.5, 819.6, and 993.0 cm−1, while the finger bands at 284.9, 336.1, 375.5, and 483.5 cm−1 can be assigned to the phonon vibration modes of MoO2. Reference Zhou, Wang, Zhao, Li, Shao, Deng, Liu and Xu40 Furthermore, the two broad peaks located at 1355.0 and 1599.6 cm−1 of the as-prepared products could be assigned to the D and G bands of the core C fibers, respectively, which are in accordance with those of pure C fibers. In addition, the peak position and relative intensity of the products were consistent with those of the previously reported MoO2/graphene composite, Reference Bhaskar, Deepa, Rao and Varadaraju41 which supported the aforementioned SEM and XRD results.
The successful synthesis of MoO2 in the as-prepared products was further confirmed by XPS analysis [Fig. 2(c)]. From the survey spectrum of the sample in this figure, only the signals of Mo, O, and C atoms can be detected. The peaks at 232.1 (Mo 3d), 399.1 (Mo 3p 3/2), 416.1 (Mo 3p 1/2), and 530.2 (O 1s) eV are characteristics of molybdenum oxides. Reference Zhou, Wang, Shao, Deng and Xu42,Reference Qiu, Lu, Liu, Lv, Hu, Li, Yan, Guo and Guo43 Moreover, from the high resolution spectrum of Mo 3d [see the upper inset of Fig. 2(c)], four peaks could be fitted. Among them, 229.3 and 232.5 eV should be attributed to Mo 3d 5/2 and Mo 3d 3/2, respectively, presenting a spin energy separation of 3.2 eV, confirming the Mo(IV) oxidation state of MoO2 Reference Liu, Zhang, Ouyang and Li15,Reference Choi and Thompson44,Reference Chen, Zhang, Li, Shi and Li45 ; and those of 231.5 and 235.3 eV could be assigned to Mo(VI) 3d 5/2 and Mo 3d 3/2 of MoO3, respectively. Reference Sun, Hu, Luo and Huang9 From the high resolution spectrum of O 1s [see the bottom inset of Fig. 2(c)], the strong O 1s peak at about 530.1 eV should be attributed to the oxygen atom in Mo–O–Mo, while the weak one at 531.4 eV might be assigned to the presence of residual oxygen-containing groups bonded with C atoms in the sample. Reference Sun, Hu, Luo and Huang9 In addition, it seems from XPS data that the present sample contains high content of MoO3. However, when considering that there is no MoO3 identified by XRD analysis and XPS is a surface analysis technique, the detected Mo(VI) 3d of MoO3 here might be owing to the slight surface oxidation of metastable MoO2 during the sample preparation and/or XPS measurement, which is consistent with the observation in the literature. Reference Sun, Hu, Luo and Huang9
In summary, all the above results reveal that the as-synthesized products are C fibers@MoO2 NPCSC.
To measure the specific surface area of the as-prepared sample, its N2 adsorption–desorption isotherm was recorded, and the result is shown in Fig. 2(d). For comparison, that of the commercially available MoO2 powder is also presented. As is seen from this figure, both curves are a characteristic of a type IV isotherm with a type H3 hysteresis loop, indicating that they have mesoporous structures. And the pores in the as-prepared C fibers@MoO2 NPCSC distribute in very narrow range, having a mean size around 3 nm (see Fig. S5). Moreover, under the relative pressure (P/P 0) of 1, the volume of the adsorbed N2 gas by the as-prepared C fibers@MoO2 NPCSC is 9.62 cm3/g, while that by the commercially available MoO2 powder is 0.43 cm3/g. Through calculation, the BET specific surface areas of the as-prepared C fibers@MoO2 NPCSC and commercially available MoO2 powder were about 36.02 and 0.32 m2/g, respectively. It can be seen that although both samples have a relatively small specific surface area, the as-prepared sample still has a significantly higher value than the commercially available MoO2 powder, which will be beneficial for the removal of pollutants by adsorption during photocatalytic degradation. With regards to the higher BET specific surface area of the present composite, it might be attributed to the nanoscaled structure of MoO2 nanoparticles and the porous carbon fibers in it.
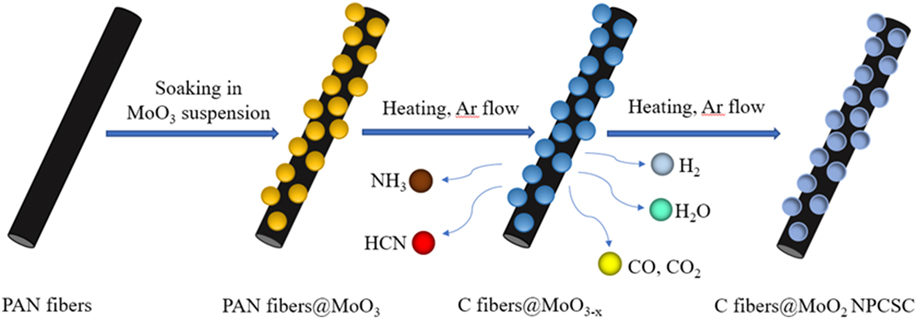
Based on the above results and discussion in combination with Fig. S1, the formation mechanism of the present C fibers@MoO2 NPCSC can be proposed. The whole process can be schematically presented in Fig. 3. In the first step, a composite of PAN fibers@MoO3 particles were formed by soaking PAN fibers in the prepared MoO3 suspension and thereafter drying, during which the MoO3 particles were uniformly coated on the surface of the PAN fibers. In the second step, the oxygen-containing functional groups in the pre-oxidized PAN fibers were dehydrated in inert gas during the early stage at 400–600 °C to form a more stable trapezoidal structure. And the trapezoidal molecules would be cross-linked into graphene structure by dehydrogenation. Reference Deurbergue and Oberlin46 In the third step, when the temperature increased above 600 °C, the composite will undergo the denitrification reaction, forming structured C fibers and releasing H2, NH3, HCN, H2O, and so on. Reference Deurbergue and Oberlin46 At the same time, the partially pyrolyzed C would react with MoO3 to produce MoO2 and reducing gas CO. With the increase in the amount of reductive gases such as H2 and CO, MoO3 nanoparticles were continuously reduced to MoO2 nanoparticles, finally forming the C fibers@MoO2 NPCSC.
Formation mechanism of the products.

B. Optical properties, photocatalytic performance, and mechanism
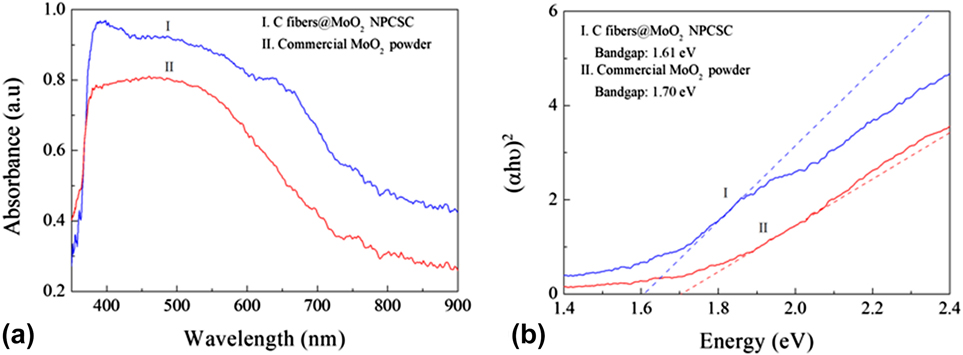
To understand the photocatalytic activity of the present C fiber@MoO2 NPCSC, its UV-vis absorption spectrum was recorded, which is shown in Fig. 4(a). For comparison, that of the commercially available MoO2 powders is also presented. As can be seen from this figure, both samples show a strong absorption of light throughout the visible light (400–900 nm). By using the Kubelka–Munk formula, Reference Yu, Huang, Qin, Zhang, Wang and Liu47 the UV-vis absorption spectra were transformed into the plots of (ahν)2 versus photon energy [Fig. 4(b)]. It is seen from this figure that the as-prepared C fiber@MoO2 NPCSC has a band gap of about 1.61 eV, very close to that of the commercially available MoO2 powder (about 1.70 eV). These results show that the MoO2 nanoparticles in the as-prepared composite have just grown on the surface of the C fiber without any doping effect.
Optical properties of the samples. (a) UV-vis absorption spectra of the C fibers@MoO2 NPCSC and commercially available MoO2 powder, and (b) the calculation diagram of their band gaps.

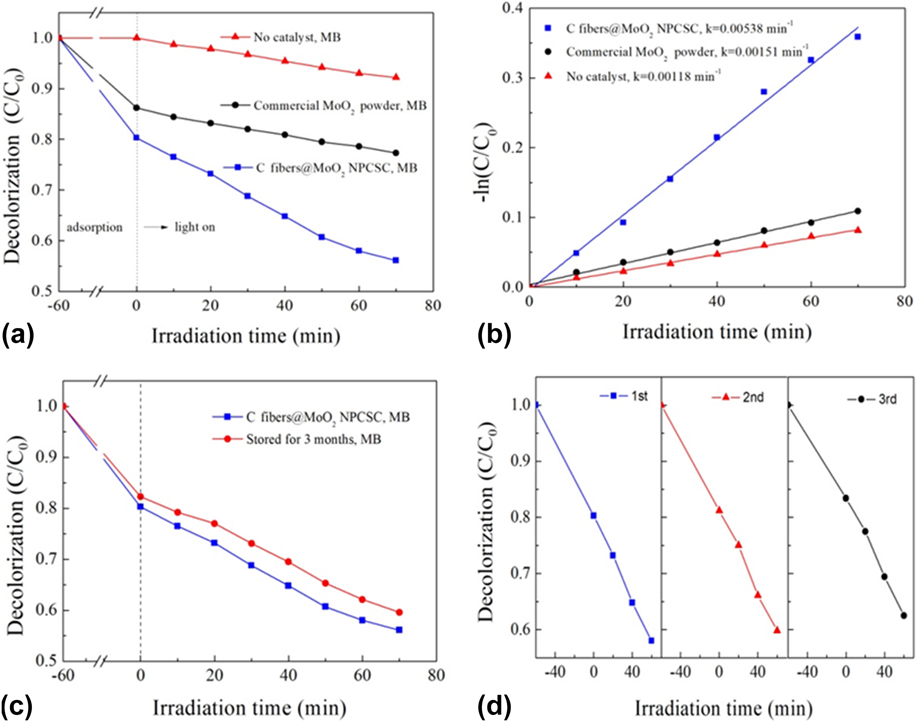
The photocatalytic performance of the C fiber@MoO2 NPCSC was first evaluated by degrading model organic dye MB in aqueous solution under SSI. The results are displayed in Fig. 5. Figure 5(a) shows the decolorization effects on MB over the as-prepared C fibers@MoO2 NPCSC in comparison with those over the commercially available MoO2 powder and without catalyst. During the dark absorption stage, the tests were carried out for 60 min before irradiation to achieve the adsorption–desorption equilibrium (see Fig. S3). It can be seen that during this stage, the decolorized MB by the C fiber@MoO2 NPCSC was 19.7%, while that decolorized by the commercially available MoO2 powder was 13.8%, indicating that both catalyst samples have an apparent adsorption on MB in aqueous solution, but the as-prepared C fibers@MoO2 NPCSC presents a better absorption ability on MB than the commercially available MoO2 powder. During the photocatalytic degradation (70 min under SSI), the degraded MB without any catalyst was 7.8%, indicating that MB is somewhat self-sensitized to SSI. However, under the same condition, the degraded MB by the present C fiber@MoO2 NPCSC reached 24.2%, while that degraded by the commercially available MoO2 powder was 8.9%. These results revealed that both the as-synthesized C fiber@MoO2 NPCSC and the commercially available MoO2 powder presented a significant catalytic activity on the photodegradation of MB under SSI, and after the combination with C fibers, the as-prepared C fibers@MoO2 NPCSC would present a much improved photocatalytic degradation ability on the MB than pure MoO2 powder.
Photocatalytic degradation on model organic dye MB solution over the present C fibers@MoO2 NPCSC catalyst. (a) Decolorization effects under SSI in comparison with those over the commercially available MoO2 powder and without catalyst and (b) their corresponding −ln(C/C 0) versus irradiation time plots. (c) Comparison on the decolorization effects under SSI over the fresh C fibers@MoO2 NPCSC and that stored for a long time. (d) Recycling tests of their photocatalytic degradation under SSI over the as-prepared C fibers@MoO2 NPCSC.

The photocatalytic degradation of MB follows the pseudo-first-order kinetics described by the −ln(C/C 0) = kt. Reference Shen, Zhao, Qian, Peng and Fu48,Reference Qian, Zhao, Shen, Zhang, Peng and Fu49 By this equation, a straight line can be fitted into Fig. 5(b), where the slope of the straight line can be interpreted as the photocatalytic reaction rate constant k. With the C fiber@MoO2 NPCSC, the photodegradation rate constant on MB was 0.00538 min−1, while those over the commercially available MoO2 powder and without catalyst were 0.00151 and 0.00118 min−1, respectively. These results indicate that the as-prepared C fibers@MoO2 NPCSC is an excellent photocatalyst for the photodegradation on MB. And the rate constant of such catalyst would be about 3 and 4 times higher than those over the commercially available MoO2 powder and without catalyst, respectively, indicating that the combination with C fibers could promote the photodegradation reaction rate of MoO2 on MB.
To accommodate for the practical application, the stability of the C fibers@MoO2 NPCSC catalyst was also examined. Figure 5(c) compares the decolorization effects under SSI over the fresh C fibers@MoO2 NPCSC and that stored for quite a long time. It can be seen that the photocatalytic performance of the present C fiber@MoO2 NPCSC catalyst could remain almost unchanged after it was stored for 3 months. The totally decolorized MB over the stored catalyst was 40.4%, almost equaling to that over the fresh catalyst (43.9%). These results reveal an excellent stability of the present C fiber@MoO2 NPCSC photocatalyst during long-term storage. In addition, the sample was also repeatedly applied in the photodegradation of MB to further examine their stability. The result is shown in Fig. 5(d). In the repeated use, the photocatalytic activity of the present C fiber@MoO2 NPCSC catalyst on degrading MB under SSI was reduced very little after three-cycle experiments, indicating that the catalyst has a high chemical stability. As for the little decrease in photocatalytic activity with the recycling time, it is possibly due to the shedding and loss of MoO2 nanoparticles from the sample during the repeated washing and drying after each cycle of the photocatalytic test. After the test, the samples were also examined by SEM, and the result is presented in Fig. S6. In combination with its original morphology, it can be seen from Fig. S6(a) that after photocatalysis tests, most of the C fiber@MoO2 NPCSC catalyst still maintains its structure, indicating that the sample has high structural stability and can be repeatedly applied in degrading MB in aqueous solutions.
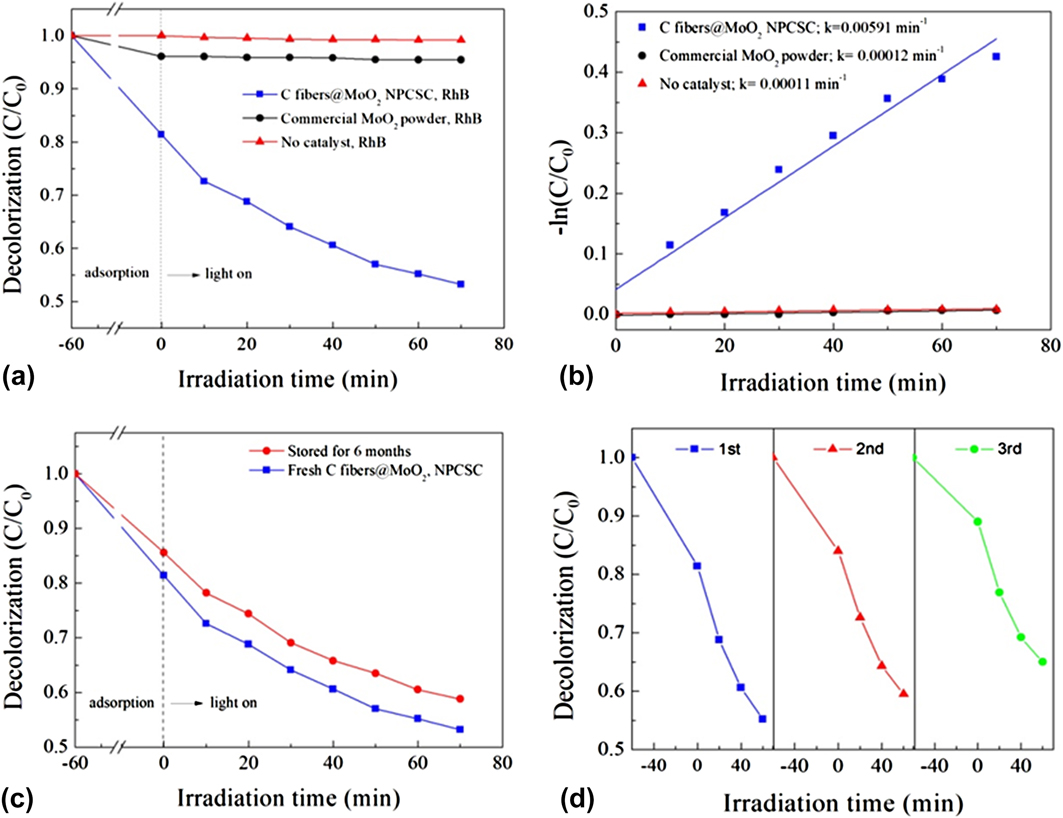
Considering the fact that MB is somewhat self-sensitized to SSI, the photocatalytic performance of the C fibers@MoO2 NPCSC was further verified by the degradation of non-self-sensitized RhB under the same conditions. The results are shown in Fig. 6. Figure 6(a) compares the decolorization effects on RhB over the as-prepared C fibers@MoO2 NPCSC, the commercially available MoO2 powder and without catalyst. As can be seen from this graph, during dark adsorption, the decolorized RhB over the C fibers@MoO2 NPCSC was 18.6%, while that over the commercially available MoO2 powder was only 3.9%, indicating that the as-synthesized C fibers@MoO2 NPCSC possesses much better adsorption ability on RhB than pure MoO2 powder (also see Fig. S3). Moreover, during the photocatalytic degradation stage, the degraded RhB over the C fibers@MoO2 NPCSC reached 28.2%, while that over the commercially bought MoO2 powder was only 0.6%. And as is known, without any catalysts, RhB is almost not sensitive to light, which is consistent with our observation here on RhB that, in the absence of catalyst, the content of RhB was not changed during the whole process under SSI. All these results reveal that the commercially bought MoO2 powder has no usable photocatalytic activity on the degradation of RhB; however, after compositing with C fiber in the present form of C fibers@MoO2 NPCSC, MoO2 would present a greatly enhanced photocatalytic degradation ability on RhB.
Photocatalytic degradation on model organic dye RhB solution over the present C fibers@MoO2 NPCSC catalyst. (a) Decolorization effects under SSI in comparison with those over the commercially available MoO2 powder and without catalyst and (b) their corresponding −ln(C/C 0) versus irradiation time plots. (c) Comparison on the decolorization effects under SSI over the fresh C fibers@MoO2 NPCSC and that stored for a long time. (d) Recycling tests of the photocatalytic degradation under SSI over the as-prepared C fibers@MoO2 NPCSC.

As done for the photodegradtion of MB, the reaction rate constants of degrading RhB under SSI were also fitted. And the results are shown in Fig. 6(b). The calculated rate constants of the photodegradation reactions on RhB over the as-prepared C fibers@MoO2 NPCSC and commercially available MoO2 powder are 0.00591 and 0.00012 min−1, respectively, while that without catalyst presents a negligible value of 0.00011 min−1. It is seen that after composting with C fibers, the photodegradation rate of RhB over the present C fibers@MoO2 NPCSC was 50 times higher than that over the commercially available MoO2 powder, showing a greatly improved photodegradation activity on RhB in aqueous solutions.
Moreover, the stability of the C fibers@MoO2 NPCSC catalyst was also examined during photodegrading RhB. Figure 6(c) illustrates the photocatalytic activity of degrading RhB under SSI over the catalyst stored for 3 months. It can be seen that the photocatalytic performance of the C fiber@MoO2 NPCSC catalyst could almost be maintained after it was stored. The wholly decolorized RhB over the stored catalyst was 41.2%, which was very close to that over the fresh catalyst (46.8%). These results further confirm that the present C fiber@MoO2 NPCSC photocatalyst has excellent stability for long-term storage. In addition, the recycling tests on degrading RhB over the present catalyst were also investigated [see Fig. 6(d)]. It can be seen that after repeated use for three times, the photocatalytic performance of the degradation on RhB over the as-prepared C fiber@MoO2 NPCSC could be well kept with very little reduction in photocatalytic activity, indicating that the present catalyst also has high stability for recycling. As for the slight decrease in photocatalytic activity with increasing recycling time, it is probably due to the shedding and loss of MoO2 from the C fiber@MoO2 NPCSC catalyst during the repeated washing and drying after each cycle of the photocatalytic test. In a word, these results indicate that the present C fiber@MoO2 NPCSC catalyst has excellent photocatalytic stability on the degradation of RhB in aqueous solution under SSI [also see Fig. S6(b)], which is also consistent with the observation on the degradation of MB over the catalyst presented above.
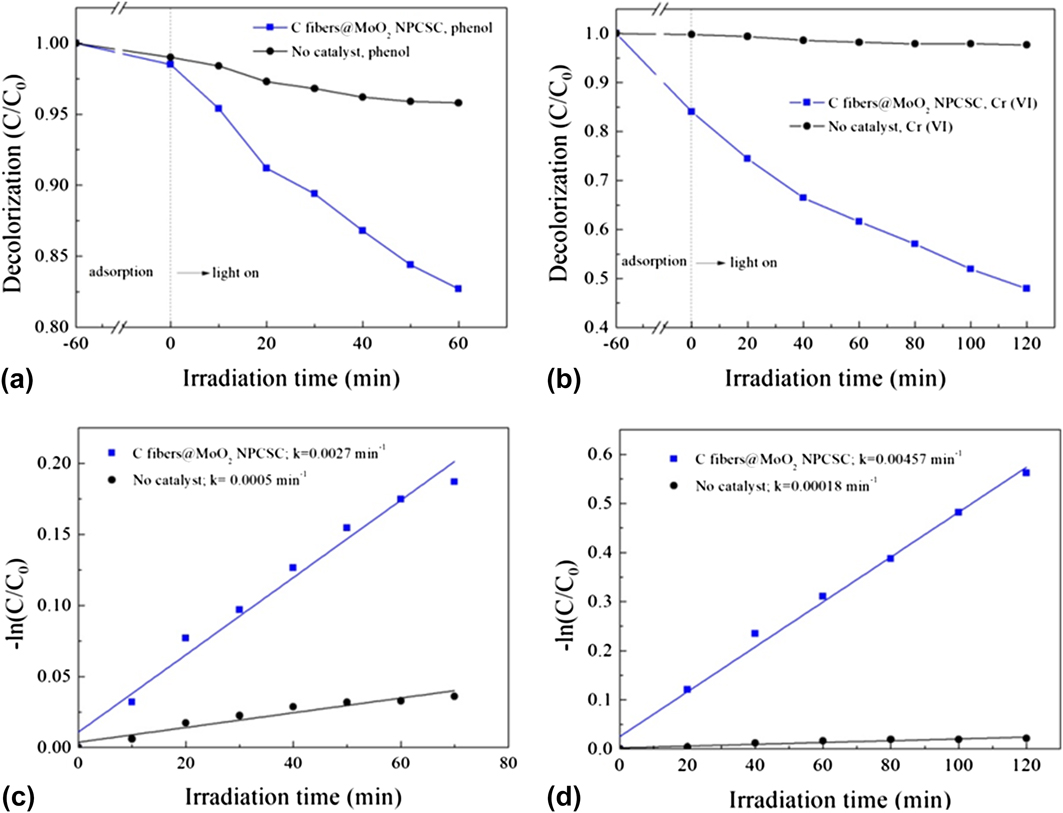
On the basis of their excellent photocatalytic activities on degrading model organic dyes under SSI, the catalyst was also extended to degrade real environmental pollutants including organic phenol and inorganic K2Cr2O7 in aqueous solution, both of which are well-known chemical materials, widely appeared in much industrial waste water, highly toxic to various organisms and of great threat to human health. Reference Mortensen, de Carvalho, Grunwaldt, Jensen and Jensen50,Reference Mytych, Giela and Stasicda51 Figures 7(a) and 7(b) show the degradation effects on phenol and K2Cr2O7 under SSI over the as-prepared C fibers@MoO2 NPCSC. As the experiments were carried out by a color-displaying method, the commercially bought MoO2 powder added would dissolve and diffuse into the phenol or K2Cr2O7 solutions during the tests. So, the comparison was presented only without catalyst. Obviously, with no catalysts, it is difficult for phenol and K2Cr2O7 to be degraded by either adsorption or photodegradation. However, over the as-prepared C fibers@MoO2 NPCSC, the degraded phenol during photodegradation was 15.8%, although the decolorized phenol during adsorption was only 1.4%. On the other hand, the adsorbed Cr(VI) by the C fibers@MoO2 NPCSC was 15.9%, while the photocatalytically degraded Cr(VI) under SSI could reach 36.1%. These results suggested that the as-prepared C fibers@MoO2 NPCSC was also an excellent photocatalyst for degrading real industrial pollutants, which could lead to an efficient decomposition of organic phenol and greatly enhanced reduction of inorganic K2Cr2O7 under SSI. The photocatalytic degradation reaction data were also compared with −ln(C/C 0) versus irradiation time and the results are shown in Figs. 7(c) and 7(d). And the photodegradation rate constants of phenol and K2Cr2O7 were also calculated. Under SSI, the photocatalytic degradation rate constant of phenol over the C fibers@MoO2 NPCSC was 0.0027 min−1 and the self-degradation rate of phenol was only 0.0005 min−1, presenting a 5 times of enhancement. On the other hand, under SSI, the photocatalytic reduction rate constant of K2Cr2O7 was 0.00457 min−1, while the self-degradation rate of K2Cr2O7 was only 0.00018 min−1, displaying a dramatically enhanced rate in a factor of 24. As is concluded from the photodegradation tests on model dyes MB and RhB over the present C fibers@MoO2 NPCSC catalyst presented above, after composting with carbon fibers, the photocatalytic activities of MoO2 nanoparticles for the degradation of phenol and K2Cr2O7 also presented a great enhancement. In addition, after the photocatalytic tests, the used C fibers@MoO2 NPCSC samples were also examined by SEM, and the results are shown in Figs. S6(c) and S6(d). These SEM images show that the surface morphology of the catalyst could still be retained after photocatalysis tests, indicating that the present C fibers@MoO2 NPCSC catalyst also have high stability during degrading real pollutants like organic phenol and inorganic K2Cr2O7.
Photocatalytic degradation on real pollutants phenol and K2Cr2O7 solutions over the present C fibers@MoO2 NPCSC catalyst: (a and b) degradation effects under SSI, and (c and d) their corresponding −ln(C/C 0) versus irradiation time plots.

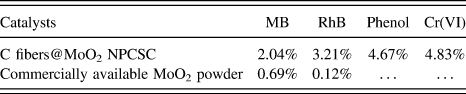
To examine the photocatalytic efficiency of the photodegradation reactions, the apparent quantum efficiency for the degradation on MB, RhB, phenol, and K2Cr2O7 in aqueous media over the as-synthesized C fibers@MoO2 NPCSC catalyst was also measured under 420-nm monochromatic light. And the results are shown in Table I. For comparison, the apparent quantum efficiency of reactions over the commercially available MoO2 powder was also investigated under similar conditions. However, due to the color-displaying method, the apparent quantum efficiency for the reactions over the commercially bought MoO2 powder during degrading phenol and K2Cr2O7 solutions could not be measured. As can be seen from this table, the apparent quantum efficiency of the photodegradation reaction on MB over the as-prepared C fibers@MoO2 NPCSC could reach 2.04%, while that over the commercially available MoO2 powder was only 0.69%. Similarly, the apparent quantum efficiency of photodegradation reaction on RhB over the as-prepared C fibers@MoO2 NPCSC could reach 3.21%, while that over the commercially available MoO2 powder was merely 0.12%. These results also reveal that after compositing with C fibers in the form of the present C fibers@MoO2 NPCSC, the apparent quantum efficiency of the photodegradation reactions on MB and RhB over MoO2 nanoparticles under SSI could be significantly increased in a factor of about 3 and 27. In addition, the apparent quantum efficiencies of the reactions over the as-prepared C fibers@MoO2 NPCSC on photocatalytically degrading phenol and K2Cr2O7 under the same conditions could reach 4.67% and 4.83%, respectively. These results indicate that under the present conditions of light irradiation, the C fibers@MoO2 NPCSC can effectively assimilate photons to produce more active species to degrade the applied pollutants phenol and K2Cr2O7 in aqueous solutions.
Apparent quantum efficiencies of the degradation of MB, RhB, phenol, and Cr(VI) over the C fibers@MoO2 NPCSC catalyst under 420 nm monochromatic light.

In a word, the reported C fibers@MoO2 NPCSC would be a highly efficient solar-driven photocatalyst for the practical application in degrading various organic and inorganic pollutants in aqueous solution, showing the great potential for environmental remediation by degrading toxic industrial chemicals in waste water using sunlight.
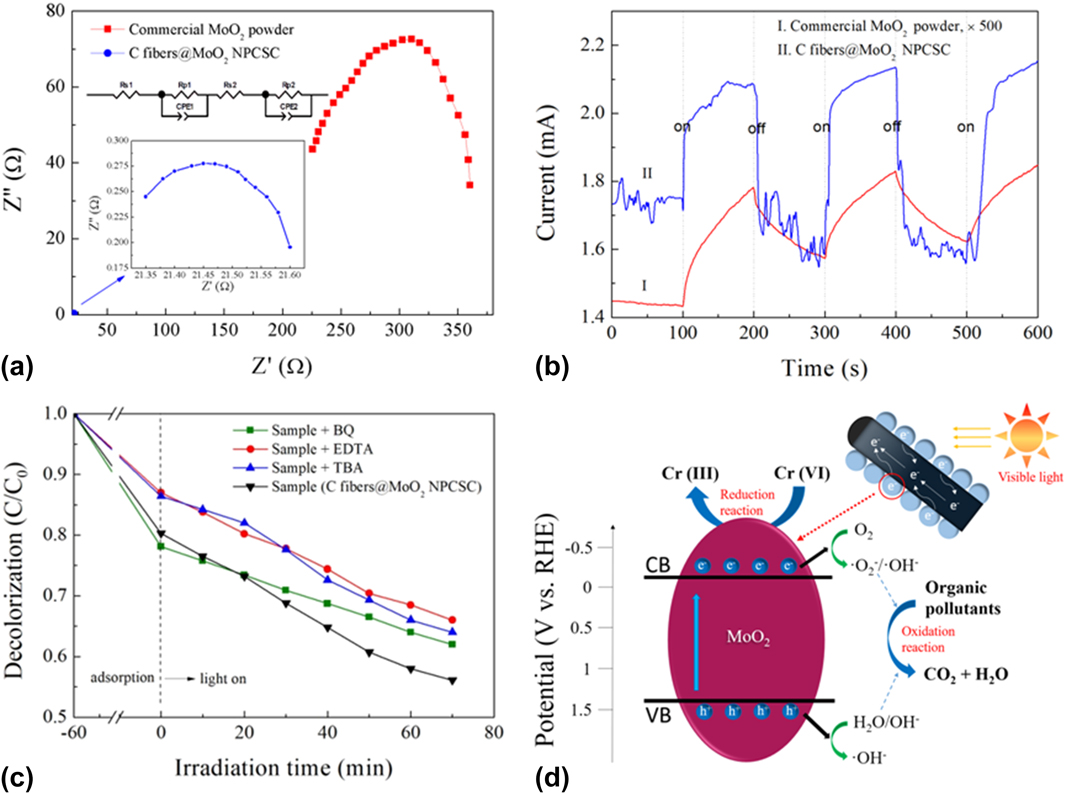
To elucidate the photocatalytic mechanism of the as-prepared C fibers@MoO2 NPCSC catalyst on the degradation of various organic and inorganic pollutants, the EIS experiment was first carried out to examine the charge transfer process in the sample. The result is shown in Fig. 8(a) in comparison with that of the commercially available MoO2 powder. It is known that the resistance of the interface layer can be expressed by the arc radius of the EIS spectrum. The smaller the radius of the arc, the smaller the resistance of the interface layer, the higher the charge transfer efficiency through the sample. It can be seen that the EIS Nyquist arc radius of the as-prepared C fibers@MoO2 NPCSC is much smaller than that of the commercially available MoO2 powder, indicating that the charge transfer resistance of the C fibers@MoO2 NPCSC is significantly decreased after the introduction of C fibers, which will finally facilitate the separation efficiency of photogenerated electron–hole pairs. This result can be attributed to the compositing of MoO2 nanoparticles with high electrical conductivity of the carbon fiber.
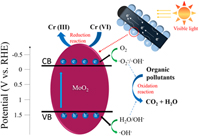
Photocatalytic mechanism. EIS Nyquist plots (a) and transient photocurrent–time curves (b) of the as-prepared C fibers@MoO2 NPCSC and commercially available MoO2 powder. The EIS result was quantified by equivalent circuit model (see the inset). (c) Controlled experiments of the photocatalytic degradation on MB as an example with the addition of different radical scavengers over the C fibers@MoO2 NPCSC. (d) Schematic diagram of the proposed reaction mechanism for the photocatalytic degradation on organic/inorganic pollutants over the as-prepared C fibers@MoO2 catalyst under SSI.

The photocurrent versus time curves of several intermittent on–off cycles recorded on the C fibers@MoO2 NPCSC and commercially available MoO2 powders are shown in Fig. 8(b). It is seen that both of the recorded curves would present photocurrent spikes, which can be attributed to the photo-induced electrons at the initial time of irradiation and the subsequently continuous increase in photocurrent with time until a constant current is reached. During the decay process, the holes resulted by the irradiation competitively recombine with electrons from the conduction band (CB), leading to the decrease of photocurrent. Moreover, although both of the as-prepared C fibers@MoO2 NPCSC and commercially available MoO2 powder have a photocurrent under SSI, the photocurrent intensity of the as-prepared C fibers@MoO2 NPCSC is about 500 times higher than that of the commercially available MoO2 powder, indicating that the number of the photogenerared carriers from the C fibers@MoO2 NPCSC is much bigger and the separation capability of the photogenerated charges in the sample is much stronger, and implying that the photogenerated carriers have a longer lifetime during the light irradiation. This result is well consistent with that of EIS tests.
To detect the active species in the photocatalytic process, by taking MB as an example, BQ, EDTA, and TBA were added into the photocatalytic system, which would serve as the quencher of ˙O2 −, h+, and ˙OH, respectively. Reference Shen, Zhao, Qian, Peng and Fu48,Reference Lu, Zeng, Song, Qin, Zeng and Xie52 Obviously, when BQ was added, the photocatalytic activity of the present C fibers@MoO2 NPCSC catalyst on the photodegradation of MB decreased slightly, indicating that ˙O2 − may have a role as the active species during the photodegradation of MB, although the influence of ˙O2 − might be relatively small. When TBA was added into the reaction system, the effect of the photocatalytic degradation on MB over the C fibers@MoO2 NPCSC catalyst was significantly reduced, revealing that ˙OH was the main active group in the reaction system, which had a great effect on the photodegradation of MB. Similarly, the photocatalytic activity of the present C fibers@MoO2 NPCSC was also significantly decreased after the addition of EDTA into the reaction system, indicating that h+ was also the main active species in the reaction system, playing a dominant role in the photodegradation of MB. All these results indicate that ˙O2 −, h+, and ˙OH all act as the active species for the photocatalytic degradation of MB, among which ˙OH and h+ might be the dominant ones.
Based on the above results, the photocatalytic degradation mechanism of the pollutants over the C fibers@MoO2 NPCSC can be schematically proposed in Fig. 8(d). It is well-known that under light irradiation when the energy of photons is higher than the absorption threshold of a semiconductor, the electrons in the VB of the semiconductor would be excited, jumping up into the CB, thus resulting in photogenerated electrons (e−) in the CB and holes (h+) in the VB. Reference Wen, Li, Li, Ma, He, Xu, Fang, Liu and Gao53,Reference Wen, Xie, Yang, Shen, Li, Luo, Chen and Li54 In the present case, because the band-gap of MoO2 has a quite small value of about 1.6 eV (also see the Mott–Schottky plot in Fig. S7), when the present C fibers@MoO2 NPCSC is exposed to visible light, the photogenerated electrons in the MoO2 nanoparticles would emigrate from the VB to CB, leaving holes in the VB, forming photogenerated electrons–hole pairs. During the photocatalytic processes, the dissolved oxygen in the solution adsorbed on the surface of the MoO2 nanoparticles would capture the electrons to form ˙O2 − radicals, while the holes will react with the adsorbed hydroxyl group and/or water on the catalyst surface, producing ˙OH radicals. Because both the ˙O2 − and ˙OH radicals are highly oxidizing, the majority of organic dyes molecules would be oxidized by them into the final products, CO2 and H2O. In addition, some organic substances might be directly decomposed by the holes produced during the electron jumping. As for the photoreduction of K2Cr2O7, it might be caused by the photogenerated electrons directly. However, for most of pure semiconductors photocatalysts, like the commercially available MoO2 powder in this study, due to the easy recombination of photogenerated electron–hole pairs, their photocatalytic activities on the degradation of various pollutants are not as good as expected. But for the present C fibers@MoO2 NPCSC, because the C fibers core has good electrical conduction, the photogenerated electrons on the CB of the MoO2 nanoparticles shell could be transferred rapidly to the C fibers core, effectively promoting the separation of photogenerated electron–hole pairs and extending the lifetime of photogenerated carriers, thus improving the utilization efficiency of carriers to produce more active species. And the resultant, increasing amounts of h+, ˙O2−, and ˙OH can promote the photooxidation of organic pollutants, while the electrons would help to reduce the inorganic high-valence metal Cr ions, finally enhancing the photocatalytic efficiency of the C fibers@MoO2 NPCSC on the degradation of various organic and inorganic environmental pollutants.
IV. CONCLUSIONS
A novel C fibers@MoO2 NPCSC was successfully prepared by a simple, one-step, in situ growth method via high-temperature pyrolyzing pre-oxidized PAN fiber together with MoO3 through using a PAN fibers@MoO3 powder composite as the precursor. Among the products, MoO2 nanoparticles grew in high density on the surface of the carbon fibers. Moreover, the structured composite prepared by this method has high yield, high density, high purity, and good shape without post-treatment, and this one-step high temperature pyrolysis is a low-cost and environmentally friendly synthesis method for large-scale production.
Under the same conditions, the photocatalytic degradation efficiencies of various organic and inorganic pollutants including MB, RhB, phenol, and K2Cr2O7 under the SSI over the C fibers@MoO2 NPCSC are much improved, compared with those over the commercially available MoO2 powders. After a long period of storage, the visible-driven photocatalytic activity of the composite catalyst could be well kept, indicating that it has high storage stability. During repeating use, the visible-driven photocatalytic activity of the composite catalyst declined very little, revealing that it has good stability, facilitating its recycling use.
Supplementary Material
To view supplementary material for this article, please visit https://doi.org/10.1557/jmr.2018.32.
ACKNOWLEDGMENTS
Financial support for this work from the National Natural Science Foundation of China (Grant Nos. 11674035 and 61274015) and the Fundamental Research Funds for the Central Universities.