INTRODUCTION
The harbour porpoise (Phocoena phocoena Linnaeus, 1758) is protected in EU waters by both national legislation and international agreements including the EU Habitat's Directive and the Agreement on the Conservation of Small Cetaceans of the Baltic and North Seas (ASCOBANS). Within the North Sea and surrounding waters, harbour porpoises are known to be affected by several anthropogenic activities, most notably substantial incidental mortality in fishing operations (Vinther & Larsen, Reference Vinther and Larsen2004; Haelters et al., Reference Haelters, Kerckhof, Jacques and Degracer2011) and habitat displacement from wind farm construction (Carstensen et al., Reference Carstensen, Henriksen and Teilmann2006; Dähne et al., Reference Dähne, Gilles, Lucke, Peschko, Adler, Krügel, Sundermeyer and Siebert2013). Over the last few decades a southerly shift in the range of harbour porpoises in the North Sea has been documented through stranding data (Haelters et al., Reference Haelters, Kerckhof, Jacques and Degracer2011), the SCANS surveys conducted in 1994 (Hammond et al., Reference Hammond, Benke, Berggren, Borchers, Buckland, Collet, Heide-Jørgensen, Heimlich-Boran, Hiby, Leopold and Øien2002) and 2005 (Hammond et al., Reference Hammond, Macleod, Berggren, Borchers, Burt, Cañadas, Desportes, Donovan, Gilles, Gillespie, Gordon, Hiby, Kuklik, Leaper, Lehnert, Leopold, Lovell, Øien, Paxton, Ridoux, Rogan, Samarra, Scheidat, Sequiera, Siebert, Skov, Swift, Tasker, Teilmann, Van Canneyt and Vázquez2013) and observations from shore-based watches (Camphuysen, Reference Camphuysen2004), indicating a return of porpoises to the Dutch and Belgian coasts (Thomsen et al., Reference Thomsen, Laczny and Piper2006; Haelters et al., Reference Haelters, Kerckhof, Jacques and Degracer2011). Until recently, visual surveys, either boat based or aerial, were the only viable method for obtaining abundance estimates. The lack of effective acoustic methodologies and information on animal vocalization rates meant that determining distances to trackline and encounter rates of animals from acoustic detections was difficult. Without these key parameters, the use of distance sampling techniques to estimate abundance and density from acoustic data was not possible. As such, due to the limitations of weather and light on visual methodologies, the majority of population data collected to date has been during summer months. Therefore surveys to further elucidate porpoise distribution throughout the year in the North Sea are a priority.
Passive acoustic monitoring has been shown to be an effective survey tool for harbour porpoises (Hammond et al., Reference Hammond, Benke, Berggren, Borchers, Buckland, Collet, Heide-Jørgensen, Heimlich-Boran, Hiby, Leopold and Øien2002; Gillespie et al., Reference Gillespie, Berggren, Brown, Kuklik, Lacey, Lewis, Matthews, McLanaghan, Moscrop and Tregenza2005; Hastie et al., Reference Hastie, Swift, Slesser, Thompson and Turrell2005; Boisseau et al., Reference Boisseau, Matthews, Gillespie, Lacey, Moscrop and El Ouamari2007). Harbour porpoises echolocate frequently while underwater (Verfuβ et al., Reference Verfuβ, Miller and Schnitzler2005; Akamatsu et al., Reference Akamatsu, Teilmann, Miller, Tougaard, Dietz, Wang, Wang, Siebert and Naito2007; Linnenschmidt et al., Reference Linnenschmidt, Teilmann, Akamatsu, Dietz and Miller2013) producing high-frequency, narrow band clicks with frequencies ranging from 115 to 180 kHz and maximum apparent source levels (ASL) reported between 178–205 dB peak to peak re 1 µPa @ 1 m with a mean of 191 dB pp re 1 µPa @ 1 m (Villadsgaard et al., Reference Villadsgaard, Wahlberg and Tougaard2007). Acoustic surveys allow for detection at night, during poor weather and sighting conditions with acoustic detection rates around eight times higher than visual detection rates (Gillespie et al., Reference Gillespie, Berggren, Brown, Kuklik, Lacey, Lewis, Matthews, McLanaghan, Moscrop and Tregenza2005). Thus, acoustic survey techniques are well suited to those regions or periods where elevated sea states are likely to limit visual survey effort.
The Dogger Bank is an area of relatively shallow water situated in the southern central North Sea which exhibits year-round phytoplankton production (Nielsen et al., Reference Nielsen, Løkkegaard, Richardson, Pedersen and Hasen1993) and represents an important area for harbour porpoises (Hammond et al., Reference Hammond, Macleod, Berggren, Borchers, Burt, Cañadas, Desportes, Donovan, Gilles, Gillespie, Gordon, Hiby, Kuklik, Leaper, Lehnert, Leopold, Lovell, Øien, Paxton, Ridoux, Rogan, Samarra, Scheidat, Sequiera, Siebert, Skov, Swift, Tasker, Teilmann, Van Canneyt and Vázquez2013) and some of their primary prey species including sandeel (Ammodytes marinus), whiting (Merlangius merlangus) and gobies (Pomatoschistus spp.) (MacLeod et al., Reference Macleod, Santos, Reid, Scott and Pierce2007; Cefas, Reference CEFAS2007). The bank is situated in the Exclusive Economic Zones of the UK, the Netherlands, Germany and Denmark and is a protected area for harbour porpoises in the Netherlands (designated as a proposed Site of Conservation Interest; pSCI) and Germany (designated as Special Area of Conservation; SAC). The bank is the largest single continuous expanse of shallow sandbank in UK waters (JNCC, 2011) and is a Special Area of Conservation (SAC) under the EC Habitats Directive (Natura 2000) and part of the OSPAR network of Marine Protected Areas in the North-East Atlantic Ocean; however, harbour porpoises are not listed as qualifying features of any of these UK designations. Harbour porpoises have been found to be distributed within the waters of the bank itself and on the slopes of the Dogger Bank in summer (Hammond et al., Reference Hammond, Benke, Berggren, Borchers, Buckland, Collet, Heide-Jørgensen, Heimlich-Boran, Hiby, Leopold and Øien2002, Reference Hammond, Macleod, Berggren, Borchers, Burt, Cañadas, Desportes, Donovan, Gilles, Gillespie, Gordon, Hiby, Kuklik, Leaper, Lehnert, Leopold, Lovell, Øien, Paxton, Ridoux, Rogan, Samarra, Scheidat, Sequiera, Siebert, Skov, Swift, Tasker, Teilmann, Van Canneyt and Vázquez2013; Gilles et al., Reference Gilles, Peschko, Scheidat and Siebert2012; Geelhoed et al., Reference Geelhoed, van Bemmelen and Verdaat2014).
Several offshore wind farm developments are planned on the Dogger Bank and in adjacent waters; including the Hornsea Extension and the Dogger Bank Wind Farm, which will be one of the largest offshore wind farms constructed. Two of the ‘tranches’ or zones of the planned wind farm will overlap directly with the UK Dogger Bank Special Area of Conservation (Forewind, 2013), and at its maximum extent once completed, the proposed development will cover areas which have been shown to have the highest abundance of harbour porpoises in the North Sea in summer (Hammond et al., Reference Hammond, Macleod, Berggren, Borchers, Burt, Cañadas, Desportes, Donovan, Gilles, Gillespie, Gordon, Hiby, Kuklik, Leaper, Lehnert, Leopold, Lovell, Øien, Paxton, Ridoux, Rogan, Samarra, Scheidat, Sequiera, Siebert, Skov, Swift, Tasker, Teilmann, Van Canneyt and Vázquez2013). Noise from the construction of offshore wind farms has been demonstrated to change harbour porpoise distribution, with strong avoidance responses observed at distances of more than 17 km from piling events (Tougaard et al., Reference Tougaard, Carstensen, Teilmann and Rasmussen2009; Brandt et al., Reference Brandt, Diederichs, Betke and Nehls2011; Dähne et al., Reference Dähne, Gilles, Lucke, Peschko, Adler, Krügel, Sundermeyer and Siebert2013). It is very likely that an extensive and prolonged development such as that planned on Dogger Bank will have significant impacts on the local population of porpoises over a period of several generations.
The aim of this survey was to provide data on the distribution of harbour porpoises in the central North Sea in winter, as there is very limited information on porpoise presence and density at this time of year. Recent developments in acoustic survey methodologies, coupled with increased understanding of harbour porpoise vocalization rates, has created the opportunity for acoustic methodologies to estimate population statistics during times of year and in conditions which have been, until this point, difficult to survey visually. Survey effort was concentrated on the Dogger Bank region in particular due to the upcoming windfarm and protected area developments proposed for this region. In addition, results from other surveys (both unpublished and published) were gathered and presented in order to provide some context and comparison with the results from this study. Several of these surveys were conducted from the same research vessel, RV ‘Song of the Whale’, with similar equipment and analysis techniques and as such were directly comparable; in addition, data collected with similar equipment and analysis techniques are also presented.
MATERIALS AND METHODS
Data collection
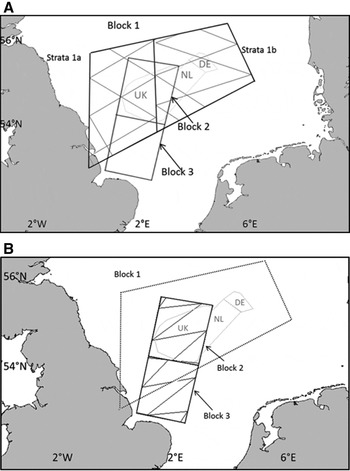
Visual and acoustic data were collected between 7 and 24 November 2011 from RV ‘Song of the Whale’, a 21 m auxiliary-powered cutter-rigged sailing research vessel. The Dogger Bank and surrounding waters were sub-divided into three survey blocks. Block 1, which included the bank itself and adjacent waters (including UK, Dutch, German and Danish portions of the Bank), was sub-divided into two equal-sized stratas (A and B) to allow favourable transect design based on prevailing wind directions (Figure 1A). Blocks 2 and 3 were smaller blocks positioned to the west and south; Block 2 covers only the UK SAC section of the Dogger Bank and Block 3 includes the waters further to the south, towards the north Norfolk coast (called the ‘south-west’ block for the purposes of this study) surveyed in higher resolution than Block 1 (Figure 1B). Using the programme Distance 6.0 (Thomas et al., Reference Thomas, Laake, Rexstad, Strindberg, Marques, Buckland, Borchers, Anderson, Burnham, Burt, Hedley, Pollard, Bishop and Marques2009), randomly generated adjusted angle zig-zig tracklines were planned to provide equal coverage probability within a block. Within each small block (blocks 2 and 3) this amounted to around 600 km of trackline and ~2400 km in the larger block 1 (Figure 1). The design axes were selected in part using the prevailing wind direction to allow for optimal sailing conditions.
Survey tracklines designed using DISTANCE: (A) Block 1 (the main ‘central North Sea’ survey block) including strata A & strata B, with the dotted outline of Blocks 2 and 3, and (B) Block 2 (the UK Dogger Bank Special Area of Conservation) and Block 3 (an area south of the Dogger Bank called the ‘south-west’ for the purposes of this paper) with Block 1 shown as a dotted line. The grey outline represents the British, Dutch and German sectors of the bank.

The acoustic survey was conducted using a 200 m towed two-element broadband hydrophone array (SEICHE Ltd). Continuous stereo recordings with a 500 kHz sample rate were made via a SEICHE buffer box passing signals to a National Instruments USB-6251 sound card. The buffers gave a flat frequency response within the bandwidth of interest for harbour porpoise clicks (115–180 kHz; Villadsgaard et al., Reference Villadsgaard, Wahlberg and Tougaard2007). Recordings were made using Pamguard (Gillespie et al., Reference Gillespie, Mellinger, Gordon, McLaren, Pedmond, McHugh, Trinder, Deng and Thode2009) and written to hard drive as two-channel 16 bit wav files. The acoustic survey ran for 24 h/day in sea conditions up to sea state 6.
Visual observer effort followed distance sampling protocols; in daylight hours and in sea states below four, two visual observers were positioned on an A-frame sightings platform with eye heights of ~5.5 m above sea level to record any cetacean sightings; observers were not prompted by acoustic cues and/or deck observers. Observers scanned out to 90 degrees either side of the trackline, and from close to the vessel out to the horizon with the naked eye, using binoculars only for species confirmation. The team of experienced observers estimated distances by eye and relative angles (using an angle board) to sightings were recorded to a database via the Logger 2000 software (IFAW, 2010) by a dedicated person acting as data logger. Environmental and GPS data were logged automatically to the same database, including date, vessel position (latitude and longitude), sea surface temperature (°C) and wind speed (knots). Manual updates of other environmental variables (such as sea state, wave and swell height) and survey effort (numbers of observers at which positions) were made hourly to the database, or whenever conditions changed.
Data analysis
ACOUSTIC ANALYSIS
Detailed analyses for potential porpoise clicks were conducted by post-processing the recorded audio files. Typical harbour porpoise clicks are distinctive high frequency, narrowband signals with a relatively long duration (100 µs), a peak frequency between 125 and 150 kHz, an inter-click interval of around 60 ms and a maximum source level of 172 dB pp re 1 µPa @ 1 m (Møhl & Andersen, Reference Møhl and Anderson1973; Akamatsu et al., Reference Akamatsu, Hatakeyama, Kojima and Soeda1994; Teilmann et al., Reference Teilmann, Miller, Kirketerp, Kastelein, Madsen, Nielsen and Au2002). It is therefore possible to distinguish and extract potential harbour porpoise clicks from background noise using click detection algorithms such as the click detector module in Pamguard. During analysis, clicks were classified as harbour porpoise clicks if they met all of the following criteria: the click had a peak frequency between 100 and 160 kHz, the energy of the click in the frequency band 100–160 kHz was at least 5 dB above the background noise levels, the duration of the waveform envelope was less than 2 ms and the click had a waveform resembling that of published data for harbour porpoises (for example see Villadsgaard et al., Reference Villadsgaard, Wahlberg and Tougaard2007), with a relatively narrowband structure revealed in a Wigner plot (a quadratic time-frequency representation used to analyse the time-frequency structure of broadband cetacean clicks; Papandreou-Suppappola & Antonelli, Reference Papandreou-Suppappola and Antonelli2001). When clicks were automatically identified, they were displayed visually with their bearing, waveform, frequency spectrum and Wigner plot in a Pamguard Viewer program window. Each click was then manually checked by an analyst to remove any false detections and to separate the clicks into independent acoustic events. A second analyst confirmed these events.
Acoustic events were assessed using the same classification criteria developed for the SCANS-II analysis to allow for comparison between results. Clicks were classified as single clicks (one or two individual clicks), a porpoise event (a train of porpoise clicks with no clear or defined bearing trail from a single animal), a single train (a train of porpoise clicks with a clear and defined bearing trail from a single animal) or a multiple train (one or more trains of porpoise clicks with a clear defined track from multiple animals). Although all porpoise-like events were noted, subsequent analysis was carried out only on click trains with more than seven clicks to allow comparison with other studies (for example Gillespie et al., Reference Gillespie, Berggren, Brown, Kuklik, Lacey, Lewis, Matthews, McLanaghan, Moscrop and Tregenza2005; Boisseau et al., Reference Boisseau, Matthews, Gillespie, Lacey, Moscrop and El Ouamari2007). Additionally, only click trains which were detected while ‘on-track’ were utilized in the analysis. The vessel was considered to be ‘off-track’ if the survey speed was less than 5 or greater than 8 knots, or when the vessel deviated by more than one nautical mile from the planned transect line.
The acoustic encounter rate was calculated for the three blocks along with their standard errors using equation (1). The variance in the number of detections of groups of harbour porpoise n were calculated using transects as sampling units for the survey area (Buckland et al., Reference Buckland, Anderson, Burnham, Laake, Borchers and Thomas2001: 78–80). The variance in the number of detections for each block was calculated as follows:
 $$v\hat ar(n) = L\sum\limits_{i = 1}^k {{l_i}} {\left( {\displaystyle{{{n_i}} \over {{l_i}}} - \displaystyle{n \over L}} \right)^2}/(k - 1)$$
where i is the transect number from 1 to k, l i is the length of transect i and L is the sum of all transect lengths. Variance of the encounter rate per 100 km was calculated by dividing vâr(n) by L 2 and multiplying by 100.
DISTANCE SAMPLING ANALYSIS
Single click trains were consolidated as multiple trains if the click trains overlapped in time or if they occurred within 115 s of each other; this is the time it takes for the survey vessel to advance more than 300 m when travelling at the average survey speed of 6.3 knots. GPS positions were derived for each detection by comparing the exact timing of the start of the click train to the Logger GPS database.
For Conventional Distance Sampling (CDS) analysis only click trains with more than seven clicks were utilized in order to allow direct comparison with previous surveys. Bearings to vocalizing porpoises were measured from the time of arrival difference at the two hydrophone elements. Perpendicular distances were estimated from a sequence of observed bearings as the vessel passed, assuming that the animal was stationary using the target motion analysis algorithm in Pamguard 1.11.02. Estimates of perpendicular distances of greater than 1000 m were assumed to be errors and were not included in the abundance and density estimation. Such errors can arise due to the motion of the animal or from errors in bearings. In addition, 5% of the largest perpendicular distances were truncated (as recommended in Buckland et al., Reference Buckland, Anderson, Burnham and Laake1993) for each area. As the three blocks were designed separately, with different levels of survey coverage, separate detection functions were estimated for each block. Within Block 1, a single detection function based on all data was used for abundance and density estimates for Block 1 as a whole, in addition to the two strata areas A and B.
Density and abundance estimates were calculated using Distance 6.0. Each separate acoustic detection was considered as a unique encounter with a group of harbour porpoises. Probability of detection was modelled using Conventional Distance Sampling (CDS) and Multiple-Covariate Distance Sampling analysis engines (with water depth as a covariate). The detection function model with the best fit to the data was selected based on the lowest Akaike's Information Criterion (AIC). Abundance and density estimates were subsequently corrected for probability of detection on the trackline, g(0), and group size (see below).
Even though harbour porpoises echolocate frequently (Verfuβ et al., Reference Verfuβ, Miller and Schnitzler2005; Akamatsu et al., Reference Akamatsu, Teilmann, Miller, Tougaard, Dietz, Wang, Wang, Siebert and Naito2007; Linnenschmidt et al., Reference Linnenschmidt, Teilmann, Akamatsu, Dietz and Miller2013), their clicks are highly directional and consequently not all vocalizing animals will be detected, even at close ranges. Therefore it cannot be assumed that the probability of detection for an animal directly on the trackline, g(0), is 1. One approach for estimating g(0) is to use the visual and acoustic data as independent observations (Richman et al., Reference Richman, Gibbons, Turvey, Akamatsu, Ahmed, Mahabub, Smith and Jones2014). This approach has been used for similar survey data for harbour porpoises (SMart Wind, 2013: Appendix D, pp. 90–94). To estimate g(0) for acoustic detections, sightings of one or more porpoises were considered as trials for the acoustic detection system. If a porpoise was detected acoustically within 60 s of the time it was predicted to come abeam of the hydrophone based on the estimated location of the sighting then the trial was considered a ‘success’. Otherwise it was considered a ‘failure’.
Each of the acoustic detections used in this analysis represent a group of porpoises. In order to calculate abundance and density estimates of individuals the results needed to be multiplied by an average group size correction factor. The group size correction factor was calculated as the mean group size of harbour porpoises detected visually during this survey.
The variance associated with the estimate of g(0) was calculated from the variance of a binomial distribution based on the number of trials and number of successes. The variance of the density estimate was calculated using the delta method (Buckland et al., Reference Buckland, Anderson, Burnham and Laake1993) for combining the different components that contribute to the overall variance. Equation (2) includes the variance of n from equation (1), the variance in effective strip width (the f(0) term in equation (2)) from programme Distance, the variance of mean school size E(s) and the variance of detection probability for an animal directly on the trackline (g(0)).
 $$\eqalign{\widehat{{var}}(\hat D) & = {{\hat D}^2}\left\{ {\displaystyle{{\widehat{{var}}(n)} \over {{n^2}}} + \displaystyle{{\widehat{{var}}\left[ {\hat f\,(0)} \right]} \over {{{\left[ {\hat f\,(0)} \right]}^2}}}} \right. \left. {\,\,+ \displaystyle{{\widehat{{var}}\left[ {\hat E(s)} \right]} \over {{{\left[ {\hat E(s)} \right]}^2}}} + \displaystyle{{\widehat{{var}}\left[ {\widehat{{g(0)}}} \right]} \over {{{\left[ {\widehat{{g(0)}}} \right]}^2}}}} \right\}} $$
Equation (2) will underestimate the variance because it does not include any uncertainty in duplicate identification, duplicate strip width, or measurement error. However, estimating the variance associated with errors in duplicate identification and duplicate strip width requires relatively large sample sizes. It was also not possible to estimate measurement error for perpendicular distances derived from acoustic data in this study.
CDS and MRDS provide estimates of abundance within survey blocks but do not provide any information on density at a finer spatial resolution. To provide this finer resolution information, density surface modelling was undertaken for the large ‘central North Sea’ survey block (Block 1) using Distance 6.0 and R (R Development Core Team, 2014). In order to create a density surface model the data were reanalysed using the Mark Recapture Distance Sampling (MRDS) analysis engine before using the Density Surface Modelling analysis engine. The model selected for Block 1's abundance and density estimation was used in this analysis. For DSM analysis the effort data need to be divided into segments, and thus transects were separated into 1 km segments (~ twice the maximum detection distance), and a prediction grid using 5 km spacing was created. The density of animals in each grid cell was then modelled using a Generalized Additive Model (GAM) with explanatory variables provided by the environmental covariates latitude, longitude and depth (averaged over each 5 km grid cell).
RESULTS
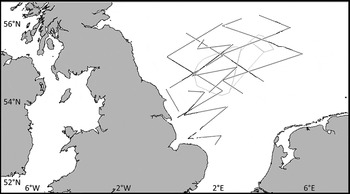
The total effort for the survey was 4187 km which included 2980 km ‘on track’ with at least acoustic effort, 653 km of which included visual effort (Figure 2 and Table 1). There were 13 sightings of harbour porpoises, nine of which were observed during periods with dedicated visual effort. The mean group size was 1.6 (SD 1.3) individuals and ranged from one to six animals. As expected at this time of year the sighting conditions were not ideal; the mode sea state for the survey was 3 (21% of on-track daylight hours had a sea state of 2, 43% a sea state of 3, 29% a sea state of 4 and 8% a sea state of 5) and 15% of the on-track daylight hours had fog, haze, mist or drizzle limiting sighting conditions.
The survey tracks completed by R/V ‘Song of the Whale’ in November 2011. Dotted lines represent transects with only acoustic effort while solid lines represent transects with simultaneous acoustic and visual effort.

Acoustic survey effort and survey block coverage.

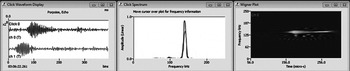
The peak frequency of the harbour porpoise clicks recorded during this survey was relatively high ranging between 130 and 140 kHz, with duration of ~0.15 ms (Figure 3). There were 769 detections of harbour porpoises in the acoustic data including single clicks, events and click trains (208 of which were off-track during passages and between blocks). Of the on-track detections, 373 had more than seven clicks in the train and were used in subsequent analysis. The survey of Block 3, ‘south-west’, had the highest encounter rate of the three survey blocks (17.8/100 km). In Block 1, the ‘central North Sea’ survey area, the west of the North Sea (strata A) had a much higher encounter rate (15.1/100 km) than the east (strata B) (8.8/100 km), with almost double the number of porpoises detected (Table 2). Block 2, the ‘UK Dogger Bank SAC’, had the lowest encounter rate of the surveyed areas (8.1/100 km).
A typical porpoise click recorded in the central North Sea. The figure shows fore and rear channels, their waveforms, click spectrum and Wigner plot as displayed in a Pamguard click detector module (Gillespie et al., Reference Gillespie, Mellinger, Gordon, McLaren, Pedmond, McHugh, Trinder, Deng and Thode2009). This click displays the characteristic sinusoidal waveform, narrowband ultrasonic peak frequency and flat Wigner plot of harbour porpoises; clicks recorded in the central North Sea had peak frequencies of approximately 139–142 kHz.

Summary of acoustic and visual detections of porpoises. The total number of acoustic detections made on the trackline in each block is shown. Acoustic detection rates are expressed as the number of porpoise events per 100 km of trackline. Sightings of porpoises are expressed as total number of encounters and total number of individuals seen (in parentheses).

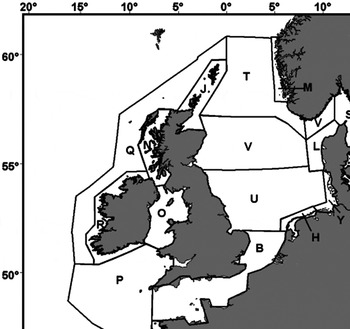
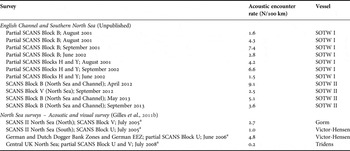
The acoustic encounter rates within this survey were compared with other harbour porpoise surveys undertaken from RV ‘Song of the Whale II’ (SOTW), a smaller auxiliary powered sailing vessel R/V ‘Song of the Whale I’ as well as with unpublished data from other North Sea surveys utilizing similar techniques (Table 3). The blocks surveyed during this study show higher acoustic encounter rates than the other surveys of the North Sea and are much higher than those from the 2005 SCANS survey of the central North Sea (SCANS block U). Additionally the acoustic encounter rates from the surveys/passages in the northern North Sea (SCANS block V) in 2005 and 2012 are lower than all blocks surveyed during this study in the central North Sea (block U) (Figure 4).
The areas defined by SCANS II (from Hammond et al., Reference Hammond, Macleod, Berggren, Borchers, Burt, Cañadas, Desportes, Donovan, Gilles, Gillespie, Gordon, Hiby, Kuklik, Leaper, Lehnert, Leopold, Lovell, Øien, Paxton, Ridoux, Rogan, Samarra, Scheidat, Sequiera, Siebert, Skov, Swift, Tasker, Teilmann, Van Canneyt and Vázquez2013).

Summary of previous harbour porpoise surveys conducted utilising similar equipment and methodologies. The acoustic detection rates are expressed as the number of porpoise events per 100 km of trackline. The name of the survey vessel is presented; variations in the amount of noise created by vessels can affect the rate of acoustic encounters.

a Data analysed based on porpoise click trains of six or more clicks (thus potentially deriving slightly higher estimates of encounter rate).
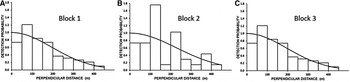
Detections were truncated at 450 m from the trackline in each block, excluding ~5% of the largest perpendicular distances: Block 1 (excluding 5.4%, N = 13), Block 2 (excluding 5.1%, N = 2), and Block 3 (excluding 6.2%, N = 6). Using the Conventional Distance Sampling (CDS) analysis engine, a half-normal key function with cosine adjustment terms including no covariates was found to be the most suitable model for detection function in all cases and therefore depth was not included as a covariate. Histograms of perpendicular distances all showed a lower detection rate between 0 and ~100 m (Figure 5) than at greater perpendicular distances. Further investigation of the influence of water depth on detection characteristics found deeper regions were associated with significantly higher estimates of perpendicular distance (χ2 = 40.9; df = 4; P < 0.001).
Histograms of perpendicular distances to harbour porpoises for the three survey blocks all fitted with half normal keys: (A) Block 1, (B) Block 2, (C) Block 3. Model selection was based on Akaike Information Criterion (AIC) values.

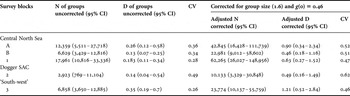
There were 13 visual encounters of harbour porpoise during the survey; all were used as acoustic trials and six of these were detected acoustically. These numbers are too small for a full duplicate analysis using estimated strip widths for visual, acoustic and duplicates following the method of Buckland et al. (Reference Buckland, Anderson, Burnham, Laake, Borchers and Thomas2001). However, assuming that acoustic detection ranges (maximum 450 m in this study) were greater than visual (maximum 350 m in this study), due to the height of the observation platform and the winter sea state, a crude estimate of g(0) for acoustic detections would be 6/13 or 0.46 with 95% CI of 0.19–0.75 derived from a binomial distribution. There are few other estimates of g(0) for similar acoustic surveys. SMart Wind (2013) estimated a g(0) of 0.56 with 95% CI of 0.42–0.76 for surveys in the southern North Sea from a larger vessel. The density and abundance estimates in Table 4 apply the 0.46 estimate for g(0) on the CDS results to calculate adjusted density and abundance estimates taking into account animals which may have been missed.
Absolute abundance (N) and density (D) estimates (as animals per km2) of harbour porpoises in the Dogger Bank survey area given without adjustment, and adjusted for the probability of detection, g(0), and group size, presented with 95% confidence intervals and coefficients of variation.

From the limited number of sightings (N = 13, including nine on-effort and four off-effort) during this survey, average group size was 1.6 (SD 1.3). A similar study of harbour porpoises in the North Sea conducted throughout a 2-year period also found an average group size of 1.6 (SMart Wind, 2013). This estimate varied throughout the year, however in the winter months the average group size was 1.6. Additionally, the SCANS II survey of the North Sea Block U (which is most similar in area to Block 1 surveyed here) calculated a group size estimate of 1.62 (Hammond et al., Reference Hammond, Macleod, Berggren, Borchers, Burt, Cañadas, Desportes, Donovan, Gilles, Gillespie, Gordon, Hiby, Kuklik, Leaper, Lehnert, Leopold, Lovell, Øien, Paxton, Ridoux, Rogan, Samarra, Scheidat, Sequiera, Siebert, Skov, Swift, Tasker, Teilmann, Van Canneyt and Vázquez2013). Thus a figure of 1.6 was used to correct for group size. Absolute abundance and density estimates are displayed in Table 4. Corrected and uncorrected estimates are presented due to the small number of sightings during this winter survey, rendering estimates of the probability of detection and group size less accurate.
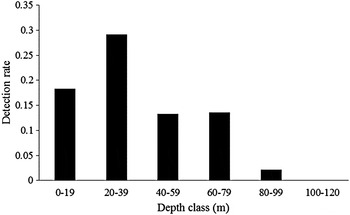
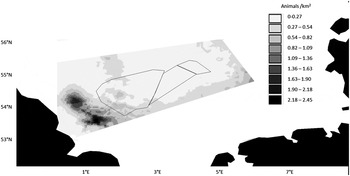
Density surface modelling was conducted only for Block 1, the large central survey block (using areas A and B as strata); DSM was not conducted for Blocks 2 and 3, as not only do they overlap considerably with Block 1, they also received significantly less survey effort. For density surface modelling in R it was necessary to use the MRDS model which gave a slightly different overall absolute density estimate for the ‘central North Sea’ block of 0.20 (with 95% CI 0.12–0.32). However, as this result lies within the 99% CI from the CDS analysis engines, it was considered appropriate to use this model in the density mapping. Depth, latitude and longitude were found to be significant covariates in predicting densities (P < 0.001 for all) with 17% of the variance explained using these three covariates. Higher densities of harbour porpoises were predicted in shallow waters, especially in the depth range of 20–40 m (Figure 6). Figure 7 shows a density surface model of predicted density from the acoustic data collected during the survey. The waters in the west of the survey area were characterized by much higher porpoise densities than in the east, with the waters to the far south-west of the UK SAC (Block 2) having the highest density within the survey area.
Detection rate (detections/effort) of harbour porpoises in each water depth class.

A map of the predicted density of harbour porpoises across the ‘central North Sea’ survey area created from density surface modelling using depth, latitude and longitude as covariates. The black lines denote the Dogger Bank areas of the UK, Netherlands and Germany (from left to right respectively).

DISCUSSION
This is one of the first studies to provide information on the presence, distribution and density of harbour porpoises in the central North Sea during winter. An estimated abundance of 62,265 (95% CI 26,114–149,455) harbour porpoises was derived for the ‘central North Sea’ survey area (Block 1) using acoustic techniques. The winter density estimate of 0.63 (95% CI 0.27–1.52) individuals km−2 is very similar to that of Block U from the SCANS II summer survey of 0.6 individuals km−2 (Hammond et al., Reference Hammond, Macleod, Berggren, Borchers, Burt, Cañadas, Desportes, Donovan, Gilles, Gillespie, Gordon, Hiby, Kuklik, Leaper, Lehnert, Leopold, Lovell, Øien, Paxton, Ridoux, Rogan, Samarra, Scheidat, Sequiera, Siebert, Skov, Swift, Tasker, Teilmann, Van Canneyt and Vázquez2013, using visual data) and an estimate of 0.68 individuals km−2 in summer in the central North Sea from aerial surveys in 2013 (Geelhoed et al., Reference Geelhoed, van Bemmelen and Verdaat2014), suggesting consistent year-round presence in the central North Sea. In contrast, studies from the southern North Sea have found a distinct peak in harbour porpoise presence in spring (March–May), with successively decreasing densities in summer (June–August) and autumn (September–November) off the Dutch continental shelf (Geelhoed et al., Reference Geelhoed, Scheidat, van Bemmelen and Aarts2013) and southern German North Sea (Peschko et al., Reference Peschko, Ronnenberg, Siebert and Gilles2016). The distribution patterns from this survey are similar to those reported by the SCANS II visual summer survey (Hammond et al., Reference Hammond, Macleod, Berggren, Borchers, Burt, Cañadas, Desportes, Donovan, Gilles, Gillespie, Gordon, Hiby, Kuklik, Leaper, Lehnert, Leopold, Lovell, Øien, Paxton, Ridoux, Rogan, Samarra, Scheidat, Sequiera, Siebert, Skov, Swift, Tasker, Teilmann, Van Canneyt and Vázquez2013) and the DEFRA/IMARES aerial summer surveys (Geelhoed et al., Reference Geelhoed, van Bemmelen and Verdaat2014), with particularly high porpoise densities found in the west of the North Sea, especially to the west of the Dogger Bank.
In order to put the results of this survey into a wider context, relative acoustic encounter rates have been presented and comparisons drawn with other areas surveyed using similar techniques in the North Sea and further afield (Table 3). The acoustic encounter rates from this study are much higher than any of the others reported for the North Sea blocks V, U and B (Table 3; Figure 4), and are comparable only to a survey conducted from RV ‘Song of the Whale I’ in the Kiel Bight (10.5 encounters per 100 km) and Little Belt (16.8 encounters per 100 km) in 2002 (Gillespie et al., Reference Gillespie, Berggren, Brown, Kuklik, Lacey, Lewis, Matthews, McLanaghan, Moscrop and Tregenza2005), an area known for its high harbour porpoise density (Teilmann et al., Reference Teilmann, Sveegaard, Dietz, Petersen, Berggren and Desportes2008). Similarly, a recent double platform visual survey in the western Baltic, Belt Seas and Kattegat estimated the density of harbour porpoise in this area as 0.79 animals km−2 (Viquerat et al., Reference Viquerat, Herr, Gilles, Peschko, Siebert, Sveegaard and Teilmann2014) which is comparable to this survey (0.63 animals km−2). These results indicate that the central North Sea (Block 1) provides an important habitat for harbour porpoises in winter months. Furthermore, a study of the seasonal presence of harbour porpoises in the German Bight modelled the density of harbour porpoises over the German part of the Dogger Bank in spring (1.01 animals km−2), summer (0.93 animals km−2) and autumn (0.07 animals km−2) demonstrating a year-round presence of harbour porpoises in this part of the North Sea (Gilles et al., Reference Gilles, Adler, Kaschner, Scheidat and Siebert2011a), with densities higher in the spring and summer than those found in this study. Both the SCANS II survey in the northern North Sea in summer and data collected during a recent passage by SOTW within the northern North Sea SCANS block V in September (see Table 3), show acoustic encounter rates lower than those found in this study of the central North Sea. These reported higher densities in the south compared with the north of the North Sea appear to be consistent with the apparent southern shift of the distribution of harbour porpoise in the North Sea in summer (Camphuysen, Reference Camphuysen2004; Gilles et al., Reference Gilles, Scheidat and Siebert2009; Hammond et al., Reference Hammond, Macleod, Berggren, Borchers, Burt, Cañadas, Desportes, Donovan, Gilles, Gillespie, Gordon, Hiby, Kuklik, Leaper, Lehnert, Leopold, Lovell, Øien, Paxton, Ridoux, Rogan, Samarra, Scheidat, Sequiera, Siebert, Skov, Swift, Tasker, Teilmann, Van Canneyt and Vázquez2013).
Lastly, the acoustic encounter rates and density surface modelling from this study highlight the west, but especially the south-west parts of the survey area as having particularly high densities of harbour porpoises. SCANS surveys in 1994 and 2005 both showed a concentration of encounters in the west of the North Sea during summer (Hammond et al., Reference Hammond, Benke, Berggren, Borchers, Buckland, Collet, Heide-Jørgensen, Heimlich-Boran, Hiby, Leopold and Øien2002, Reference Hammond, Macleod, Berggren, Borchers, Burt, Cañadas, Desportes, Donovan, Gilles, Gillespie, Gordon, Hiby, Kuklik, Leaper, Lehnert, Leopold, Lovell, Øien, Paxton, Ridoux, Rogan, Samarra, Scheidat, Sequiera, Siebert, Skov, Swift, Tasker, Teilmann, Van Canneyt and Vázquez2013). Estimated average densities from year-round surveys over a possible wind farm construction site centred around 54°N 2°E were 1.3 individuals km−2 from acoustic data or 1.6 individuals km−2 from visual data (SMart Wind, 2013). These surveys largely overlapped with Block 3 from this survey (Figure 1) and demonstrated similar density estimates from acoustic data; some of the highest reported densities of harbour porpoises measured in the North Sea. The reasons for the high porpoise numbers in the west, and especially south-west of the central North Sea are unclear, however it may in part be due to the overlap with higher densities of their prey, as has been found in the German Bight (Herr et al., Reference Herr, Fock and Siebert2009). Efforts have been made using stranding data from the northern North Sea (Macleod et al., Reference Macleod, Santos, Reid, Scott and Pierce2007), the North-East Atlantic (Santos & Pierce, Reference Santos and Pierce2003), and the German North Sea coast (Benke et al., Reference Benke, Siebert, Lick, Bandomir-Krischak and Weiss1998) to determine the diet of harbour porpoises, and the lesser sandeel (Ammodytes tobianus) has been found to be an important prey source. Sandeel distribution is patchy in relation to sediment type (Wright et al., Reference Wright, Jensen and Tuck2000), sandeels tending to occupy areas on the sloping edges of sand banks in sediments where the silt content is between 4 and 10% (Wright et al., Reference Wright, Jensen and Tuck2000; Holland et al., Reference Holland, Greenstreet, Gibb, Fraser and Robertson2005). In a survey conducted in the North Sea in April and May the highest abundance of sandeels was found along the western boundary of the Dogger Bank (Forewind, 2012). Although this survey was conducted during summer months, there is little evidence of movement between seasonal feeding and spawning grounds (Kunzlik et al., Reference Kunzlik, Gauld and Hutchenon1986), suggesting this fish species may remain in the same areas year round. Additionally, the distribution of sandeel fisheries between 1995 and 2007 showed the highest landings in the central to south-west of the North Sea (Deurs et al., Reference Deurs, Hal, Henrik, Tomczak and Dolmer2009).
In this study, certain assumptions had to be made in order to calculate a corrected density and abundance estimate. As with many acoustic datasets (for example SMart Wind, 2013), the histograms of perpendicular distances all show lower detection rates between 0 and ~100 m (Figure 5) than at greater perpendicular distances. These perpendicular distances more accurately represent the distance of a vocalizing animal at depth from the axis of the hydrophone rather than from the trackline. A significant difference in the estimates of perpendicular distance was found between depth classes, with larger perpendicular distances estimated at greater water depths. Diving behaviour may, in part, explain the shape of these detection functions; however, as much of the survey area was relatively shallow, especially over the Dogger Bank, avoidance of the vessel may also be a contributing factor. Group size corrections (mean = 1.6) were applied to the sightings data from this survey as they were in keeping with estimates from other similar surveys in the central North Sea area (Hammond et al., Reference Hammond, Macleod, Berggren, Borchers, Burt, Cañadas, Desportes, Donovan, Gilles, Gillespie, Gordon, Hiby, Kuklik, Leaper, Lehnert, Leopold, Lovell, Øien, Paxton, Ridoux, Rogan, Samarra, Scheidat, Sequiera, Siebert, Skov, Swift, Tasker, Teilmann, Van Canneyt and Vázquez2013; SMart Wind, 2013). However, aerial surveys of a similar survey area in summer observed a slightly smaller mean group size of 1.25 animals (Geelhoed et al., Reference Geelhoed, Scheidat, van Bemmelen and Aarts2013), whereas spring (March) and autumn (October/November) surveys of the Dutch continental shelf (to the east of our survey area) observed average group size of 1.09 and 1.19 respectively (Geelhoed et al., Reference Geelhoed, Scheidat, van Bemmelen and Aarts2013). It should be noted that comparing group size data collected through boat-based and aerial-based surveys presents challenges due to differences in methodologies including speed and observer height. Additionally, during many visual cetacean surveys, larger groups have a higher probability of detection than smaller ones and single individuals. Due to the small number of sightings in this study, this was not corrected for when making the group size estimates which may present a bias in this calculation.
Vessel-based visual surveys for harbour porpoises in the North Sea in winter months are compromised by confounding weather conditions, low sighting probabilities in sea-states above two (Teilmann, Reference Teilmann2003) and low observation heights. This acoustic survey demonstrates the efficacy of detecting porpoises using acoustic techniques; in this case, acoustic detection was ~26 times more effective than visual means throughout the survey (with seven times more acoustic detections than visual detections during periods of concurrent visual and acoustic on-track effort). Utilizing combined visual and acoustic survey techniques to estimate absolute abundance and density of porpoises is an emerging science, with associated limitations and assumptions; however, this technique has provided one of the first estimates of winter abundance and density of harbour porpoises within the central North Sea.
Despite the apparent importance of the central and southern North Sea to harbour porpoises, the individuals there face many anthropogenic challenges in the region ranging from by-catch to disturbance from man-made noise. By-catch is considered to be a major threat to harbour porpoises in the North Sea (Vinther & Larsen, Reference Vinther and Larsen2004). Elevated levels of noise during the construction phase of offshore renewable energy developments have been demonstrated to disturb and displace harbour porpoises (e.g. Teilmann & Carstensen, Reference Teilmann and Carstensen2012; Dähne et al., Reference Dähne, Gilles, Lucke, Peschko, Adler, Krügel, Sundermeyer and Siebert2013) and harbour porpoises have been found to be less numerous in areas with heavy shipping traffic (Herr et al., Reference Herr, Gilles, Scheidat and Siebert2005). The EU Habitats Directive requires that strict protection measures are put in place for listed animal species (including harbour porpoises), prohibiting all forms of deliberate capture or killing, deliberate disturbance and deterioration or destruction of breeding sites or resting places. In addition, the Habitats Directive requires that measures are taken to maintain or restore a favourable conservation status for species of community interest (including the harbour porpoise). The harbour porpoise has experienced fluctuations in distribution (Hammond et al., Reference Hammond, Macleod, Berggren, Borchers, Burt, Cañadas, Desportes, Donovan, Gilles, Gillespie, Gordon, Hiby, Kuklik, Leaper, Lehnert, Leopold, Lovell, Øien, Paxton, Ridoux, Rogan, Samarra, Scheidat, Sequiera, Siebert, Skov, Swift, Tasker, Teilmann, Van Canneyt and Vázquez2013), and it is becoming increasingly important to understand how these fluctuations in distribution and changes in abundance may be linked to human activities. The construction of one of the world's largest offshore wind farms is planned for the Dogger Bank area, along with the development of the Hornsea offshore wind farm off the Yorkshire coast (south central North Sea), and several other offshore wind farms off East Anglia. Short and long term displacement of porpoises as a result of disturbance from piling noise has been demonstrated previously (Teilmann & Carstensen, Reference Teilmann and Carstensen2012; Dähne et al., Reference Dähne, Gilles, Lucke, Peschko, Adler, Krügel, Sundermeyer and Siebert2013). Harbour porpoises have been found at all times of year across all areas of the Dogger Bank (Todd et al., Reference Todd, Pearse, Tregenza, Lepper and Todd2009; Hammond et al., Reference Hammond, Macleod, Berggren, Borchers, Burt, Cañadas, Desportes, Donovan, Gilles, Gillespie, Gordon, Hiby, Kuklik, Leaper, Lehnert, Leopold, Lovell, Øien, Paxton, Ridoux, Rogan, Samarra, Scheidat, Sequiera, Siebert, Skov, Swift, Tasker, Teilmann, Van Canneyt and Vázquez2013; Geelhoed et al., Reference Geelhoed, van Bemmelen and Verdaat2014; this study), however, the waters to the south and south-west of the Dogger Bank appear from recent studies to have a very high density of porpoises. Given the importance of the Dogger Bank and surrounding waters to harbour porpoises year round, the UK Government is urged to implement measures to require that the risk of disturbance, from activities such as piling, is reduced in line with best practice elsewhere in Europe, such as Germany's noise limit (Umweltbundesamt, 2011), in order to minimize the potential for harm to and displacement of significant numbers of porpoises during marine developments within UK jurisdiction.
ACKNOWLEDGEMENTS
The MCR International team would like to thank the German, Dutch and Danish Governments for providing the diplomatic clearance for research to be conducted in their waters of the North Sea. Thanks to Steve Hunt from the British Foreign and Commonwealth Office for assisting with the permitting process. MCR International also thanks Dr Peter Evans (Sea Watch Foundation) and Dr Meike Scheidat (IMARES) for their assistance in identifying participants. Thanks also to Heidrun Frisch (ASCOBANS) for help with coordination. Meike Scheidat and Anita Gilles provided valuable support and advice during preparation, planning and fundraising for the survey and paper. We are grateful to Conor Ryan and Meike Scheidat for helpful comments made on an earlier draft of the manuscript. The survey team consisted of Richard McLanaghan (MCR), Jim Compton (MCR), Brian Morrison (MCR), Oliver Boisseau (MCR International), Jack Bloomfield (MCR), Anna Cucknell (MCR International), Susannah Calderan (MCR International), Danielle Gibas (Sea Watch Foundation), Katrin Lohrengel (Sea Watch Foundation), Lisette Mekkes (IMARES) and Tessa van Heumen (IMARES).
FINANCIAL SUPPORT
This survey was conducted with core funding from the International Fund for Animal Welfare (IFAW), and additional financial support and collaboration from ASCOBANS, IMARES-Wageningen UR and WWF-UK.