New York has been affected by various disasters in the 21st century, including hurricanes, flooding, and terrorist attacks. Its geographic location and topography make it vulnerable to other weather-related disasters, such as blizzards and ice storms. New York’s metropolitan centers and rural agricultural areas, manufacturing and refining facilities, and nuclear power plants are susceptible to terrorist attacks. New York City is a port of entry and destination for immigrants and travelers, raising concerns about infectious disease outbreaks.Reference Drummy, Bruner and Minutillo 1 Because disasters result in casualties, disaster preparedness should be a matter of importance to both urban and rural hospitals in New York.
However, there have been few studies to date, and most of these consist of post-disaster reports.Reference Powell, Hanfling and Gostin 2 - Reference Verni 4 No large scale studies were identified comparing community hospitals in urban areas with those in rural settings. Therefore, the purpose of this study was to assess and compare disaster preparedness among urban and rural hospitals across New York.
METHODS
A survey of hospital disaster preparedness coordinators was conducted using a 35-item questionnaire. This tool included items from the National Hospital Ambulatory Medical Care Survey (NHAMCS) Pandemic and Emergency Response Preparedness Supplement 2008 Panel and additional questions, including some derived from other survey tools.Reference Niska and Shimizu 5 - Reference Kaji, Langford and Lewis 8 Demographic questions were used to elicit information regarding the title and role of the respondent, the community hospital setting, and the hospital’s experience with disasters during the past 5 years.
An initial e-mail was sent to the chief executive officers (CEOs) at 207 of the 208 community hospitals in New York on February 1, 2017. This explained the study and requested that the CEOs forward the message to their disaster preparedness coordinators. The e-mail contained an embedded link to the survey questionnaire on Survey Monkey. A subsequent e-mail was sent to the CEOs on February 15, 2017. A simultaneous e-mail was sent to the disaster preparedness coordinators. On February 22, 2017, a final e-mail reminder was sent to the CEOs and disaster preparedness coordinators. Respondents received no incentives for participation.
Questionnaires were collected until March 21, 2017. Manual data abstraction was performed, and the data were analyzed using SPSS Statistics (Version 24) (IBM Corp, Armonk, NY). Six disaster preparedness elements were examined: disaster plan development, on-site surge capacity, available materials and resources, disaster education and training, preparedness funding levels, and perception of preparedness.
RESULTS
Eighty completed surveys were received, representing a 38.6% response rate. These included 48 urban hospitals (60.0%) and 32 rural hospitals (40.0%).
Disaster Plan Development
Hospitals were asked to rank the following disaster events in terms of the incident of most concern: natural disasters, epidemics/pandemics, explosive/incendiary accidents or attacks, biological accidents or attacks, chemical accidents or attacks, and nuclear/radiological accidents or attacks. A Mann-Whitney U test showed that the 2 hospital settings were significantly different in the ranking of chemical accidents or attacks, with rural hospitals (mean rank=30.39) ranking these incidents of greater concern than urban hospitals (mean rank=47.24), U=444.500, z=−3.303, P=0.001, r=−0.37. The two groups differed in the ranking of explosive/incendiary accidents or attacks, with urban hospitals (mean rank=36.09) considering these incidents of more concern than rural hospitals (mean rank=47.11), U=556.500, z=−2.123, P=0.034, r=−0.24.
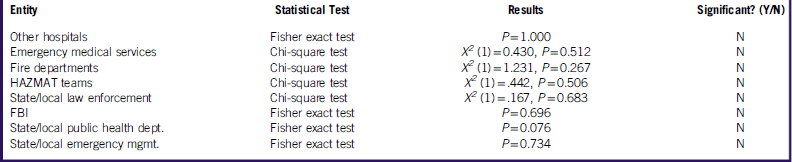
Hospitals in both settings engaged in cooperative planning with various outside entities (Table 1). They also addressed the following special populations issues: communication with deaf, blind, and non-English speaking patients; sheltering of mobility-impaired or technology dependent patients; pregnant women; patients with special health care needs; and mentally challenged patients.
Entities With Which Hospitals Engaged in Collaborative Planning–Hospital Setting

FBI=Federal Bureau of Investigation; HAZMAT= hazardous material.
Respondents rated the sufficiency of their hospital disaster plans on a scale of 1 (very insufficient) to 4 (very sufficient). Urban hospitals gave a mean sufficiency rating of 3.15 (SD=0.684), whereas rural hospitals reported a mean sufficiency rating of 2.91 (SD=0.390). Urban hospitals (mean rank=44.42) rated their disaster plans significantly more sufficient than did rural hospitals (mean rank=34.63), U=580.000, z=−2.358, P=0.018, r=−0.26.
On-Site Surge Capacity
Hospitals in both settings addressed the following aspects of on-site surge capacity: cancellation of elective procedures and admissions, isolation of multiple airborne disease patients in negative pressure rooms, establishment of alternate care areas, and setting up temporary care facilities. The odds of urban hospitals developing a written plan for the conversion of inpatient units to augment intensive care capacity were 5.15 times higher than for rural hospitals (Fisher exact test, P=0.002).
Both types of hospitals addressed the following pediatric surge capacity issues: tracking systems for accompanied and unaccompanied children, reunification of children with families, and supplies for sheltering healthy displaced children. However, the odds of urban hospitals developing pediatric surge capacity guidelines were 3.78 times higher than for rural hospitals (Fisher exact test, P=0.016), and the odds of urban hospitals having a protocol to rapidly identify and protect displaced children were 4.94 times higher than for rural hospitals (Fisher exact test, P=0.019).
There was no significant association between hospital setting and various aspects of staffing, operations, and mass casualty management. Respondents were asked to estimate their hospital surge capacity on a scale of 1 (0 to 5%) to 5 (greater than 20%). No significant differences were noted.
Available Materials and Resources
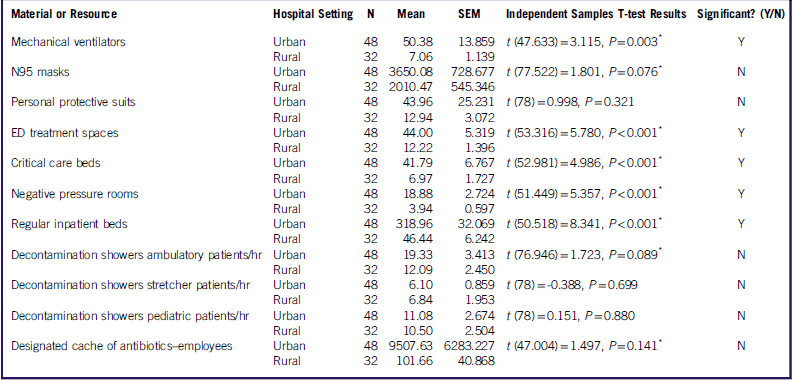
Respondents were asked to provide the quantity of various resources available in their hospitals in the event of a mass casualty incident. As noted in Table 2, urban hospitals have significantly more mechanical ventilators, emergency department (ED) treatment spaces, critical care beds, negative pressure rooms, and regular inpatient beds than do rural hospitals. There was no significant difference between hospitals in how long they could operate without external resources.
Available Resources for Mass Casualty Incidents–Hospital Setting

Abbreviations: ED = emergency department; SEM = standard error of the mean.
* Levene’s test was significant, thus equal variances were not assumed.
Disaster Education and Training
Urban hospitals participated in significantly more internal table-top exercises and full-scale simulations in collaboration with other organizations in 2016 than did rural hospitals. Both types of hospitals addressed the following scenarios: general disasters and emergency response, severe epidemics/pandemics, natural disasters, biological accidents or attacks, chemical accidents or attacks, explosive/incendiary accidents or attacks, decontamination procedures, and special populations. The odds of urban hospitals participating in nuclear/radiological accidents or attacks simulations and exercises were 5.54 times higher than for rural hospitals (chi-square test, X 2 [1]=5.470, P=0.019).
Disaster Preparedness Funding Levels
Respondents indicated the funding levels that their hospitals received through the federal Hospital Preparedness Program (HPP) for each of the previous 5 years (2012-2016), with the levels ranging on a scale from 0 (none) to 7 (more than $150,000). There were no significant differences in funding levels each year between urban and rural hospitals. Hospitals reported their satisfaction with funding levels on a scale from 1 (very dissatisfied) to 4 (very satisfied). Urban hospitals had a mean satisfaction rating of 2.28 (SD=0.852), whereas rural hospitals had a mean satisfaction rating of 2.56 (SD=0.619), which was not significantly different.
Perception of Disaster Preparedness
There was no significant association between hospital setting and perceived preparedness levels, on a scale from 1 (not prepared at all) to 5 (very well prepared), for natural disasters, epidemics/pandemics, biological accidents or attacks, chemical accidents or attacks, and nuclear/radiological accidents or attacks. There was a significant association between hospital setting and perceived preparedness for explosive/incendiary accidents or attacks, with urban hospitals (mean rank=45.29) perceiving themselves as better prepared than rural facilities (mean rank=33.31), U=538.000, z=−2.384, P=0.017, r=−0.27. Hospitals did not differ in their perception of the presence of the following barriers to preparedness: unfunded mandates, competing resources and spending priorities, time constraints, regulatory/accreditation compliance issues, and staff training.
DISCUSSION
The results show differences in disaster plan development, on-site surge capacity, available materials and resources, disaster education and training, and disaster preparedness perception between urban and rural community hospitals in New York. There are no differences in disaster preparedness funding levels.
Rural hospitals rank chemical accidents or attacks of higher concern than do urban hospitals. These disasters are not infrequent; the New York State Department of Environmental Conservation receives approximately 16,000 reports of release of toxic chemicals and other hazardous materials to the environment each year. 9 Although this may occur in any setting, much transport of chemicals occurs through rural regions of the state.
Urban hospitals are more likely to have a written plan for converting inpatient units to augment intensive care capacity. These facilities have more licensed beds (
 $\bar{x}$
=386.1) than do rural hospitals
 $(\bar{x}{\equals}70.1)$
, affording them the flexibility to convert inpatient units. Urban hospitals are more likely to develop protocols for increasing pediatric surge capacity. Rural hospitals may not always provide pediatric services, possibly due to a lack of pediatricians in the rural communities or because of the presence of a pediatric hospital in a nearby urban community. Therefore, rural hospitals will be unlikely to increase pediatric surge capacity when they do not have pediatric units to begin with.
Urban hospitals have significantly more mechanical ventilators, ED treatment spaces, critical care beds, negative pressure rooms, and regular inpatient beds. This, again, reflects the difference in size between urban and rural hospitals, which is related to greater population density in urban areas.
Urban hospitals participate in more internal table-top exercises and full-scale simulations with other organizations. Although the difference with regard to internal table-top exercises is unclear, urban hospitals may participate in more full-scale simulations due to the accessibility and location of partnering organizations in an urban setting. Urban hospitals are also more likely to participate in simulations and exercises that address nuclear/radiological accidents or attacks. A possible explanation is that a “dirty bomb” terrorist attack is more likely to occur in a populated (urban) area where it can do more damage.
Nearly all hospitals in the state receive the same amount of funding through the HPP. This amount was $40,000 per year from 2012 to 2014, and then dropped to $37,000 per year through 2016 with a decrease in funding for the program. A select number of academic hospitals designated as HPP regional training centers within the state receive additional amounts. During the 5-year time period (2012-2016), hospitals in the state designated as Ebola treatment centers also received additional HPP funds. Therefore, no significant difference in funding levels was identified between urban and rural hospitals.
Urban hospital respondents perceive themselves as being better prepared for explosive/incendiary accidents or attacks. The 9/11 terrorist attacks were incidents of this nature that impacted New York City hospitals, which may explain greater preparation by these hospitals, as well as facilities in other urban areas within the state.
There are limitations to the study. The survey did not address technological hazards, such as failures of communication and information technology systems. Hospitals were surveyed on funding received through the HPP only. Future studies may wish to consider funding from other sources because this may provide a different picture of preparedness funding and its perceived sufficiency. The available resources were not adjusted by the number of licensed beds at each hospital. Further analysis of these data in this fashion may show little or no differences in the number of available resources between urban and rural hospitals. Finally, this study of hospital setting and its relationship to disaster preparedness in New York represents the first known attempt to capture the dynamics between these variables. No comparisons to previous studies could be made to corroborate or refute the current findings.
CONCLUSIONS
These results show that differences exist in disaster preparedness among New York’s urban and rural community hospitals. This information is useful in several ways. The results may be compared with other studies that have evaluated hospitals across the nation or in individual states to determine whether New York’s urban and rural hospitals are more or less prepared for disasters than similar hospitals in other states. The findings enable New York hospitals to compare their preparedness with other hospitals in the state. Finally, the results provide information that assists government agencies and hospital associations in legislative and advocacy efforts to obtain more funding and other resources to improve disaster preparedness.
Conflict of Interest Statement
The authors declare no conflict of interests.