


1. INTRODUCTION
Intense laser beam interaction with solid surface has been investigated for many years, but it is still an attractive field (Chen et al., Reference Chen, Wilks, Bonlie, Liang, Myatt, Price, Meyerhofer and Beiersdorfer2009; Liu et al., Reference Liu, Zhang, Fu, Gu, Zhang, Liu, Xie, Liu and He2010; Okamuro et al., Reference Okamuro, Hashida, Miyasaka, Ikuta, Tokita and Sakabe2010; Wang et al., Reference Wang, Liu, Cai, Wang, Liu, Xia, Deng, Xu, Leng, Li and Xu2010) because more and more novel phenomena are discovered. It is used in processing of materials via pulsed laser ablation and has wide spread applications in such as particle beam generation (Bin et al., Reference Bin, Lei, Yang, Huang, Yu, Yu and Tanaka2009), medical therapy (Linz & Alonso, Reference Linz and Alonso2007; Yogo et al., Reference Yogo, Sato, Nishikino, Mori, Teshima, Numasaki, Murakami, Demizu, Akagi, Nagayama, Ogura, Sagisaka, Orimo, Nishiuchi, Pirozhkov, Ikegami, Tampo, Sakaki, Suzuki, Daito, Oishi, Sugiyama, Kiriyama, Okada, Kanazawa, Kondo, Shimomura, Nakai, Tanoue, Sasao, Wakai, Bolton and Daido2009), laser-induced nuclear reactions (Renner et al., Reference Renner, Juha, Krasa, Krousky, Pfeifer, Velyhan, Granja, Jakubek, Linhart, Slavicek, Vykydal, Pospisil, Kravarik, Ullschmied, Andreev, Kampfer, Uschmann and Forster2008; Torrisi et al., Reference Torrisi, Margarone, Laska, Krasa, Velyhan, Pfeifer, Ullschmied and Ryc2008), diagnostics for laser-plasma interaction (MacKinnon et al., Reference Mackinnon, Patel, Town, Edwards, Phillips, Lerner, Price, Hicks, Key, Hatchett, Wilks, Borghesi, Romagnani, Kar, Toncian, Pretzler, Willi, Koenig, Martinolli, Lepape, Benuzzi-Mounaix, Audebert, Gauthier, King, Snavely, Freeman and Boehlly2004), laser-driven ion accelerators (Badziak et al., Reference Badziak, Woryna, Parys, Platonov, Jabłonski, Ryc, Vankov and Wołowski2001; Krushelnick et al., Reference Krushelnick, Najmudin and Dangor2007; Malka et al., Reference Malka, Faure, Gauduel, Lefebvre, Rousse and Phuoc2008; Mangles et al., Reference Mangles, Walton, Najmudin, Dangor, Krushelnick, Malka, Manclossi, Lopes, Carias, Mendes and Dorchies2006), proton radiography and imaging (Borghesi et al., Reference Borghesi, Campbell, Schiavi, Willi, Mackinnon, Hicks, Patel, Gizzi, Galimberti and Clarke2002; Breschi et al., Reference Breschi, Borghesi, Campbell, Galimberti, Giulietti, Gizzi, Romagnani, Schiavi and Willi2004; Cobble et al., Reference Cobble, Johnson, Cowan, Renard-Legalloudec and Allen2002), fast ignition in inertial confinement fusion (Roth et al., Reference Roth, Cowan, Key, Hatchett, Brownl, Fountain, Johnson, Pennington, Snavely, Wilks, Yasuike, Ruhl, Pegoraro, Bulanov, Campbell, Perry and Powell2001), and thin film deposition (Caridi et al., Reference Caridi, Torrisi, Margarone and Borrielli2008; Wang et al., Reference Wang, Xu, Zhou, Chu and Fu2007). For the preparation of thin film containing nanoscale structures (e.g., nanoparticles, nanowires, nanotubes) by using ns-pulsed laser deposition (PLD), a high-energy laser beam focused on a target induces the heating, melting, evaporation of a thin layer of the irradiated material (Aghaei et al., Reference Aghaei, Mehrabian and Tavassoli2008), and thus the formation of plasma associated with the production of particle emission in front of the target (Alti & Khare, Reference Alti and Khare2006; Trusso et al., Reference Trusso, Barletta, Barreca, Fazio and Neri2005; Wang et al., Reference Wang, Xu, Zhou, Chu and Fu2009). The charged ions with energies between tens and hundreds of eV (Schmid et al., Reference Schmid, Lenauer, Buchsbaum, Wimmer, Rauchbauer, Scheiber, Betz and Varga2009) collide with ambient gas, and produce the charged nanoscale structures by the condensation process (Hirasawa et al., Reference Hirasawa, Orii and Seto2006; Muramoto et al., Reference Muramoto, Sakamoto, Nakata, Okada and Maeda1999; Seto et al., Reference Seto, Kawakami, Suzuki, Hirasawa and Aya2001, Reference Seto, Orii, Hirasawa and Aya2003), and finally are deposited on the substrate to form the thin film.
Although PLD has been used to fabricate nanoscale structures for more than 10 years (Umezu et al., Reference Umezu, Takata and Sugimura2008; Werwa et al., Reference Werwa, Seraphin, Chiu, Zhou and Kolenbrander1994), it is still difficult to carry out the controllable preparation as we expect. Only when the formation dynamics is clarified, can we obtain the nanoscale structures we want. Numerous earnest efforts have been made to understand the formation dynamics, but some basic, yet significant problems are not entirely clear. For a typical example, in what quantitative conditions can the nanoscale structures form? Thus, where and how do the nanoscale structures form? As already known, during the formation of nanoscale structures, nucleation and growth are always two crucial processes that we can not parry (Morales & Lieber Reference Morales and Lieber1998; Yan et al., Reference Yan, Cingarapu, Klabunde, Chakrabarti and Sorensen2009). Morales and Lieber (Reference Morales and Lieber1998) skillfully prepared Si and Ge nanowires by vapor-liquid-solid growth on the basis of pulsed laser ablation nucleation in a quartz tube. Their nanowire formation model revealed that the nucleation occurs due to hot vapor condensation as the ablated species cool through collisions with the background gas, and the growth begins when the temperature and Si/Ge density get to their critical values and maintains until these conditions cannot be met. This idea can be extended to the nucleation and growth of nanoscale structures with other configurations in various preparation methods. To explain the experimental result that Ne gas induces the smallest and most uniform Si nanoparticles (np-Sis, i.e., Si nanograins, nanocrystals, nanoclusters or quantum dots) among He, Ar, and Ne, we proposed a qualitative model (Fu et al., Reference Fu, Wang, Chu, Zhou, Yu, Han and Peng2005), which indicated that for ns-PLD, there are three regions, labeled “high energy region,” “nucleation region” (NR), and “transporting region.” The mean size and size-consistency of np-Sis depend on the width of NR where the nucleation and growth occur. With the modification that the metal atoms can bond with the background gas, our model was extended to organometallic complexes formation by laser ablating transition metals in ethylene (Phillips & Shivaram, Reference Phillips and Shivaram2009). Obviously, the determination of the NR during PLD is very helpful to quantitative clarification of the formation conditions for nanoscale structures. As a model material, the nucleation location and growth process of np-Si are investigated in this article due to its unique properties, e.g., light emission by quantum confinement, single electron transport such as Coulomb blockade and photonic band gap crystals.
2. EXPERIMENTAL DETAILS
The discussed NR is in the one-dimensional range in the axial direction. To study the information on the location of np-Si nucleation and growth, we placed the deposition substrates under the plasma and in horizontal direction (Fig. 1), which is different from the conventional PLD setup. This design, moreover, can avoid the influence of the substrate in conventional PLD system on the NR due to the oscillation of mixed region (Wang et al., Reference Wang, Li and Fu2006). Although the formed np-Si moves as a simple horizontal projectile motion from the NR to the substrate, we can not ascertained NR by PLD dynamics calculation based on the experimental data about the np-Sis without the slowing coefficient and the initial velocity of ablated particles (Yoshida et al., Reference Yoshida, Takeyama, Yamada and Mutoh1996). Noted that the simultaneous determination of the NR location and these unknown parameters needs three dynamics equations, an external electric field is introduced perpendicularly to the plume (Fig. 1). The introduced field with appropriate direction can make np-Sis get to substrates more quickly because np-Sis are positively charged (Muramoto et al., Reference Muramoto, Sakamoto, Nakata, Okada and Maeda1999; Seto et al., Reference Seto, Kawakami, Suzuki, Hirasawa and Aya2001, Reference Seto, Orii, Hirasawa and Aya2003; Hirasawa et al., Reference Hirasawa, Orii and Seto2006). Three electric fields for various voltages can induce three PLD dynamics equations, from which the location of NR, the slowing coefficient, and the initial velocity can be determined.
The schematic diagram of the experiment used to determine the nucleation region in pulsed laser ablation.
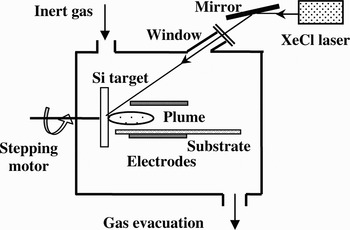
In our PLD apparatus (Fig. 1), Lambda Physik XeCl excimer laser (wavelength 308 nm, laser fluence 4 J/cm2, pulse duration 15 ns, repetition rate 1 Hz) was used. The resistivity of single crystalline Si target was 3000 Ω·cm. An electric field was applied by a direct current voltage between parallel aluminum electrodes placed perpendicularly to the target surface. The distance between the electrodes was 40 mm, and they were positioned from 1 to 55 mm at the right of the target surface. Different voltages of 50 V, 100 V, and 200 V were applied to the two electrodes. A series of single crystalline (111) Si or glass slices substrates were placed on the bottom electrode. Ar gas in a vacuum chamber was kept at a constant pressure of 10 Pa. The typical deposition time was 10 min. Scanning electron microscopy (SEM; FEI Sirion XL30), Raman (MKI-2000), and X-ray diffraction (XRD; Rigaku D/Max) were employed to characterize the microstructural properties of the films.
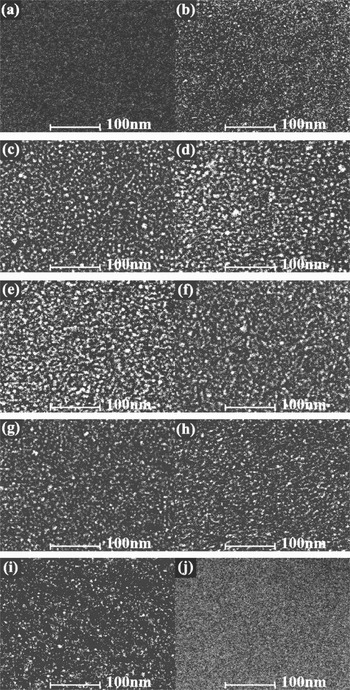
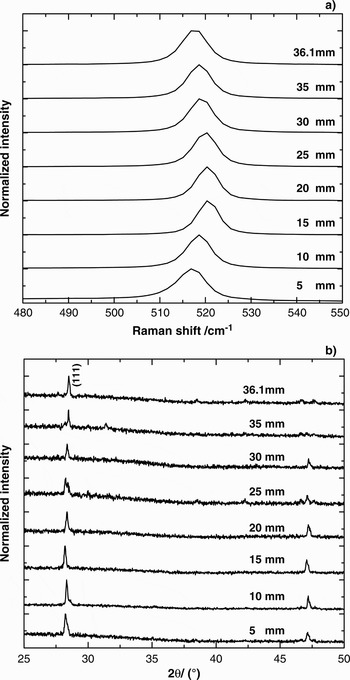
The SEM images of the films prepared under 50 V, 100 V, and 200 V for the typical lateral distances from Si target are shown in Figures 2, 3, and 4, respectively. In Figure 2a–2j correspond to the various lateral distances of 4.5 mm, 5 mm, 10 mm, 15 mm, 20 mm, 25 mm, 30 mm, 35 mm, 36.1 mm, and 36.5 mm, respectively. Obviously, no np-Sis can be seen in Figures 2a and 2j, all the films located at 5–36.1 mm contain np-Sis, that is to say, 5 mm and 36.1 mm are, respectively, the distance that np-Sis appear (starting distance) and the distance that np-Sis disappear (ending distance) on the substrate. Figures 3 and 4 shows that the starting-ending distances on the substrate are, respectively, 3.6–35.5 mm and 2.5–34.9 mm for 100 V and 200 V. It is obvious that 100 V and 200 V induce the smaller starting and ending distances than 50 V. The mean size and area density of np-Sis in the films located at various lateral distances can be obtained from statistic operation, as the squares for 50 V, the circles for 100 V and the uptriangles for 200 V are shown in Figure 5a and 5b, respectively. Obviously, both the mean size and area density of np-Sis first increase to a maximum at about 20 mm and then decreases with the increase of lateral distance. The corresponding Raman spectra of the films prepared under 50 V are demonstrated in Figure 6a, in which the peaks in the vicinity of 520 cm−1 indicate that the grains appearing in Figures 2b–2i are nanocrystalline. Additionally, with increasing lateral distance, the Raman peaks first right-shift and then left-shift, implying that the grain size varies as indicated in SEM images, which can be further confirmed by the width variation of (111) crystalline peaks in Figure 6b, XRD spectra of the films under 50 V. It should be emphasized that the observed lateral dependence of nanoparticle deposition can be used for the size selection of nanoparticles.
SEM images of the Si films deposited by pulsed laser ablation in 10 Pa Ar gas under the dc voltage of 50 V. Where (a), (b), (c), (d), (e), (f), (g), (h), (i), and (j) correspond to the various lateral distance from Si target of 4.5 mm, 5 mm, 10 mm, 15 mm, 20 mm, 25 mm, 30 mm, 35 mm, 36.1 mm, and 36.5 mm, respectively.

SEM images of the Si films deposited by pulsed laser ablation in 10 Pa Ar gas under the dc voltage of 100 V. Where (a), (b), (c), (d), (e), (f), (g), (h), (i), and (j) correspond to the various lateral distance from Si target of 3 mm, 3.6 mm, 8.5 mm, 13.5 mm, 18.5 mm, 23.5 mm, 28.5 mm, 33.5 mm, 35.5 mm, and 36 mm, respectively.

SEM images of the Si films deposited by pulsed laser ablation in 10 Pa Ar gas under the dc voltage of 200 V. Where (a), (b), (c), (d), (e), (f), (g), (h), (i), and (j) correspond to the various lateral distance from Si target of 2 mm, 2.5 mm, 7.5 mm, 12.5 mm, 17.5 mm, 22.5 mm, 27.5 mm, 32.5 mm, 34.9 mm, and 35.3 mm, respectively.
(Color online) The experimental data (symbols) and theoretical results (curves) about the mean size (a) and area density (b) of Si nanoparticles in the films located at various lateral distances. The squares, the circles, uptriangles correspond to the experimental results for 50 V, 100 V, and 200 V, respectively. The solid, dashed and dotted curves correspond to the theoretical results for 50 V, 100 V, and 200 V, respectively.

The Raman spectrum (a) and XRD spectrum (b) of Si films deposited by pulsed laser ablation in 10 Pa Ar gas under the direct current voltage of 50 V.
3. THEORETICAL MODEL AND CALCULATION
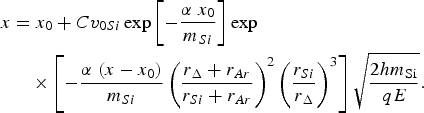
Figure 7 demonstrates the formation and propagation of np-Sis. The ablated particles (Si atoms and so on) with the initial velocity of v 0Si are ejected from the surface of the Si target when the pulsed laser ablates Si target and they gradually release their kinetic energy (corresponding velocity v Si) by colliding with ambient atoms. Most ablated particles are distributed in plume where the axis located at h (20 mm) from the substrate, and they are agglomerated to form np-Sis with velocity of v Δ at x 0 in NR. Because the NR is above the substrates, the np-Sis formed in NR is deposited on the substrates after undergoing “horizontal projectile motion” under gravity. It is believed that the formed np-Sis are positively charged, here the electric quantity q = +e is assumed (Seto et al., Reference Seto, Orii, Hirasawa and Aya2003), in which e is the electrical elementary charge. Thus, when the electric field E = U/(2h) is applied, the motion of np-Sis in the field is horizontal projectile-like, where U denotes the voltage between the two electrodes. The calculation shows that compared with the electric field force, gravity can be ignored in our work. It is natural that 100 V induces the smaller starting and ending distance than 50 V and the smallest starting and ending distances take place at 200 V. According to the inertia fluid model proposed by Yoshida et al. (1999), v Si = v 0Siexp(−αx 0/m Si), in which m Si is the mass of Si atom and α = BSρ/2 is the slowing coefficient, B is the proportional constant, S = π(r Si+ r Ar)2 is the cross-section, and ρ denotes the ambient gas density. It is supposed that m Δv Δ2/2 = C 2(m Siv Si2)/2 and m Si/m Δ = (r Si/r Δ)3, where C is the energy transformation coefficient, m Δ is the mass of the nanoparticles, r Si and r Δ are the radii of the Si atom, and the formed np-Si, respectively. In the horizontal direction, the formed np-Sis at x 0 are exerted a resistance by the ambient, with a similar form to Si atom except for the cross-section of π(r Δ + r Ar)2. Based on the dynamic equation of horizontal projectile in the electric field E, the position x of np-Si deposited on the substrate can be obtained by
The schematic diagram for the formation and propagation of Si nanoparticles.

For np-Si, when x (the distance on the substrate) is measured, the corresponding x 0 (the distance in the NR) can be determined by Eq. (1). From m Δv Δ2/2 = C 2(m Siv Si2)/2, np-Si with small size can obtain big horizontal velocity, thus it is reasonable that the np-Sis at ending position on the substrate are from the ending position of NR. Because the staring position on the substrate is quite near to the Si target, we think that this position corresponds to the staring position in NR. Namely, according to the staring and ending positions on the substrate obtained in the experiment, we can gain the staring and ending positions of NR based on Eq. (1). From Figure 5a, we know the ending positions on the substrate are, respectively, 36.1 mm, 35.5 mm, and 34.9 mm, and the size r Δ of np-Si are, respectively, 4.35 nm, 4.52 nm, and 4.88 nm, for 50 V, 100 V, and 200 V, which determines the ending position of NR is 33.8 mm, and the parameters α = 1.09 × 10⁻²⁴ kg/m, Cv 0Si = 1641 m/s. Similarly, the starting position of the NR is calculated as 0.1 mm with the same parameters α and Cv 0Si. In our calculation, m Si = 4.67 × 10⁻²⁶ kg, r Si = 1.46 Å and r Ar = 0.88 Å are used. In a word, the ablation with laser pulses of 4 J/cm2 in 10 Pa Ar gas can form a NR ranging from 0.1 mm to 33.8 mm.
In NR from 0.1 mm to 33.8 mm, the mass m Δ of np-Si formed at various position x can be supposed as
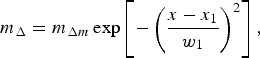
which indicates that the size of the formed np-Si first increases to a maximum m Δm at x 1 and then decreases with increasing x, where w 1 decides the mass-changing rate. Similarly, the number N Δ of np-Si formed at various position x can be given as
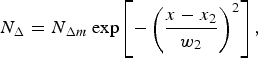
which reflects the nucleation probability of Si particles in the gas phase. Incorporated with Eq. (1), the mean size and area density of np-Sis on the substrate at various lateral distances, appended in Figure 5, are obtained by numerical simulation and statistic calculation. The solid, dashed, and dotted curves in Figures 5a and 5b, respectively, correspond to the results for 50 V, 100 V, and 200 V. Obviously, the theoretical results perfectly depict the varying behavior found in the experiment. More importantly, some crucial quantities in Eqs. (2) and (3) are obtained in the simulation, i.e., m Δm = 10060m Si, x 1 = 14.9 mm, w 1 = 13.4 mm, N Δm = 1510, x 2 = 15.8 mm, w 2 = 14.7 mm, which quantitatively gives some pictures on the NR: The ejected Si atoms cannot gather into nanoparticle before x = 0.1 mm. 498 nanoparticles with mass of 3176m Si (size of ~4.9 nm obtained by the first-principle calculation) are produced while the nucleation conditions are satisfied in the starting position of NR. With the increase of the axial distance from Si target, more np-Sis are formed, the number of Si nanoparticles increases to a maximum 1510 at 15.8 mm and then gradually decreases to 330 at the ending position of nucleation. The mass or size of the formed np-Si versus the axial distance possesses the similar varying tendency except for the peak position of 14.9 mm. The mass of np-Sis in the peak location and the ending position is 10060m Si (~7.3 nm) and 1790m Si (~4 nm), respectively.
4. CONCLUSIONS
A picture on the formation dynamics of nanoscale structures (e.g., nanoparticles) with the size and configuration we expect is very important to a controllable preparation method. Especially, it is crucial to quantitatively depict the nucleation location and growth process during nanoscale structure preparation. In this article, the location of nucleation region for Si nanoparticles formed during pulsed laser ablation in an ambient gas was determined based on the transportation dynamics at different electric fields corresponding to 50 V, 100 V, and 200 V through a special setup of the substrate parallel and applied electric field perpendicular to the plume. In the typical deposition conditions (laser fluence 4 J/cm2, ambient Ar pressure 10 Pa), the nucleation region locates at (0.1 mm, 33.8 mm) away from Si target. Further theoretical simulation for the mass and area density of Si nanoparticles on the substrate indicates that both nucleation and growth probabilities in the nucleation region are approximately Gauss-dependent of the lateral distance. This may pave a way for effectively determining the nucleation region and thus investigating the nucleation conditions for nanoparticles of Si as well as other materials formed in gas phase.
In many previous publications, the location of nucleation region for Si nanoparticles induced by a single-pulse was determined mainly by using charge-coupled device (CCD) techniques (Muramoto et al., Reference Muramoto, Inmaru, Nakata, Okada and Maeda2000; Nakata et al., Reference Nakata, Muramoto, Okada and Maeda2002). According to our previous work (Wang et al., Reference Wang, Xu, Zhou, Chu and Fu2007), for the repetition rate of 1 Hz, the ambient restoration is nearly finished before the subsequent pulse ablates Si target, the dynamic process corresponding to the latter pulse is hardly affected by the background remained by the former pulse. Thus SEM images obtained in this experiment can be thought to be from the superposition effect of the multi-pulses. In this meaning, CCD result has the same order of magnitude with our data. The difference may be from the limit of time-response and resolving power of CCD.
The detailed nucleation and growth process, including the nucleation conditions of vapor density and velocity in the nucleation region, are complicate so that the further discussion is expected in the future work.
ACKNOWLEDGMENTS
The authors thank Professors B. T. Liu and Q. X. Zhao for the useful discussion. This work was supported by the NSFC (10774036), the NSF of Hebei Province (E2008000631) and foundation of Hebei University. The anonymous referee's critical suggestions are acknowledged.



