Citizens, by necessity, economize their attention to public affairs. The political world dispenses an overload of information—biographies, events, arguments—that is in constant competition with the demands of everyday life. Although we might wish for facts about policy to be the “currency” of democratic citizenship (Delli-Carpini and Keeter Reference Delli-Carpini and Keeter1996, 8–11), it is well established that voters are more likely to trade in shortcuts, assumptions, and cues (e.g., Cohen Reference Cohen2003; Conover and Feldman Reference Conover and Feldman1989; Iyengar and Valentino Reference Iyengar, Valentino, Lupia, McCubbins and Popkin2000; Kam Reference Kam2005; Lupia Reference Lupia1994).
When it comes to forming impressions about candidates, one prominent cue is the candidate's race. After all, racial information is absorbed reflexively; it is among the three “primary” demographic characteristics (the others being gender and age) that the mind encodes in an “automatic and mandatory fashion” (Kurzban, Tooby, and Cosmides Reference Kurzban, Tooby and Cosmides2001, 15387; see also Hamilton and Sherman Reference Hamilton, Sherman, Wyer and Srull1994; Sherman, Castelli, and Hamilton Reference Sherman, Castelli and Hamilton2002). In many circumstances, it is easy to learn what a candidate's race is, since the information can be conveyed instantly by a photograph in the newspaper, campaign literature, on television, or even by way of certain characteristic names (cf. Bertrand and Mullainathan Reference Bertrand and Mullainathan2004). Moreover, for better or worse, racial cues might be diagnostic of what a candidate is likely to do in office, since they correlate with policy stances (e.g., Gurin, Hatchet, and Jackson Reference Gurin, Hatchet and Jackson1989; Williams Reference Williams and Barker1990). Particularly, the perception that blacks—our main focus in this article—tend to have progressive views on a number of political issues has “more than a grain of truth” (Sigelman et al. Reference Sigelman, Sigelman, Walkosz and Nitz1995, 249; see also Jussim et al. Reference Jussim, Cain, Crawford, Harber, Cohen and Nelson2009; Swain Reference Swain1993), raising the possibility that a black candidate's race will influence voters' expectations about him or her.
Precisely because stereotypes are a fact of life, it is important to understand how difficult it is to surmount them. Nearly everyone would prefer that candidates be judged according to the qualifications they accumulate, the character they exhibit, and the stances they take, rather than the identities they are born into. And perhaps it is so, at least to a substantial degree. After all, racial cues are easy for voters to acquire, but so are other cues such as partisan and ideological labels. Moreover, it has been shown outside the context of racial politics that although some information heuristics exert substantial influence when placed in isolation, they guide perceptions to a much lesser extent when even a small amount of more relevant information is available (Bullock Reference Bullock2011). The existence of racial cues is far less troubling if a modicum of more pertinent information can neutralize citizens' tendency to draw assumptions based on race.
Here, we put a spotlight on the interaction between racial cues and information that routinely arises in campaigns: candidates' partisan and ideological leanings.Footnote 1 Most citizens have limited understanding of politics and policy details (Converse Reference Converse and Apter1964; Delli-Carpini and Keeter Reference Delli-Carpini and Keeter1996). Instead, they often rely on information shortcuts to form opinions about candidates, with party and ideological labels being among the most useful cues available (Cohen Reference Cohen2003; Iyengar and Valentino Reference Iyengar, Valentino, Lupia, McCubbins and Popkin2000; Rahn Reference Rahn1993). Thus, a candidate's partisan or ideological identity is among the first bits of information likely to be acquired when contemplating a vote choice. And yet surprisingly little is known about the interplay between racial and ideological (or partisan) cues. As we review below, previous work generates contrasting expectations about whether one cue should render the other inert.
We take up this topic with a randomized experiment that has several advantages over past studies. First, where past related work has relied substantially on convenience samples, we employ a diverse national sample. Second, we manipulate these cues with simulated television advertisements, an approach designed to realistically mimic the way such cues might be conveyed in a low-salience election. Third, where past work has mostly put aside counterstereotypical candidates (e.g., a black conservative), our design focuses on them in order to more directly test how countervailing signals are resolved. Fourth, we pay particular attention to the possibility that some stereotypes are more crystallized than others, thus making them more or less difficult to disarm.
Our primary finding is that cues about a candidate's race and partisan (or ideological) leanings have very different effects depending on what evaluation is at hand. Unlike previous research, we highlight the conditions under which the impact of race might be minimized or exacerbated, based on the information available and the evaluation at hand. When it comes to the effect of race on citizens' perceptions of a candidate's ideology, we find that black candidates are assumed to be more liberal than whites, although the effect is notably small and disappears when explicit party/ideological information is available. When it comes to more specific stereotypes—how black candidates will behave with respect to various issues—effects are: (1) much larger, at least for some issues, but also (2) contingent on what additional information is available. In particular, we find that black candidates can neutralize the assumption that they will enact liberal policies as concerns non-racialized aspects of social welfare policy. But it is much more difficult for them to overturn a racialized assumption: that they will prioritize aid to minorities while in office.
In what follows, we draw on stereotyping and information processing literatures to derive hypotheses about how racial cues and ideological (or partisan) information might interact with each other. We find at least three plausible models to emerge from this work, and conduct an experimental test on a national sample to adjudicate among them. Our test finds evidence consistent with the idea that racial stereotypes function much like heuristics: they loom large when other information is lacking, but their influence often diminishes when more diagnostic information is present. In several cases, the effect of the racial stereotype becomes indistinguishable from zero. However, for a racialized issue (aid to “inner city families”), stereotypes are particularly difficult to overcome. In our final set of empirical analyses, we test an extension of our model to determine whether politically engaged citizens are the most responsive to additional information regarding a candidate's partisan or ideological identity.
RACIAL STEREOTYPES IN CANDIDATE EVALUATION
The word “stereotype” often carries a negative connotation, as stereotypes frequently refer to stigmatized characteristics and are seen as symptomatic of prejudice (e.g., “Blacks are lazy”). That said there is nothing inherently pejorative about a stereotype. “Basketball players are tall” is a stereotype, as is “Ivy League graduates are smart.” Stereotypes, by one definition in the psychological literature, are simply “beliefs about groups” (Jussim Reference Jussim and Matsumoto2009, 520) and differ from prejudice in that they do not necessarily have attitudinal or affective content.Footnote 2 For better or worse, stereotyping is a reflexive part of human social life. Humans need categories to find sense and regularity amidst the complexity of the world (Allport Reference Allport1954; Lippmann Reference Lippmann1922). Perhaps because predictions about how other people will behave are so valuable, the proclivity to sort individuals into groups has a particularly reflexive and automatic flavor (Devine Reference Devine1989; Tajfel Reference Tajfel1981; Taylor Reference Taylor and Hamilton1981).
There is ample room for racial cues to influence white voters' impressions of political candidates in the more neutral way we hint at above. Voters typically acquire little information about candidates in low-salience elections. As such, subtle factors can have large effects (e.g., Banducci et al. Reference Banducci, Karp, Thrasher and Rallings2008; Koppell and Steen Reference Koppell and Steen2004; Mattes et al. Reference Mattes, Spezio, Kim, Todorov, Adolphs and Alvarez2010; Miller and Krosnick Reference Miller and Krosnick1998). The association between blacks and political liberalism is widespread in the public mind (Campbell, Green, and Layman Reference Campbell, Green and Layman2011; Schneider and Bos Reference Schneider and Bos2011; see also the Supporting Information, Section 2). As such, voters might expect a black candidate to enact policies associated with liberalism. Whether or not this is a good thing will depend on each voter's taste for liberalism.
Understanding whites' inferences about black candidates is important because whites commonly evaluate black candidates. It is well known that black members of Congress are most likely to represent districts with substantial numbers of minority voters. Still, a substantial proportion of these members' constituencies are white; from our calculation, the districts of black members of Congress in 2014 were 40% white and 47% black.Footnote 3 What's more, these figures do not account for numerous times in which a black congressional candidate was defeated, at either the primary or general election stage. Beyond Congressional elections, white citizens may evaluate black candidates for any number of mayoral, city council, and state legislative elections (cf. Grofman and Handley Reference Grofman and Handley1989; Hajnal Reference Hajnal2006; Lieske and Hillard Reference Lieske and Hillard1984). In other words, in the real world, these types of low-salience elections wherein white citizens are asked to evaluate black candidates are not as rare as one might think.
A HEURISTIC MODEL OF CANDIDATE INFERENCE
Although stereotypes might play a significant role in how voters evaluate minority candidates, there are a number of plausible models for how they could shape the inferences voters make. Here, we describe what we term a Heuristic Model of candidate inference. Then, we describe two alternative models. Table 1 outlines the expectations we develop, highlighting how they differ from each other.
Theoretical expectations for three models of stereotyping

Note: The cells show predictions for the effect of changing a candidate from white to black.
The Heuristic Model assumes that voters are meaningfully constrained—either by resources or motivation—in their ability to acquire information about political candidates. They want their judgments to be accurate, but frequently will not engage in an exhaustive information search to make them so. As such, they will rely on whatever readily accessible information is most diagnostic for the evaluation at hand (Biernat Reference Biernat2005, 80; Crawford et al. Reference Crawford, Jussim, Madon, Cain and Stevens2011, 530; Kunda and Thagard Reference Kunda and Paul1996, 291).Footnote 4 Thus, the utility of any particular piece of information will depend on the nature of the evaluation. Seeing a person wear an Earth Day t-shirt might be moderately diagnostic of her political preferences, but minimally diagnostic of her exercise habits. Whatever one might have inferred about such a person's political preferences, that inference would be trumped by subsequently noticing that she wears a button in support of one political party or the other, as this would be a more direct cue.
When it comes to evaluations of political candidates, we see racial cues as indirectly diagnostic, since they relate to behavior in office probabilistically. A black candidate might be more likely to pursue liberal policies in office, but the link is not one of logical necessity. After all, there have been several examples of conservative black candidates. In contrast, explicit partisan and ideological information is directly diagnostic. This is because party and ideological labels are political in nature, but also because a perception that violates the stereotype would be more concretely illogical: for a voter to report that a candidate stipulated to be liberal and a Democrat is in fact conservative is, in a clear sense, a contradiction.Footnote 5
The Heuristic Model of candidate inference says that directly diagnostic cues, if they are available, should swamp the indirect ones. Thus,
H1: In the absence of a partisan or ideological cue, voters will perceive a black candidate to be more liberal than a comparable white candidate. But when explicit partisan and ideological information is available, this more diagnostic information's influence will neutralize the racial cue.
The psychological literature has borne this pattern out in several notable ways. Men are stereotyped to be more assertive than women, but when both a man and a woman interrupt a third party, they are perceived as equally assertive (Locksley et al. Reference Locksley, Borgida, Brekke and Hepburn1980). Similarly, when evaluated in a vacuum, black law school applicants are stereotyped as less intelligent and competent than whites; but this difference vanishes when attention is drawn to (identically) weak academic credentials (Linville and Jones Reference Linville and Jones1980). Importantly, the diagnostic information need not be exceptional in terms of quantity or quality. Even a single individuating action is often enough to neutralize stereotype-driven inferences (Kunda and Thagard Reference Kunda and Paul1996, 292, for a number of examples). There has been some speculation about related patterns in political contexts, too. Highton (Reference Highton2004) finds little support for the notion that white voters discriminate against black candidates. Yet he notes that his findings may be limited by the electoral context of general elections wherein partisanship and ideology are likely to “dominate voters' ballot decisions” (15). What's more, he goes on to speculate about a primary election, where “absent other cues, a candidate's race could play a more substantial role” (15). Thus, when it comes to candidate evaluations, group-based cues can dominate political evaluations (as in Cohen Reference Cohen2003), but even a small amount of policy-based information dampens this tendency markedly (Bullock Reference Bullock2011). Racial dynamics have not, to our knowledge, been approached through this framework.
ALTERNATIVE MODELS FOR CANDIDATE INFERENCE
The Heuristic Model has a strong grounding in psychology research, but its predictions are not foreordained. At least two reasonable perspectives generate contrasting expectations. Consider first economic models of racism and discrimination. Here, rational actors would like to judge candidates in terms of characteristics that are difficult to observe, such as reliability and productivity or, for our purposes, policy intentions. Because individuals' traits cannot be observed directly, it is rational to base one's expectation on the known (or believed) tendencies of a broader group. In this way, stereotyping reduces to a straightforward application of Bayesian updating (Arrow Reference Arrow and Pascal1972; Jussim et al. Reference Jussim, Cain, Crawford, Harber, Cohen and Nelson2009, 215).
Such a framework implies a different relationship between racial and partisan or ideological cues than the Heuristic Model. Instead of racial cues having prominent effects in some circumstances that are neutralized in other circumstances, the Bayesian model implies that, holding other factors constant, changing a candidate from white to black will always cause him to be perceived as more liberal. This implication follows directly from the perception that blacks, as a group, are on average more liberal than whites.
As a second alternative, consider work on the existence of stereotype “subtypes” (Brewer Reference Brewer, Srull and Wyer1988; Hamilton and Sherman Reference Hamilton, Sherman, Wyer and Srull1994; Taylor Reference Taylor and Hamilton1981). It has been argued that, upon encountering stereotype-defying individuals, people often resist revising the general stereotype. Instead, they construct subcategories that explain the exception to the general rule. For instance, the subcategory “black businessmen” is associated with a number of characteristics that diverge from those associated with the more general category “blacks” (Devine and Baker Reference Devine and Baker1991).
As we interpret it, the subtyping framework applies differently to a Democratic candidate than to a Republican candidate. For a Democratic candidate, similar expectations to the Bayesian framework are generated. In other words, Democratic black candidates are not a subtype; they conform to the superordinate category, and thus the strong association between blacks and liberalism will cause a black candidate to be perceived as more liberal than an equivalent white candidate. However, the subtyping framework has a novel expectation for black Republicans, since counterstereotypical subtypes often exhibit a contrast effect. As Kunda and Thagard write, “[i]ndividuating information suggesting a counterstereotypic trait leads targets to be viewed as particularly extreme on that trait” (Reference Kunda and Paul1996, 293). For instance, studies that compare blacks and whites with identically excellent academic credentials find blacks to be perceived as more competent than whites (e.g., Jackson, Sullivan, and Hodge Reference Jackson, Sullivan and Hodge1993). Blacks who are described as hard working are viewed more favorably than whites that are described as hard working (Peffley, Hurwitz, and Sniderman Reference Peffley, Hurwitz and Sniderman1997). For these reasons, the subtyping framework predicts that a black Republican will be perceived as more conservative than a white Republican.Footnote 6
PERCEPTIONS OF ISSUES VERSUS IDEOLOGY
Above, we suggest that citizens are likely to rely on whatever easily accessible piece of information is most diagnostic for the task at hand. Moreover, we argue that, when it comes to predicting a candidate's ideological orientation, racial cues will be less diagnostic than a partisan and/or ideological label. When it comes to specific issues, rather than general ideology, racial cues might be more difficult to overcome. This is because a racial cue might be perceived as more directly diagnostic for certain issues than for general ideology (cf. Crawford et al. Reference Crawford, Jussim, Madon, Cain and Stevens2011). Previous research has demonstrated that issues tap into voters' sense of group interests (Bobo Reference Bobo1999; Kinder and Kalmoe Reference Kinder and Kalmoe2009; Tajfel Reference Tajfel1981). Moreover, people are thought to rely on stereotype inferences to a greater degree when the stereotypes have specific behavioral implications (Allen and Ebbeson Reference Allen and Ebbeson1981; Kirby and Gardner Reference Kirby and Gardner1972), which may be truer of policy stances than of general ideology. Furthermore, we note that a large body of research finds that racial attitudes become especially potent when they become associated with specific issues—a process known as racialization (Winter Reference Winter2008, 147–51). In other words, racial considerations seem to be at the forefront of citizens' minds as they think about a number of issues, including welfare spending (Gilens Reference Gilens1999), capital punishment (Peffley and Hurwitz Reference Peffley and Hurwitz2007), crime (Peffley, Hurwitz, and Sniderman Reference Peffley, Hurwitz and Sniderman1997), affirmative action (Kinder and Sanders Reference Kinder and Sanders1996), immigration (Valentino, Brader, and Jardina Reference Valentino, Brader and Jardina2013), and more recently, health care (Tesler Reference Tesler2012).
Consistent with this notion, a body of research on persuasion and attitude change finds individuals base their attitudes on considerations that are “available, accessible, and applicable” (Chong and Druckman Reference Chong and Druckman2007; Price and Tewksbury Reference Price, Tewksbury, Barnett and Boster1997). Put differently, a citizen must comprehend the consideration (available) (Higgins Reference Higgins, Higgins and Kruglanski1996), must bring it to mind when forming an evaluation (accessible) (Higgins, Rholes, and Jones Reference Higgins, Rholes and Jones1977), and deem it relevant to the evaluation (applicable) (Strack, Martin, and Schwarz Reference Strack, Martin and Schwarz1988). Based on this, we suggest that assumptions about how a black candidate will behave with respect to a racialized issue will be especially powerful and difficult to overturn, due to the perceived direct relevance of racial cues.Footnote 7 Thus,
H2: In the absence of a party/ideological cue, voters will perceive a black candidate to have more liberal stances on specific issues than a comparable white candidate. Race-related stereotypes will be especially powerful as concerns racialized issues.
H3: Providing information about a candidate's party and ideology will neutralize the effect of the candidate's race, although assumptions about how a candidate will behave with respect to racial issues will be especially difficult to mute.
RESEARCH DESIGN
We devised a study specifically to examine the interaction of race with partisan and ideological cues. Subjects were 1,020 Americans recruited by Survey Sampling International (SSI) in December of 2013. SSI maintains a diverse national panel of research subjects through targeted recruitment in various online communities. For our study, we asked SSI to recruit only white subjects, but our sample compares favorably to a U.S. Census benchmark in various other dimensions (i.e., age, gender, income, marital status, education; see Supporting Information, Section 1).Footnote 8 Because we expect that many readers will be interested in how our results generalize to the U.S. population, the results we report below employ survey weights that make our sample even more closely match U.S. Census benchmarks.Footnote 9 However, our substantive inferences do not depend on using these weights, and to be transparent on this matter, we replicate all our tables without using weights and report them in the Supporting Information.
Manipulation
After answering a set of profile questions, subjects viewed two 32 second video advertisements “for candidates who might run for public office.” The first advertisement depicted a white candidate named John Tilley and, importantly, was held constant across experimental conditions. This ad was presented merely to serve as a foil and stable point of comparison for subjects' subsequent evaluations.Footnote 10
The second advertisement administered a 2 × 3 manipulation of candidate race (black or white) and candidate party/ideology (Democratic and liberal; Republican and conservative; or ambiguous with respect to both party and ideology). A full script, along with image captures, appears in the Supporting Information. Race was manipulated by altering both the candidate's name (Marcus Green or Joshua Myers) and the still photograph shown on the screen in the first and last 6 seconds of the advertisement. The names and photographs we used were chosen on the basis of separate, out-of-sample instrumentation checking in which we sought (from a number of plausible alternatives) to identify a pair of names and photographs that were maximally different in terms of perceived candidate race, but as similar as possible in a number of other dimensions (e.g., age, attractiveness, friendliness, education, wealth, and other characteristics). The Supporting Information (Section 3) provides details on this manipulation check.
Candidate partisanship and ideology were manipulated as one, with just two words. Near the midpoint of the target advertisement, the narrator said that the target candidate makes it a top priority to “uphold our [ideology] values. Time and time again, [party] [candidate name] has refused to put politics before the things we care about.” The ideology placeholder was either “liberal,” “conservative,” or was skipped completely (“uphold our values”). The party placeholder was either “Democrat,” “Republican,” or was skipped. We confirmed subjects' reception of the treatment in several complementary ways (Supporting Information, Section 4).
Measures
Following the video, subjects were asked to report how liberal or conservative they suppose each candidate they viewed to be. Responses were on a seven-point scale ranging from “extremely liberal” to “extremely conservative.” We use these responses as a measure of general perceived candidate ideology.
Later, as a measure of candidate's policy stances, subjects were asked: “Politicians often have to make hard choices when it comes to deciding which issues they will focus on. Even if they have a lot of things they want to get done, they often have to focus on a small number. How much of priority do you think [candidate] would make each of the following goals?” Responses were on a five-point scale from “not a priority” to “very high priority.” The four goals listed, were “Improve infrastructure such as roads,” “Decrease taxes on business owners,” “Expand benefits for seniors, veterans, and the disabled,” and “Expand aid programs for inner city families.” To reduce the possibility of order effects, the questions were all presented on the same screen, with grid-style response options.
These four goals were chosen to examine how candidates are stereotyped with respect to different issue domains. The Roads item was chosen to represent a policy area that is relatively free from both ideological and racial connotations. (For the most part, liberals and conservatives alike are in favor of “improving infrastructure.”) The Taxes item was chosen to represent an area that does have ideological overtones—conservatives are generally understood to oppose taxes on business owners—but no clear racial theme.Footnote 11 The final two items, which we label Aid and Aid Inner City, were designed to present a sharp contrast between comparable issues that differ in terms of their racial implications. Both items refer to distributive programs with particularized benefits. Only the second item, however, invokes a code phrase (“inner city”) that has been shown to be tangled up with racial considerations (Hurwitz and Peffley Reference Hurwitz and Peffley2005).Footnote 12 We tested the perceptions of these items in an external sample to assess the extent to which they evoke ideological considerations (Supporting Information, Section 5).
Our experiment is not the first to examine the relationship between race and ideology, but it does have several advantages over past studies that make it a strong test of our hypotheses. First and foremost, we test the interaction of party/ideological and racial cues in an especially clear-cut way. We are aware of only one past study that both: (1) manipulates race and ideology in tandem and (2) includes a counterstereotypical condition (Sigelman et al. Reference Sigelman, Sigelman, Walkosz and Nitz1995). That study uses a more heavy-handed (paragraph length) ideological manipulation than ours, and does not examine how stereotypes are applied across specific issue domains.Footnote 13 Reeves (Reference Reeves1997) manipulated candidate race and issue domain (either environmental or affirmative action) but did not manipulate candidate ideology or partisanship. Similarly, McDermott (Reference McDermott1998) manipulated candidate race and examined the effect on expected candidate issue positions, but did not examine the interaction between racial and ideological cues. Kam (Reference Kam2007) asks subjects to evaluate Hispanic candidates for public office and manipulates whether partisan cues are available or not. Congruent with our expectations, she finds that stereotypes bear less heavily on vote choice when partisan information is available, but she does not measure perceptions of how candidates will behave in office. Lastly, Jones (Reference Jones2014) manipulates race and issue positions, yet the issues are not intentionally varied with regard to ideology or racialization.
RESULTS
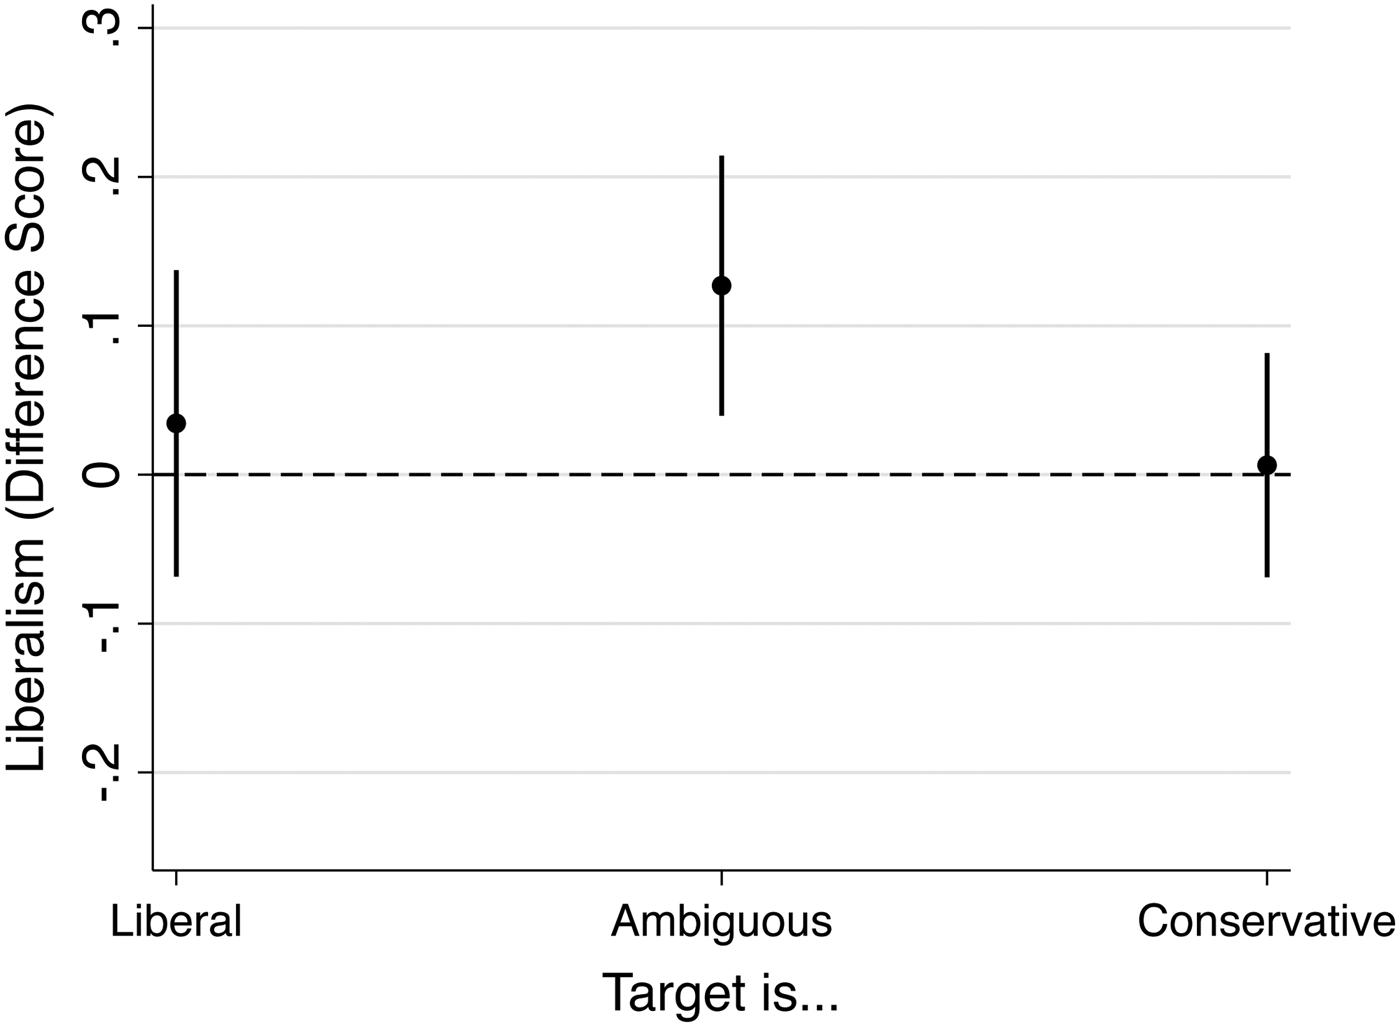
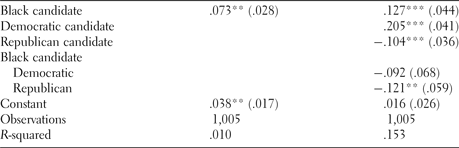
We begin with the results for general ideology, the focus of H1. Table 2 presents the results for perceived ideology of the candidate; the dependent variable is the treatment candidate's perceived ideology minus the perceived ideology of the unvarying comparison candidate, with liberalism coded to take high values. We present two models. First, there is a model in which the dependent variable is regressed on a treatment indicator for the black target condition, which allows attention to the stand-alone effect of this manipulation, as averaged across the other treatment dimension (candidate ideology). Second, there is a straightforward interactive model in which the indicator for the race manipulation is interacted with indicators for the Democratic/liberal candidate condition, and the Republican/conservative candidate condition. (Thus an ambiguous candidate condition comprises the excluded category in the constant term.) Our main focus throughout will be the marginal effect of seeing a black, rather than a white candidate. To make these marginal effects easier to interpret, we calculate them from the appropriate interaction terms and present them graphically in Figure 1.
Marginal effect of black cue on perceived candidate ideology

Effect of black cue on perceptions of general ideology

Standard errors in parentheses.
***p < .01, **p < .05, *p < .1.
Notes: The dependent variable is perceived liberalism of the (randomly assigned) candidate, measured as a difference score (relative to the perceptions of the unvarying comparison candidate) and ranges from −1 to +1. Independent variables are dummies that reflect random assignment to conditions.
The results in Figure 1 are most consistent with the Heuristic Model of candidate evaluation. In the absence of an ideological cue (the middle point in the plot), a black candidate is perceived as significantly more liberal than a white candidate (p < .01). The three point estimates take an upside-down V configuration, which is what the Heuristic Model predicts, since the model says that adding an ideological cue should weaken the effect of the racial cue. In contrast, the Bayesian model would not predict point estimates near zero—but we see them—and the Subtyping model would predict a negative effect in the conservative condition—but it is absent. Still, we do not wish to overstate our case. When we pool the Democratic and Republican conditions together and compare the effect of the racial cue there to the effect in the ambiguous condition, the difference is not statistically significant. Moreover, focusing on confidence intervals, rather than point estimates, it is difficult to reject either of the alternative models conclusively.Footnote 14 Thus, we take the results here as tentative support for H1.
But we think the subtlety of the differences we see is a finding in itself. The effect of the race manipulation is statistically significant, but notably small—amounting to movement over perhaps 5% of the ideological spectrum. Given how ubiquitous the association between black racial identity and liberalism is, it is remarkable that the race manipulation would whisper so softly. As we shall see as we turn to the results for policy expectations, racial cues have a more pronounced effect in other ways. In the discussion, we relate this finding to a disjuncture in the racial politics literature.
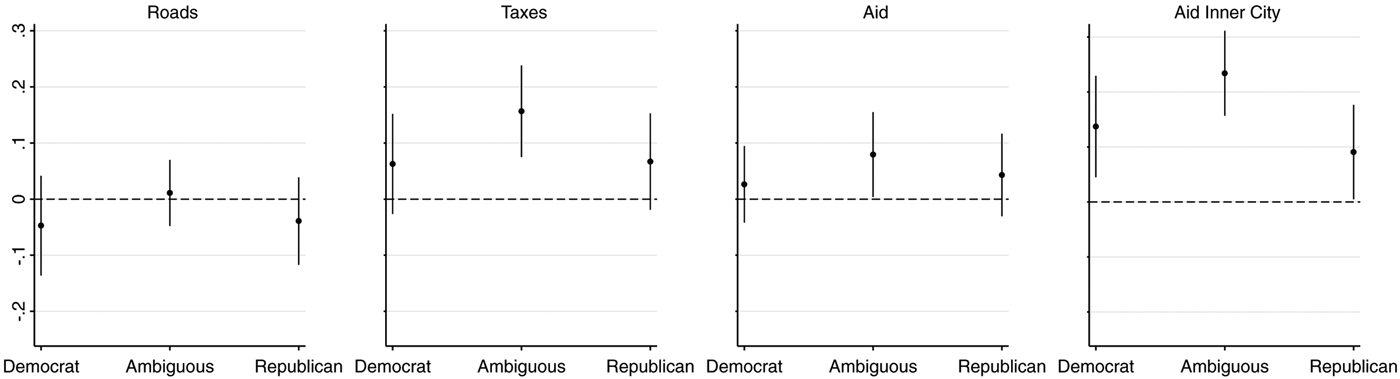
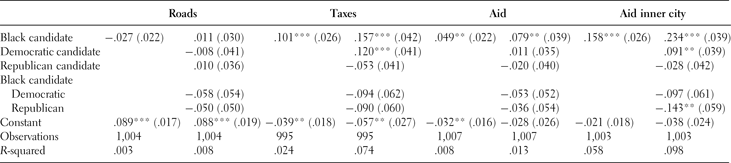
Table 3 and Figure 2 present results from the policy variables in a similar style. We have reverse coded one of the measures, Taxes, to make it conform to our general convention that liberal stances take high values.Footnote 15 To make the magnitude of effects easy to compare, we have taken care to make the y-axis scales across Figures 1 and 2, as well as the scales on which variables are coded, the same.
Marginal effect of black cue on policy expectations

Effects of black cue on perceptions of policy goals

Standard errors in parentheses.
***p < .01, **p < .05, *p < .1.
Notes: The dependent variable is perceived prioritization of the particular policy, measured as a difference score (relative to the perceptions of the unvarying comparison candidate), and ranges from −1 to +1. Independent variables are dummies that reflect random assignment to conditions.
The results in Figure 2 are strongly consistent with the Heuristic Model of candidate evaluation. For the Roads measure, all effects are quite indistinguishable from zero. This result is in keeping with expectations, since neither racial nor partisan and ideological cues are useful in predicting how a candidate will prioritize “improving infrastructure.” For each of the other three measures, an upside-down V pattern emerges. The effect of the racial cue in the ambiguous condition, moreover, is statistically distinguishable from the (pooled) partisan conditions.Footnote 16 Thus, we see these results as consistent with predictions from the Heuristic Model. In contrast, the fact that the effect of the black cue is frequently indistinguishable from zero is inconsistent with the Bayesian Model, and the fact that it never makes the candidate seem more conservative is inconsistent with the Subtyping Model.
We noted above that the effects on perceived general ideology, even if statistically significant, are substantively small. The same cannot be said for some of the results in Figure 2. In particular, the effect on Aid to Inner City (.234) is approximately double the effect seen for general ideology. This is evidence in favor of H2, which suggests that stereotypes can play a more significant role with respect to particular issue domains—racialized ones—than with respect to general ideology.
It is worth noting another way in which result for the Aid to Inner City policy differs from the others. For Taxes and generalized Aid, the racial cue clearly has a significant effect when ideological information is absent. This effect becomes indistinguishable from zero when ideological information is present, suggesting that the bare mention of party/ideological information goes far in allowing candidates to neutralize assumptions derived from their race. For the Aid to Inner City policy, the party/ideological cue has a similar attenuating effect, but the marginal effect of the race cue remains significant (p < .01; p < .04) and, in terms of magnitude, is still among the largest effects we report in this study. In other words, even when given more diagnostic ideological information, a black candidate is thought to be significantly more likely to prioritize Aid to Inner City. This is evidence in favor of H3, the notion that, for racialized policies, stereotypes are not only more powerful (H2), they are also harder to neutralize.
THE ROLE OF ATTENTION TO POLITICS
Having accumulated evidence in favor of the Heuristic Model of candidate evaluation, we now turn to an additional implication of the framework that is testable in our data. More than the alternative models, the Heuristic Model paints a picture of a sophisticated citizen: one who has a sense not only of what politically relevant stereotypes are, but also an ability to apply them differentially, depending on what other information is available. This thinking leads us to conjecture that the most politically involved citizens should be best able to apply the Heuristic Model. Our thinking here draws from past work that emphasizes an important role for political sophistication generally (Zaller Reference Zaller1992), but also specifically with respect to understanding the associations connected to ideological labels (Berinsky et al. Reference Berinsky, Hutchings, Mendelberg, Shaker and Valentino2011, 182).
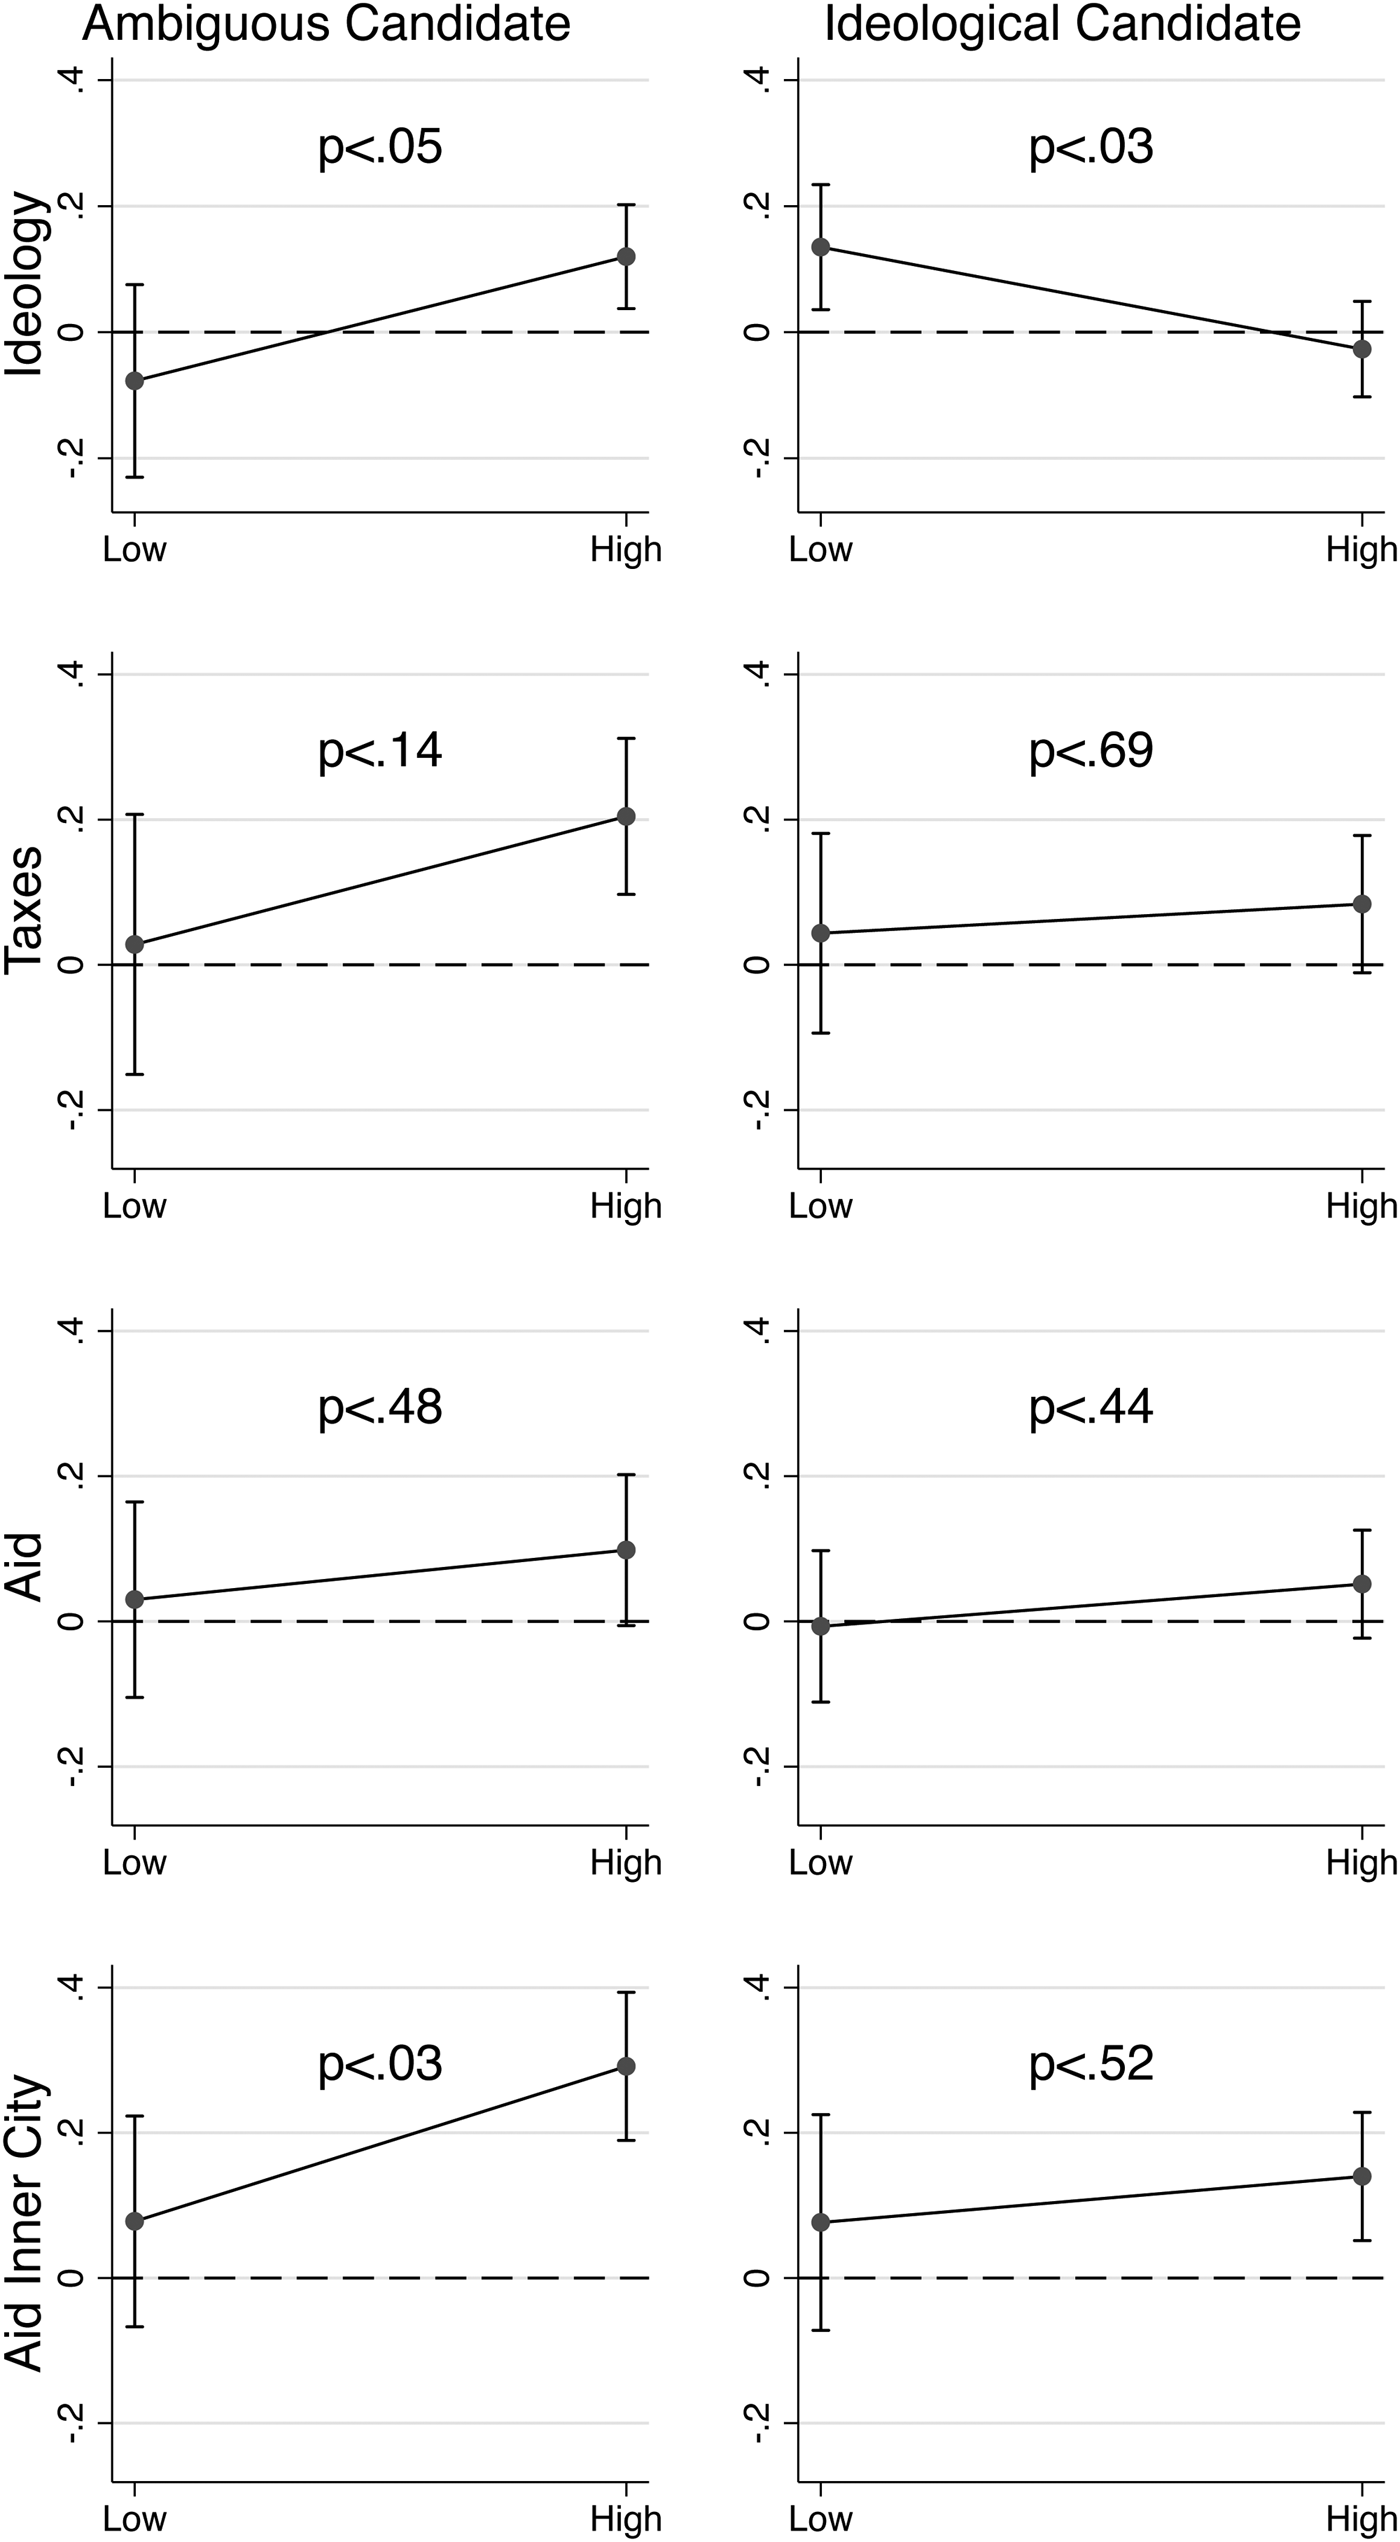
We test the idea that, when a candidate's partisan and ideological leanings are not stated, politically attentive citizens will be the most likely to draw inferences from racial cues since they will be most likely to know and have cognitively accessible the association between black candidates and liberalism.
H4: When a candidate's ideology is ambiguous, politically attentive citizens are most likely to perceive a black candidate as having liberal policy stances.
It is more difficult to draw a prediction from the Heuristic Model for the case where party and ideological information is available. Attentive citizens will still be most likely to know the association between black candidates and liberalism, but they might also be best at discerning the superior diagnostic value of the party/ideological cue, which could neutralize the effects of the racial cue.
Our instrument included a standard, single-item measure of self-reported attention to politics. Figure 3 shows how subjects' responses on this measure moderate treatment effects. (We do not include the Roads policy here, because the logic above does not apply to a non-ideological issue.) We regress each dependent measure on an interactive model of experimental conditions and attention to politics:
 $$\eqalign{{\rm DV} = & {{\rm \beta} _{\rm 0}} + {{\rm \beta} _{\rm 1}} \times {\rm Black}\;{\rm Candidate} + {{\rm \beta} _{\rm 2}} \times {\rm Follow}\;{\rm Politics} + {{\rm \beta} _{\rm 3}} \cr & \times {\rm Black}\;{\rm Candidate} \times {\rm Follow}\;{\rm Politics} + e.}$$
Attention to politics moderates responses when the candidate is ambiguous, but not otherwise

We present the marginal effect of a Black candidate at low and high values of Follow Politics. The p values reported in each panel are from a Wald test of the null hypothesis that β3 = 0.
Starting in the left column, where candidate party/ideological information is absent, we find evidence consistent with H4. The marginal effect of the race cue among attentive citizens is always significant, while among inattentive citizens, it is never distinguishable from zero. In two cases, the interaction is significant, and in one more case, it is marginally significant. In the right column, for cases when party/ideological information is given, the results tell a different story, as responses are much less moderated by attention to politics. With respect to perceived candidate ideology—the one significant interaction here—the marginal effects suggest that among politically attentive respondents, the effect of the racial cue is neutralized entirely. The broad pattern of results here is consistent with the idea that attentive citizens rely on partisan or ideological cues when they can and racial cues when they must.
DISCUSSION AND CONCLUSION
This study reveals texture in how stereotypes are applied. When asked to evaluate a candidate's general ideological position, racial stereotypes affect inferences when more direct diagnostic information is absent. But when a bit of ideological information is provided, the effect of race disappears. When asked to evaluate a candidate's policy positions, the effect of race depends on the policy domain: race affects inferences on a racialized issue profoundly. It affects two ideological (but non-racial) issues when more diagnostic information is lacking. And it affects a non-ideological issue hardly at all. This pattern of results speaks well of the Heuristic Model of stereotyping, vis-à-vis the Bayesian and Subtyping Models, in the realm of candidate evaluation.
The results herein underscore the complexity of patterns that affect minority candidates' ability to vie for public office. Where much work focuses on prejudice and its role in keeping minorities out of power (e.g., Kinder and Dale-Riddle Reference Kinder and Dale-Riddle2012; Payne et al. Reference Payne, Krosnick, Lelkes, Akhtar and Tompson2010; Tesler and Sears Reference Tesler and Sears2010), our results show how race could influence voting for reasons distinct from prejudice. This is not to say that race does not matter. Rather, it is to highlight a different way that it does matter—one that leads us to focus on conditionality in the link between candidate race and vote choice.
For example, recent work finds similar evidence that white citizens perceive black candidates as more liberal than ideologically identical white candidates and that these misperceptions indirectly influence vote choice (Jacobsmeier Reference Jacobsmeier2015). This expectation fits with our results when the candidate's partisan and/or ideological position is ambiguous or unknown. Nonetheless, as we carefully demonstrate, this effect disappears when more information is available and the candidate's political leaning is explicitly stated. Future work ought to more closely examine the impact of race when the candidate's ideological leanings are correctly perceived.
This research underlines the importance of understanding two particular aspects of stereotypes and how they are applied. First, which aspects of racial stereotypes are easiest and hardest to neutralize? Our studies proceeded by focusing on a small array of issues that we expected to be maximally different on key characteristics. (E.g., taxes and aid to inner city families might both be construed as ideological issues, but the latter has clearer racial overtones.) Future studies could study a broader array of issues with attention to where racial presumptions most strongly constrain a candidate. Future work should also examine stereotypes as they arise for other kinds of candidates (e.g., Hispanic, Asian, female, LGBT [Lesbian, Gay, Bisexual, Transgender]), as well as stereotypes about candidate personal traits (e.g., competence, cool-headedness, ability to work with others).Footnote 17
Second, the studies above show that those citizens can move past their stereotype inferences when they receive a bit of extra information relevant to candidate evaluation, but how likely are they to receive such information? Faced with a black candidate, how many citizens will unthinkingly assume he or she is liberal, and how many will exert at least some effort to verify this assumption? Are citizens less likely to verify the more deeply ingrained assumptions? To what extent is the effect of stereotypes dependent on campaign dynamics?Footnote 18 Would stereotypes have a less pronounced effect in high-salience (e.g., presidential or senatorial) races, where the media environment is saturated with extra information about candidates? When one assumption (e.g., “This candidate will raise taxes on the wealthy”) is falsified, to what extent will it cause a reassessment of other stereotypes? Some of these questions speak directly to the limits of the current study, especially as concerns external validity. While the experimental method is powerful in its ability to allow for strong causal claims, it is potentially limited by concerns over the extent to which the results extend to the real world. This study takes steps to address such concerns. Specifically, unlike much previous work, we use televised candidate ads designed to realistically mimic how citizens might encounter a candidate in a low-salience election. Nonetheless, future work ought to consider highly naturalistic field experimental approaches, and perhaps examine how racial stereotypes are applied in high-salience elections.
Finally, we note that our results might contribute to a significant disjuncture in the study of barriers that minority candidates face when they run for public office. Despite strong theoretical reasons to expect black candidates would pay a penalty at the ballot box among white voters (e.g., Kinder and Dale-Riddle Reference Kinder and Dale-Riddle2012; Tesler and Sears Reference Tesler and Sears2010), empirical evidence to support this notion is mixed. As Hutchings and Valentino (Reference Hutchings and Valentino2004) catalogue, experimental work that isolates the effect of race from other factors, such as partisanship, finds the effect of race on vote choice, though statistically significant, to be small (Iyengar et al. Reference Iyengar, Messing, Bailenson and Hahn2010; Reeves Reference Reeves1997; Sigelman et al. Reference Sigelman, Sigelman, Walkosz and Nitz1995; Terkildsen Reference Terkildsen1993). Real election results tend to provide even weaker evidence (Citrin, Green, and Sears Reference Citrin, Green and Sears1990; Hajnal Reference Hajnal2001; Highton Reference Highton2004). Why? It is possible that the results of this study might help explain this puzzle. Since information about candidates' partisanship and ideology is often easy for voters to acquire, it is understandable that the real world effects of race are small; particularly in light of our finding that such information can mute the effect of race. Future studies of real world elections and the impact of race may benefit from focusing on races that occur in a low-information environment.
Stereotypes about a candidate's race continue to impact political cognition, but they are often surmountable. We find evidence that voters rely upon whichever cue they find most narrowly relevant to an evaluation. In some instances, the cue is race. In different instances, other information trumps race. Still, the stereotypes that surround racialized issues are strikingly persistent. In recent years, Americans have become more uniform in their explicit endorsement of racial equality. Nevertheless, there are some domains in which the influence of race remains remarkably difficult to shed.
ACKNOWLEDGMENTS
The authors contributed equally. We are thankful to Antoine Banks, Cheryl Boudreau, Ted Brader, Allison Dale-Riddle, Ashley Jardina, Efrén Pérez, Spencer Piston, Nicholas Valentino, and our peer reviewers for comments on previous drafts, though errors are our own. We also acknowledge research support from the Center for Public Policy in Diverse Societies at the Gerald R. Ford School of Public Policy.