In their landmark textbook on experimental political science, Morton and Williams describe location as “probably the most salient dimension over which experiments differ” (Reference Morton and Williams2010, 278). Recent research finds an “inherent advantage” for questionnaire self-administration on the computer (Chang and Krosnick Reference Chang and Krosnick2010), but computer administration can take place in a variety of places, such as a university laboratory or a respondent’s home. Indeed, the choice of where to conduct a study is a crucial consideration for researchers conducting an individual decision-making experiment, with a growing number of scholars turning to the Internet (Sargis et al. Reference Sargis, Skitka, McKeever and Amichai-Hamberger2014). In this study, we examine respondent behavior in a laboratory versus an online context—one of the first such mode comparisons of which we are aware.Footnote 1
The choice of lab versus online administration has important consequences for the burden on subjects and researchers, as well as the quality of the data. From a practical standpoint, online questionnaires can be distributed easily via email, Web sites, or crowd-sourcing platforms such as Mechanical Turk, and participants can complete the survey at a time and place of their choosing (Berinsky et al. Reference Berinsky, Huber and Lenz2012; Cassese et al. Reference Cassese, Huddy, Hartman, Mason and Weber2013). By contrast, laboratory experiments involve greater costs in terms of the administration of the study (e.g., setup, proctoring) and the potential inconvenience for subjects taking the study at a specified time and place. If there were few differences between data obtained in the lab versus the Internet (e.g., in terms of the quality of responses), researchers might conduct more of their experiments, even those involving college students, through an online platform. From a theoretical standpoint, this study extends research on the generalizability of findings across experimental contexts (e.g., Coppock and Green Reference Coppock and Green2013; Jerit et al. Reference Jerit, Barabas and Clifford2013). Lab and online experiments vary in ways that affect whether the treatment is received. Thus, the decision to administer an experiment online or in the laboratory may have implications for the conclusions one draws from such studies.
EXPECTATIONS
Drawing upon Jerit et al. (Reference Jerit, Barabas and Clifford2013), we expect that experiments administered in a laboratory and online setting will differ principally in terms of experimenter control and the obtrusiveness of the setting. In a lab, subjects complete the study under the discretion of the researcher and at a common location. In an online setting, subject interaction with the researcher is indirect. There also is more “behavioral latitude” (Gerber Reference Gerber, Druckman, Green, Kuklinski and Lupia2011, 120) in terms of what a subject does while completing a questionnaire online and greater noise from the outside world. As a result of these differences, we expect that participants in a lab study will devote higher levels of attention to the task than online participants (Hypothesis 1). Previous research shows that the mode of administration is related to social desirability pressures (Tourangeau and Yan Reference Tourangeau and Yan2007). For example, questionnaires delivered over the Internet (i.e., self-administration) exhibit lower levels of socially desirable responding than those delivered over the telephone (i.e., aural administration; Chang and Krosnick Reference Chang and Krosnick2009). But self-administration may take place in the lab or online, making the implications for socially desirable responding somewhat unclear. Following the logic of Chang and Krosnick (Reference Chang and Krosnick2009; also see Evans et al. Reference Evans, Garcia, Garcia and Baron2003), we surmise that participants in a lab may be more concerned with impression management than online participants because the trappings of a scientific study are more apparent (e.g., a proctor, other participants). This leads to the expectation that the level of socially desirable responding will be higher in the lab compared with the online setting (Hypothesis 2).Footnote 2
As more researchers use the Internet to collect data, there is growing concern that the behavioral latitude in online studies leads subjects to cheat on knowledge questions by consulting the Internet for answers (e.g., Vavreck Reference Vavreck2012; Warren Reference Warren2012). Others, citing the tendency of respondents to satisfice, doubt that people are sufficiently motivated to cheat. Thus, we also collected data on respondents’ political knowledge. Our study is uniquely situated to investigate this issue because participants were sampled from the same target population and then randomized to either a lab or online condition after agreeing to participate in the study. Thus, any differences in the observed levels of political knowledge across the two conditions can be attributed to features of the experimental setting.
EXPERIMENTAL DESIGN
Respondents
Participants (n = 435) in the study were undergraduate students enrolled in political science classes at a large public university in the south in the spring of 2013.Footnote 3 They were recruited to participate in exchange for extra credit and instructed to sign up for an appointment through a link hosted at the Department of Political Science Web site. All subjects, irrespective of their eventual treatment assignment, signed up for the study through the same mechanism (believing the study would take place in a computer lab on campus). The participants included 201 males and 234 females, with nearly half indicating they were either in their first or second year of school. Approximately 72% of the sample was White; 8% were African American, and 13% were Hispanic.
Procedure
Our study is a between-subjects design with two conditions, lab versus online administration. Participants were randomized into condition by using the list of students who had signed up for an appointment in combination with a random number generator. Depending on treatment assignment, participants were instructed (via e-mail) to come to a computer lab at a particular time during a five-day period, or they were told they would be receiving a link to a survey that they could complete at a time and place of their choosing during this same five-day period. Because participants were randomly assigned to condition after they had already signed up for the study, any observed differences between responses in the lab and online conditions are likely due to the effects of the experimental context, rather than the differences between participants in each setting. Table A1 shows that demographic and other characteristics were similar across experimental conditions.
Measures
We investigated whether there were differences across mode of administration in three areas relating to data quality: respondent attention, socially desirable responding (SDR), and levels of political knowledge. Overall, seven questions were used to measure respondent attention: an instructional manipulation check or IMC (Oppenheimer et al. Reference Oppenheimer, Meyvis and Davidenko2009), two bogus items (e.g., Meade and Craig Reference Meade and Craig2012), two substantive manipulation checks that followed experimental treatments appearing elsewhere on the questionnaire, and two self-report items.Footnote 4 Whereas IMCs are considered a general measure of attention (Berinsky et al. Reference Berinsky, Margolis and Sances2014), substantive manipulation checks determine whether a particular experimental treatment was received (Mutz Reference Mutz2011). The self-report measures asked individuals to assess their level of attention during the study. The first item asked respondents to indicate how closely they were paying attention to the questions (e.g., Berry et al. Reference Berry, Wetter, Baer, Larsen, Clark and Monroe1992). The second asked them to indicate which of several different activities they engaged in while answering the questionnaire (e.g., using a cell phone). Socially desirable responding is measured with a three-item battery from the Modern Racism Scale (McConahay Reference McConahay, Dovidio and Gaertner1986) and an open-ended item asking respondents how many sexual partners they have had in their lifetime. Finally, we measure political knowledge with eight questions about current events.Footnote 5
EMPIRICAL RESULTS
Response Rates
We begin by describing the response rates across conditions. There was a significantly higher response rate in the online condition compared with the lab condition (88% vs. 77%, p < .001), which may reflect the greater convenience of online administration.Footnote 6 To rule out concerns about selection bias related to the higher response rate in the online condition, we examined whether online subjects were different in terms of demographic and attitudinal characteristics. Across a range of variables that may be related to differential participation (race, GPA, political interest, voter registration status, year in school) there were no significant differences between conditions (see Table A1 in the Appendix).Footnote 7 Overall, there is little reason to suspect that the differential response rate led to selection effects across conditions. As a precaution, we confirmed that all of our results obtain in models including a basic set of controls.
Attention
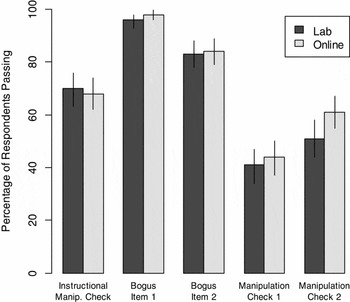
Next we examine whether mode of administration affects attention to experimental stimuli and thus the likelihood of receiving the assigned treatment. The results of the five attention checks are summarized in Figure 1 (the self-report items are described separately). Starting on the left, passage rates for the instructional manipulation check are indistinguishable between the lab and online conditions (70% vs. 68%; p = .75). For the first bogus item, passage rates are above 95% in both conditions and thus are not significantly different from one another (96% vs. 98%; p = .16). For the second bogus item, there are no differences between the lab and online conditions (83% vs. 84%; p = .82). The first substantive manipulation check followed an experimental vignette in which respondents were randomly assigned to learn different facts about a politician’s earmarking activity. All subjects were told the politician had received earmarks and then, after two outcome measures, were asked whether the politician was part of a group of congressmen who had foregone earmarks for the past two years.
Note: Columns represent the percentage of respondents selecting the “correct” response to each question. Bars represent 95% confidence intervals.
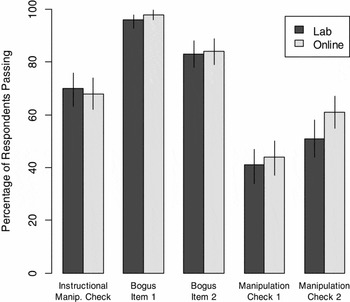
Passage rates for both groups were substantially lower than the other attention items, but no differences emerged between the lab and online conditions (41% vs. 44%; p = .48). The final substantive manipulation check followed an experimental vignette that randomized a politician’s partisanship, issue stance, and explanation for the issue stance. After 13 outcome measures, respondents were asked to recall the politician’s partisanship. Passage rates on the second manipulation check were slightly lower among students in the lab than in the online condition (51% vs. 61%; p < .05). On the basis of the analysis of the attention checks, there is no consistent effect of mode on attention among student participants taking the questionnaire in the lab versus online.
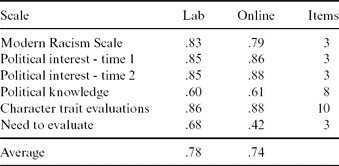
Previous researchers have used scale reliability as an indicator of respondent attention, finding higher reliabilities among more attentive respondents (Berinsky et al. Reference Berinsky, Margolis and Sances2014; Huang et al. Reference Huang, Curran, Keeney, Poposki and DeShon2012). Table 1 shows the Cronbach’s alpha coefficients for six multi-item scales in the survey. The average scale reliability in the lab condition is .78 compared with .74 in the online condition, suggesting no difference between modes in terms of data quality.Footnote 8
Scale Reliability by Experimental Condition
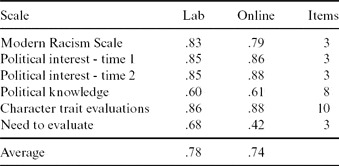
Note: Cell entries display Cronbach’s Alpha coefficient for each scale by experimental condition. Political interest was measure at the beginning (time 1) and end of the survey (time 2). The third column lists the number of survey questions used to construct the scale.
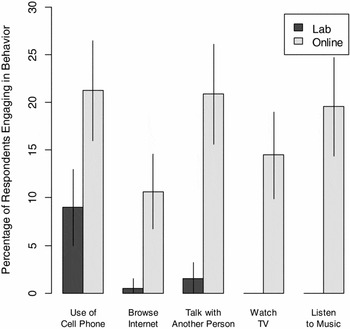
Although students in the online and lab conditions paid similar levels of attention to the stimuli, online participants might have faced more interruptions depending on where and when they completed the questionnaire. This appears to be the case according to Figure 2, which shows the rates of self-reported distraction across groups. Starting on the left, there is a significantly higher rate of distraction among online participants from cell phone use (21% vs. 9%; p < .001), surfing the internet (11% vs. 1%; p < .001), and talking with another person (21% vs. 2%; p < . 001).
Note: Columns represent the percentage of respondents engaging in each behavior. Bars represent 95% confidence intervals.
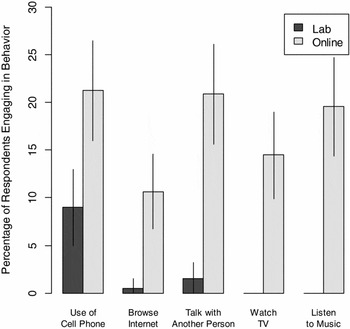
Online subjects also were asked about watching TV and listening to music. Lab subjects were not asked these questions because it would have been impossible for them to engage in these behaviors in the lab. Of online students, 14% reported watching TV during the survey and 20% said they were listening to music during the survey. Finally, in response to the item about paying attention to what the survey questions mean, students in the lab condition reported paying greater attention than students taking the questionnaire online (4.0 vs. 3.8; p < .05). Taken together, this evidence suggests that subjects in the online condition faced significantly higher rates of distraction from a number of sources (though these distractions were not associated with worse performance on the attention checks).
Socially Desirable Responding
We now examine the presence of socially desirable responding. As a first indicator of socially desirable responding, we analyze item non-response on two sensitive questions (Berinsky Reference Berinsky1999; Tourangeau and Yan Reference Tourangeau and Yan2007). Contrary to our expectations, there was no missingness on the Modern Racism scale in either condition.Footnote 9 Additionally, there was a surprisingly low level of missingness on the sexual partners question across both conditions (lab: 3%; online: 2%), with no significant difference between groups (p = .56). Finding little evidence of non-response, we turn to subjects’ responses to determine if mode affected self-reported opinions. There is no difference between conditions on the Modern Racism scale (4.1 vs. 4.2; p = .58), or the number of sexual partners (6.7 vs. 5.7, p = .38). Tourangeau and Smith (Reference Tourangeau and Smith1996) report that although social pressure decreases the self-reported number of partners among women, it may increase self-reports among men. We investigated the mode effect separately by gender, but found no significant differences.Footnote 10 Overall, there is little evidence that mode (lab vs. online) affects levels of socially desirable responding.Footnote 11
Knowledge
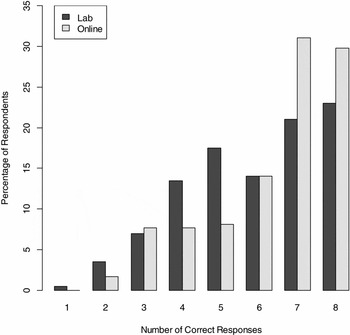
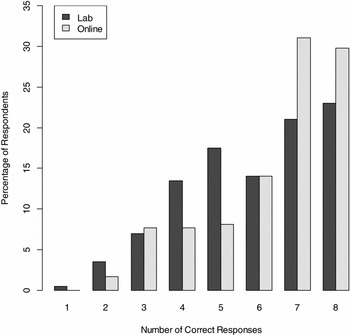
Our final analysis investigates levels of political knowledge across conditions. Figure 3 shows the distribution of correct responses (out of eight) for student participants in the lab and online conditions. Consistent with suspicions about cheating behavior in online surveys, students in the online condition scored significantly higher on the knowledge scale than lab students (6.4 vs. 5.9; p < .01). Indeed, 61% answered 7 or 8 questions correctly online, whereas only 44% of lab participants obtained a similar score. To buttress our claim that this difference stems from cheating, we examine the criterion validity of the knowledge scale by looking at its correlation with political interest. If online subjects are cheating, the knowledge scale should have lower criterion validity, as indicated by a weaker correlation with political interest (e.g., Prior Reference Prior2009).Footnote 12 In line with the cheating interpretation, the correlation between interest and knowledge was higher in the lab (r = .48) than in the online condition (r = .33), a difference that is statistically significant (p < .10).Footnote 13 We conclude that subjects in the online condition were more likely to cheat on knowledge items, weakening the validity of the scale. This interpretation also is consistent with Figure 2, which reveals that subjects in the online condition were more likely to report surfing the Internet than lab subjects (11% vs. 1%).Footnote 14
Note: Columns represent the percentage of respondents in a particular category.
DISCUSSION
In a comparison of student subjects randomly assigned to take a questionnaire in the lab versus online, there were few differences in respondent attention across a variety of measures (contrary to our first hypothesis). From a practical standpoint, the results suggest that online experiments may be an appealing alternative to lab experiments. Online administration lowers the burden on the researcher and it appears to have a similar effect on subjects, as evidenced by the higher response rate in the online condition. That said, our results revealed substantially higher levels of distraction outside of the lab. This pattern is consistent with the idea that researchers lose control over key aspects of an experiment when a study takes place outside of the laboratory (McDermott Reference McDermott2002; Morton and Williams Reference Morton and Williams2010). In our case, these distractions did not translate into worse performance on the attention checks, but our findings should give pause to those carrying out subtle or short-lived manipulations.
To further illustrate some of these challenges, consider the use of non-conscious primes, which are common in psychology and some subfields of political science (e.g., Bargh and Chartrand Reference Bargh, Chartrand, Reis and Judd2000; Lodge and Taber Reference Lodge and Taber2013). The brevity of the presentation ensures that the stimulus cannot be consciously processed, but potential distractions from an online setting might prevent the treatment from being received (though see Weinberger and Westen Reference Weinberger and Westen2008, for an exception). In other instances, a concept or trait might be successfully primed in an online study (say, though a scrambled-sentence task), but its effects might not observed if the subject becomes distracted by unrelated stimuli before answering the outcome measures.
Regarding our second hypothesis, mode does not appear to affect socially desirable responding. Across two topics previously shown to create social desirability pressures, we found no differences between experimental conditions, either in terms of the patterns of non-response or substantive responses. Previous research has shown that online surveys create weaker social desirability pressures relative to phone or face-to-face interviews. Self-administered questionnaires in a laboratory environment fare no worse on this dimension.
Finally, our results have important implications for research on political knowledge. We found evidence that students in our online condition were more likely to cheat on the knowledge items, generating higher knowledge scores and weakening the validity of the measure. It is unclear whether this pattern generalizes to other populations—non-students may not be as motivated to cheat on knowledge questions. Given the rise of online surveys, however, researchers may consider designing questionnaires in a way that discourages Internet surfing, particularly if political knowledge is the outcome of interest.Footnote 15
Our study highlights some of the issues related to the cost and convenience of online versus lab studies, but cost and convenience are not the only considerations when conducting an experiment. Online administration can be advantageous when a researcher wants to collect data from a nonlocal sample (either national or international). Conversely, some studies are difficult, if not impossible, to administer online, such as those that collect physiological data or that involve human confederates as part of the treatment. Nevertheless, the growing use of the Internet as a platform for data collection points to a need for studies that explore mode differences between experiments conducted online and in the lab.
SUPPLEMENTARY MATERIAL
To view supplementary material for this paper, please visit http://dx.doi.org/10.1017/xps.2014.5.