Nomenclature
- CDRAG
-
drag coefficient in the wind axis
- CLIFT
-
lift coefficient in the wind axis
- CROLL
-
roll-moment coefficient in the wind axis
-
 ${C_D},{C_L},{C_y}$
-
drag, lift and side force coefficients in the stability axis
-
${C_m},{C_r},{C_n}$
-
pitch, roll and yaw moment coefficients in the stability axis
-
${C_F}$
-
skin friction coefficient
-
${C_p}$
-
pressure coefficient
- c
-
mean aerodynamic chord, m
-
${F_x},{F_y},{F_z}$
-
body-axis forces, N
- N
-
number of grid cells
- M
-
Mach number
-
${{{M}}_x},{{{M}}_y},{{{M}}_z}$
-
roll, pitch, and yaw moments, N.m
- Re
-
Reynolds number,
$\rho Vc/\mu $
- t
-
time, s
-
$u,v,w$
-
velocity components in x,y,z directions, m/s
- V
-
velocity, m/s
-
${V_\infty }$
-
free-stream velocity, m/s
-
$x,y,z$
-
aircraft position coordinates, in


Greek symbol
-
$\alpha $
-
angle-of-attack, deg
-
$\beta $
-
side-slip angle, deg
-
$\rho $
-
density,
${\rm{k}}g/{m^3}$


1.0 Introduction
A wide gap still exists between Computational Fluid Dynamics (CFD) and Stability & Control (S&C) predictions. There are two main concerns in using CFD for S&C: (1) the accuracy of CFD predictions and (2) the lack of the ability to rapidly generate aerodynamic data for large look-up tables. The CFD prediction of high angle of attack flows, separated flows, and transonic flows are still challenging problems. Test cases used in this study try to address the first concern by modeling the transonic flow over a generic commercial aircraft configuration. The effects of grid resolution and CFD setup on the accuracy of predictions are investigated. In addition, a novel system identification technique is proposed to accelerate the generation of aerodynamic data at transonic speeds for this test case. The system identification takes into account the effects of angle-of-attack, pitch rate, side-slip angle and their combined effects on the aerodynamic forces and moments. The training manoeuver to estimate the model unknowns has independent excitation for all these parameters.
Previous efforts using CFD for S&C analysis were mainly focused on the accuracy assessment of predictions for aircraft with complex flow-fields. The accuracy topic has been the subject of many studies including different AIAA Workshops such as the CFD Drag Prediction Workshop (DPW) [Reference Levy, Zickuhr, Vassberg, Agrawal, Wahls, Pirzadeh and Hemsch1] and CFD High Lift Prediction Workshop (HiLiftPW) [Reference Rumsey, Slotnick, Long, Stuever and Wayman2]. Grid sensitivity and turbulence modeling effects on the predictions were highlighted in these workshops. The first Drag Prediction Workshop took place in June 2001, the second one in June 2003, the third in June 2006 followed by the fourth workshop in June 2009, the fifth in June 2012, and sixth in June 2016. The NASA Common Research Model (CRM) transonic wing-body-tail configuration was introduced and used in the fourth and fifth DPW. The sixth DPW used the CRM wing-body-nacelle-pylon configuration. The first HiLiftPW was held in June 2010 followed by the second one in June 2013, and third one in June 2017. A High Lift Common Research Model geometry was developed and used for the third HiLiftPW. This model has leading edge inboard and outboard slats and trailing edge single-slotted flaps [Reference Lcey and Sclafani3]. The slats were deflected 30 degrees, while flap angles were set to 37 degrees.
For three-dimensional configurations, the aerodynamic loads can be obtained from experimental measurements or numerical predictions. Wind tunnels have traditionally been used to estimate aircraft aerodynamic characteristics during the preliminary design phase, but it takes significant time and expense to fabricate models, collect data and analyse the measured data. The measurements also suffer from scale and interference effects and are limited in terms of the dynamic motions achievable. Flight tests are very expensive (at least an order of magnitude higher than wind tunnel testing) and usually come very late in the design cycle. The traditional wind tunnel/flight test approach for determining aircraft aerodynamics is extremely expensive and time consuming. A relatively new tool for design applications is CFD, which enables designers to analyse and evaluate the dynamic behaviour of aircraft in the form of stability and control derivatives earlier in the design phase. CFD tools have recently become credible for the computation of aerodynamics experienced by a manoeuvering fighter aircraft. At the highest practical level, a full-order mathematical model can be developed based on the direct solution of the discretised Navier-Stokes equations coupled with the dynamic equations governing the aircraft motion [Reference Ghoreyshi, Badcock, Da Ronch, Marques, Swift and Ames4]. First attempts at this approach were limited to two-dimensional test cases [Reference Steger and Bailey5, Reference Chyu and Schiff6], while recent advances and the capabilities provided by High Performance Computing (HPC) resources enable simulations of the coupled CFD-flight dynamics of a full aircraft [Reference Schütte, Einarsson, Raichle, Schöning, Mönnich, Orlt, Neumann, Arnold and Forkert7, Reference Ghoreyshi, Vallespin, Da Ronch, Badcock, Vos and Hitzel8]. The ability to use a full-order model for stability and control parameter estimation comes at the computational cost of the calculations, since such a model needs hundreds or thousands of unsteady simulations to determine appropriate forcing parameters within the frequency/amplitude space. To ease this computational burden, efforts over the last decade have focused on the development of a Reduced Order Model from an appropriate training manoeuver(s) and an accurate SID approach. The objective of the ROMs is to develop a model that significantly reduces the CFD simulation time required to create a full aerodynamic dataset, making it possible to accurately model aircraft static and dynamic characteristics from a reasonable number of CFD simulations. A SID approach and a Chirp training manoeuver are used in this study to predict S&C data of a large-scale CRM model at transonic speeds.
The CRM is a generic commercial transport configuration being designed by a technical working group at Boeing and NASA [Reference Vassberg, DeHaan, Rivers and Wahls9]. Within this group, the Boeing company took the lead for the aerodynamic design and NASA took the lead on the model design, fabrication and testing of the CRM [Reference Vassberg, DeHaan, Rivers and Wahls9]. The CRM was designed to achieve a nominal cruise lift of
 ${C_L}$
= 0.50, flying at a Mach number of 0.85 and at a Reynolds number of 40 million. It is a low-wing design with aspect ratio of 9 and a taper ratio of 0.275. The fuselage of the CRM represents a wide-body commercial transport aircraft with a fairing at the fuselage/wing juncture. Lacy and Sclafani [Reference Lcey and Sclafani3] redesigned the CRM for a representative takeoff and landing configuration.
A large-scale CRM model was used as a test case in the first AIAA CFD Stability and Control Prediction Workshop, held in January 2021. The workshop was organised by the S&C discussion group of the AIAA Applied Aerodynamics Technical Committee. The DG objectives were: (1) to establish the best practices for the prediction of S&C derivatives using CFD and to assess the limitations of these CFD methods when best practices are applied and (2) to identify areas in need of additional research and development. The geometry, the so-called Large Reference Model (LRM), was tested at the ONERA-S1MA wind tunnel [Reference Cartieri, Hue, Chanzy and Atinault10, Reference Cartieri11]. The full-body geometry was provided to the workshop participants in addition to two set of grids: fully structured and unstructured grids both with several grids of different size ranging from a low-resolution (so-called tiny grid) to a high-resolution type (so-called Extra-Fine). The first objective was to perform a grid sensitivity study for a fixed lift coefficient of 0.5 at a Mach number of 0.8325 and a Reynolds number of
 $4.56{\kern 1pt} \times {\kern 1pt} {10^6}$
based on mean aerodynamic chord. The second objective was to perform a Mach number effect study on the CRM stability, and finally, to estimate the wind tunnel sting effects on the S&C predictions.
The U.S. Air Force Academy (USAFA) High Performance Computing Research Center (HPCRC) in the Department of Aeronautics participated in the first SCPW by providing results of the KCFD flow solver of the HPCMP
 ${\rm{CREAT}}{{\rm{E}}^{{\rm{TM}}}}$
-AV Kestrel simulation tools. Individual grids were generated for the various test cases. In addition, the common unstructured grids provided by the workshop organisers were used. This article provides a summary of the USAFA simulation results of three-dimensional test cases. In addition, a system identification technique was used for rapid and accurate aerodynamic predictions of the SCPW test cases. A Chirp-type forced motion was used to cover angle-of-attack, pitch angle and side-slip angle of the LRM model. The developed model predictions are compared with static data generated by CFD at test points across the flight-envelop.
The article is organised as follows: First, the system identification technique will be described. Test cases are then presented. Details of the experimental setup and computational grids are given next. This is followed by the description of the computational methods. Computational results for the effects of grid resolution, Mach number and sting geometry are provided and discussed. The system identification results include the comparison of model predictions with static CFD data. Finally, conclusions will be drawn.
2.0 Aircraft system identification
The stability and control prediction for an aircraft requires thousands of simulations to cover the input parameter space of the entire flight envelope. This makes the use of high-fidelity CFD for S&C impractical. Fortunately, there are methods to significantly reduce the number of simulations required to cover conditions throughout the flight envelope. Recent efforts on reduced order aerodynamic models have led to multi-input/output models that can accurately predict the unsteady nonlinear aerodynamics in a few seconds once the model unknowns (parameters) are estimated [Reference Ghoreyshi, Jirasek and Cummings12–Reference Lucia, Beran and Silva14].
System identification is a ROM method that tries to determine the functional dependencies between the inputs and outputs of a system such as an aircraft from observed data. Once these functional dependencies are established, other analyses can be completed, including aircraft stability and control analyses. System identification is a wide field in terms of the methods used to determine and model the functional relationships. Time dependent, quasi-steady, and frequency domain methods are all used to perform aircraft SID. Specifically, this study is focused on parametric system identification with a model structure similar to well-known aircraft stability derivative model. The model unknowns are determined using a least squares method. In effect, a quasi-steady method, also referred to as a derivative-based method, is used in which functional relationships are developed as linear polynomial equations in terms of the aircraft flight parameters and rates. No direct dependence on time is retained.
A quasi-steady model is limited in its applicability where the aircraft might experience fully unsteady flight characteristics, like dynamic stall or flutter. A useful measure for characterizing the unsteadiness of fluid flow is the reduced frequency,
 $k = \omega c/2V$
, where
 $\omega $
is the oscillation frequency, c is the characteristic length, and V is the free-stream velocity. Generally, reduced frequencies below
 $k = 0.01$
are considered quasi-steady, and while results from Greenwell [Reference Greenwell15] demonstrate this, his results also indicate that dynamic derivatives can show large variations with reduced frequency. This demonstrates that the quasi-steady model will begin to become inaccurate as unsteady flow effects begin to dominate the aerodynamics.
The SID modeling accuracy depends on the model structure and how the model unknowns are estimated. For the latter, the system is usually perturbed with an appropriate input signal and the input/output data are used to estimate the model parameters. For example, for an indicial response aerodynamic model, the indicial parameters are estimated from the system response to a unit step change in input parameters [Reference Ghoreyshi, Jirásek and Cummings16, Reference Ghoreyshi, Lofthouse, Findlay and Lee17]. Note that the input signal simulation in CFD should use accurate time-integration schemes. In this study, an extended derivative-based aerodynamic model is considered. For more detail, the reader is referred to Refs. [Reference Klein and Morelli18, Reference Allen and Ghoreyshi19].
The accuracy of the model will also depend on the input signal (here referred to as training manoeuver). The quasi-steady SID modeling of this work follows a specific process. First, a training manoeuver (a computational “test-flight”) is completed in CFD using time-accurate simulations. The training manoeuver will vary all flight parameters of interest, often simultaneously, to generate training data. Once the manoeuver is complete, models can be constructed using any desired technique by comparing the variations of the inputs with the calculated integrated loads (the aerodynamic coefficients). Note that each static simulation for estimation of S&C characteristics typically needs several thousand time steps to converge. In contrast, a training manoeuver simulation that sweeps over the range of an input parameter costs about the same as a few static runs. Note that while training manoeuvers should use time-integration schemes, static simulations could either be spatially converged using any time-stepping scheme for steady conditions or a time-accurate unsteady simulation for unsteady flows.
Forced motion (also known as prescribed motion) is a numerical technique used in CFD solvers where the grid is numerically translated and rotated with respect to the reference conditions of the simulation. This allows for the free-stream velocity to be manipulated to any desired speed and any incident angle with time accuracy. This creates the opportunity to use a forced motion to vary Mach number, angle-of-attack, linear accelerations, and angular rates in a single computation. A forced motion can be thought of as a computational flight test, but without the flow (e.g., post stall) and kinematic restrictions (e.g., G-force) of the aircraft or pilot.
In this work, a training manoeuver is considered with input parameters of angle-of-attack, side-slip angle, q (pitch rate), and
 $\dot \alpha $
(angular velocity effects) at a constant Mach number. In this work, only the integrated aircraft loads, lift force coefficient,
 ${C_L}$
, and pitch moment coefficient,
 ${C_m}$
, are studied. I.e., only angle-of-attack, side-slip angle, and pitch angle undergo independent motions. The motion is defined as a chirp which has a constant amplitude but increasing frequency in time. The aerodynamic data are modelled using regression models of the form
 \begin{align} {C_j}(\alpha ,\beta ,\dot \alpha ,q) &= {\beta _0} + {\beta _1}\alpha + {\beta _2}{\alpha ^2} + {\beta _3}{\alpha ^2} + {\beta _4}{\alpha ^4} + {\beta _5}{\alpha ^5} + {\beta _6}\beta + {\beta _7}\dot \alpha + {\beta _8}q \nonumber \\[5pt] & \quad { + {\beta _9}{\beta ^2} + {\beta _{10}}{\beta ^3} + {\beta _{11}}\alpha \beta + {\beta _{12}}\alpha \dot \alpha + {\beta _{12}}\alpha q,} \end{align}
where
 ${C_j} = [{C_L},{C_m}]$
and
 ${\beta _i}$
are fit coefficients which are found from the simulation results obtained using various input signals. The resulting models are then validated against steady CFD simulations.
3.0 Test cases
The ONERA LRM is used in this study. The LRM is a modified version of the NASA CRM geometry which is a generic commercial transport configuration. The CRM design development was detailed by Vassberg et al. [Reference Vassberg, DeHaan, Rivers and Wahls9]. In 2008–2009, the CRM Wing/Body/Nacelle/Pylon/Horizontal-Tail Configuration was provided to the participants of the fourth CFD drag prediction workshop. This CRM geometry was simultaneously tested at NASA Langley National Transonic Facility and the NASA Ames 11-ft wind tunnel [Reference Rivers and Dittberner20].
The LRM was designed by ONERA and is based on the NASA’s CRM model which was used in the DPW-IV. It is a 220% scaled model of the CRM model and has no pylons and nacelles. The shape of the wings was rebuilt by ONERA to match the cruise conditions of the LRM model in the S1MA wind tunnel to those reported for the CRM model tested at NTF, i.e.
 ${C_L} = 0.5$
for Mach 0.85 and Reynolds number of 5 million. A vertical tail was designed and added to the LRM. The vertical tail design was based on the Boeing 777-200 planform [Reference Cartieri21]. A flow feature of interest of the LRM is flow separation at the wing trailing-edge/body junction that has been addressed in Drag Prediction Workshops [Reference Cartieri21]. The effects of grid refinement and turbulence model to capture this separated flow were documented in [Reference Hue22, Reference Hue, Péron, Wiart, Atinault, Gournay, Raud, Benoit and Mayeur23]. The LRM model is shown in Fig. 1. The model has a reference area of
 $2098.39\;{\rm{i}}{{\rm{n}}^2}$
. The wing full span and mean aerodynamic chord measure 137.42 and 16.38 inches, respectively. The moment reference point was set to 78.76, 0.0, 10.57 inches and is also shown in Fig. 1. Two geometries were used: with and without the sting. The sting model used in the S1MA experiments is shown in Fig. 1 as well.
Test case, sting geometry, and moment reference point.

4.0 Experimental apparatus
Wind tunnel experiments of the LRM were conducted at ONERA’s S1MA test facility which is a continuous atmospheric wind tunnel operating in the subsonic and transonic regimes. The wind tunnel test section has a circular cross section with 8m diameter and a length of 14m. These tests took place in 2014 [Reference Cartieri, Hue, Chanzy and Atinault10] to 2019 [Reference Cartieri11], including different combinations of components, e.g. wing-body, wing-body-horizontal tail, etc. Measurements include integrated forces and moments, surface pressure, and surface flow visualisations for Mach numbers in the range of 0.3 to 0.95. Pressure distributions were measured on both the port and starboard wings using 270 pressure ports located in nine spanwise wing stations, five on the starboard side at
 $\eta $
= 0.131, 0.283, 0.502, 0.727 and 0.950, and four on the port side,
 $\eta $
= 0.201, 0.397, 0.727 and 0.846, where
 $\eta = y/s$
, y is spanwise position and s is the half span.
Test conditions used in this study correspond to
 ${C_L} = 0.5$
at Mach numbers of M = 0.70, 0.83, 0.87 and 0.90 corresponding to Reynolds numbers of 4.26, 4.56, 4.61 and 4.68 million, respectively. The measured turbulence intensity in the wind tunnel is less than 0.4%. The reference temperature is
 ${100^{\circ}}{\rm{F}}$
. The side-slip angle was varied at 0, 1, 3 and
 ${5^ \circ }$
. Mach numbers and Reynolds numbers were then corrected for buoyancy and wall effects. The corrected Mach numbers are M = 0.7019, 0.8325, 0.8530, 0.8749 and 0.9050 corresponding to Reynolds numbers of 4.24, 4.56, 4.60, 4.62 and 4.70 million, respectively. Four cases are considered in this study:
-
• Case 01: A verification study using a 2D NACA0012 Aerofoil.
-
• Case 02: A LRM grid convergence study in which the objective is to calculate the drag, side force, pitching moment, yawing moment and rolling moment for the LRM with the tunnel mounting sting. Flow conditions are:
$\beta { = 1^ \circ }$
nose left;
${\rm{M}} = 0.8325$
; Re = 4.56 million and fixed
${C_L} = 0.5$
. -
• Case 03: A LRM Mach effect study in which the objective is to calculate the drag, side force, pitching moment, yawing moment and rolling moment for the LRM with the tunnel mounting sting. Flow conditions are
$\beta { = 1^ \circ }$
,
${\rm{M}} = $
0.7019, 0.8325, 0.8530, 0.8749 and 0.9050 corresponding to Reynolds numbers of 4.24, 4.56, 4.60, 4.62 and 4.70 million, respectively.
${C_L}$
is fixed at 0.5. -
• Case 04: Wind tunnel sting study in which the objective is to calculate the pitch moment of the LRM with and without the tunnel mounting sting. Flow conditions are:
$\beta { = 0^ \circ }$
;
${\rm{M}} = 0.8325$
; Re = 4.56 million;
${\rm{Reference}}\;{\rm{temperature}} = 100^{\circ} {\rm{F}}$
at two fixed
${C_L}$
values of 0.48 and 0.52.


All cases were analysed in the workshop, but only Cases 02-04 are detailed in this study because Case 01 uses a 2D aerofoil. Experimental data are only available for Cases 02 and 03. Experimental tests covered a Mach number range going from 0.30 to 0.94. Tests were conducted at chord Reynolds number of 1.8, 2.1, 2.5, 3 and 3.6 million. angle-of-attack was varied from
 $ - {3.0^ \circ }$
to
 $ + {6.0^ \circ }$
. Cartieri [Reference Cartieri11] detailed the experimental conditions. The CAD-cut strips were used to force boundary layer transition over different parts of the model. Trips measuring 1.3 mm in diameter and spaced 2.4 mm apart were used for the entire test. The measured forces and moments were corrected for these interference effects: (1) the empty test section correction, which is a Mach number correction that results from a test section tunnel calibration; (2) the buoyancy correction that takes into account the effects of the empty wind tunnel Mach number gradient on drag (which is proportional to the product of the gradient and the effective volume of the body); and (3) the wall effect correction.
5.0 Computational methods
5.1 Computational grids
Two set of grids were tested for the LRM configuration. The first set was generated by Kristen Karman-Shoemake of PointWise and provided to the workshop participants. These grids are called Common PW grids. The second set of grids was generated in PointWise by the authors. The common grids have different refinement levels ranging from a ‘Tiny’, containing approximately 20 million cells, to an ‘Extra-Fine’ grid with approximately 74 million cells. An additional Medium grid was generated around the LRM configuration but without the sting geometry. The USAFA grids include Coarse, Medium, Fine and Extra-Fine grids for the LRM with sting geometry. All grid details are given in Table 1.
Computational grids

Karman-Shoemake [Reference Karman-Shoemake24] has detailed the common PW grid generation process. A ‘Tiny’ common grid was generated first. The desired minimum grid resolution was estimated by creating several Coarse grids using hex-tet surface meshes and with different refinement locations. The surfaces grids are quad dominant using a largely automatic mesh algorithm. The surface grid was then further refined at regions with sharp feature edges to better resolve these areas, e.g. wing leading and trailing edges, the aft fuselage closure and the sharp trailing edge on the sting. A systematic refinement of the tiny mesh was then applied to generate the finer grid levels by using a refinement factor of 1.15. Geometry-related challenges were experienced at the Medium level, which required some surface mesh remediation to resolve the tolerance issues for that grid. The final surface mesh of the Medium grid is shown in Fig. 2(a). These surface grid modifications resolved the tolerance issues for the Fine and Extra-Fine levels as well, but led to the reproduction of Tiny and Coarse grids to ensure consistency between grids. A volume mesh was then created near the surface by growing anisotropic layers of prisms and hexahedra off the surface grid and then transitioning those cells into isotropic tetrahedra for the remainder of the volume. The non-dimensional first cell spacing from the wall,
 $y_1^ + $
, is about 0.1. The final volume mesh of the Medium grid is shown in Fig. 2(b).
Surface and volume grids of the Common PW Medium mesh. These pictures were generated by Karman-Shoemake of Pointwise [Reference Karman-Shoemake24].

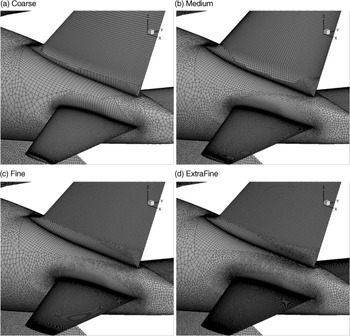
USAFA grids were generated in Pointwise as well. The full LRM geometry model with sting was imported to Pointwise. The surface mesh has refined cell regions near the leading and trailing edges as well as near the wing/fuselage and tail/fuselage junctures. Wherever possible, structured (quad) cells were generated on the surface, in particular on the wing and tail surfaces. The thickness of the first prism cell off the surface was set to 3.71E-5 in with a prism layer growth ratio of 1.25. Ninety prism layers were requested; however, the generation of the prism layers stopped once the cell size of the last prism layer was close to the cell size of the tetrahedral cell of the outer volume grid. The non-dimensional first cell spacing from the wall,
 $y_1^ + $
, is about 0.1.
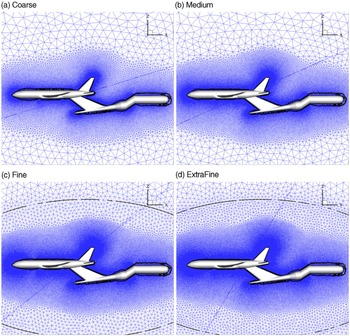
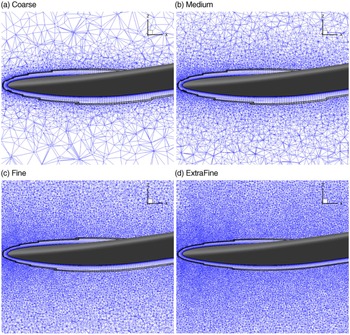
Four grid refinement levels were used: Coarse, Medium, Fine and Extra-Fine. The Coarse mesh had approximately 20 million cells, the Medium mesh 40 million cells, the Fine mesh 106 million cells and Extra-Fine mesh 200 million cells. Each successive mesh had approximately twice the number of volume cells of its predecessor. The Coarse mesh was generated first and then successively refined by refining its surface mesh by a factor of 1.25 in each spatial direction. Then a volume mesh was generated. During the refinement process, a control parameter was defined which controls the progression of small volume cells into larger cells to achieve the desired total number of volume cells. The initial prism layer spacing and the growth rate of the prism layer were unchanged during the refinement process. To guarantee the symmetry of meshes, only half the aircraft was used for mesh generation and then the mesh was mirrored along its symmetry plane. Grid details are shown in Figs. 3, 4 and 5.
Surface (USAFA) grids around tail.

Volume (USAFA) grid at the symmetry plane.

Volume (USAFA) grid over the wing.

5.2 CFD solver
Kestrel is the fixed-wing product of the CREATETM-AV program funded by the DoD High Performance Computing Modernization Program (HPCMP). The objective of the
 ${\rm{CREAT}}{{\rm{E}}^{{\rm{TM}}}}$
program is to improve the Department of Defense acquisition time, cost and performance using state-of-art computational tools for design and analysis of ships, aircraft and antenna [Reference Morton and McDaniel25]. Kestrel is specifically developed for multidisciplinary fixed-wing aircraft simulations incorporating components for aerodynamics, jet propulsion integration, structural dynamics, kinematics and kinetics. The code has a Python-based infrastructure that integrates Python, C, C++ or Fortran-written components [Reference Morton and McDaniel25]. Kestrel 10.4.1 is used in this work. The code has been extensively tested and a variety of validation documents have been reported [Reference McDaniel, Nichols, Eymann, Starr and Morton26].
Kestrel CFD solvers include kCFD [Reference McDaniel, Nichols, Eymann, Starr and Morton26], COFFE [Reference Glasby and Erwin27], and kCFD/SAMAir [Reference Eymann, Nichols, Tuckey and McDaniel28]. The kCFD flow solver is used in this study. kCFD uses a second-order accurate cell-centred finite-volume discretisation;, however, SAMAir utilises a fifth-order finite-volume discretisation on Cartesian meshes [Reference Glasby, Erwin, Eymann, Nichols, McDaniel, Karman, Stefanski and Holst29]. The kCFD flow solver solves the unsteady, three-dimensional, compressible Reynolds-Averaged Navier Stokes (RANS) equations using a second-order cell-centred finite-volume scheme on hybrid unstructured grids [Reference Morton, Tillman and McDaniel30]. The kCFD flow solver uses the Method of Lines (MOL) to separate temporal and spatial integration schemes [Reference McDaniel, Nichols, Eymann, Starr and Morton26]. The spatial residual is computed via a Godunov scheme [Reference Godnov31] and second-order spatial accuracy is obtained through a least squares reconstruction. The numerical fluxes at each element face are computed using various exact and approximate Riemann schemes with the default method based on the HLLE++ scheme [Reference Tramel, Nichols and Buning32]. In addition, the code uses a subiterative, point-implicit method (a typical Gauss-Seidel technique) to improve the temporal accuracy. Some of the turbulence models available within Kestrel include Spalart–Allmaras (SA) [Reference Spalart and Allmaras33], Spalart–Allmaras with rotational/curvature correction (SARC) [Reference Spalart and Shur34], Menter’s SST [Reference Menter35], and Delayed Detached Eddy Simulation (DDES) with SARC [Reference Spalart36].
An interesting capability of Kestrel is called “Target Coefficient Action.” For example, this capability could be used to trim an aircraft using control surfaces deflection to achieve a zero pitch moment coefficient. In this study, this action was used to hold the LRM configuration at a given
 ${C_L}$
value. The angle-of-attack was estimated and input in the code. A pitch motion will then be selected in which the model will rotate until the lift coefficient reaches the target value with a given tolerance value.
5.3 Computational setup
In all simulations, Kestel version 10.4.1 and SARC with DDES turbulence model were used. Flow conditions correspond to SCPW cases 02-04. For static simulations, three Newton subiterations were used. For training motions, five Newton subiterations were used as recommended by the Kestrel User Guide for motion simulations. Second-order spatial and temporal accuracy was used. Temporal damping was set to 0.025. For static and motions simulations, the time step was set to 0.0001 s and 0.0005 s, respectively. Note that a smaller time step will require more iterations to simulate the complete time history of the input signal. Grid axis is x back, y right, and z upward; however, forces and moments were calculated in the stability axis. A desired condition of the wind tunnel is to keep
 ${C_L}$
at a fixed value. Kestrel usually asks for aerodynamic angles of attack and side-slip. In order to maintain the
 ${C_L}$
at a given value, the Target Coefficient Motion utility in Kestrel was used.
6.0 Results and discussions
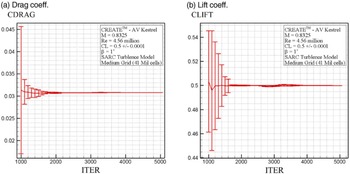
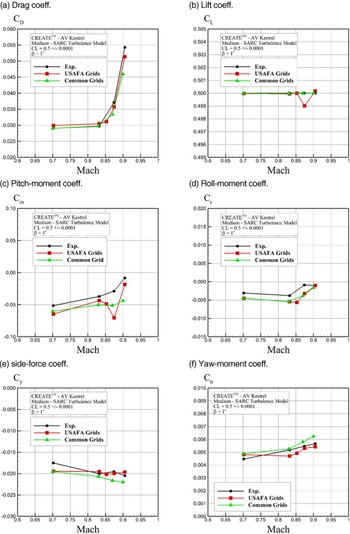
First results are presented for the Case 02 using the SARC turbulence model on the Medium USAFA grid. Figure 6 shows drag and lift coefficient convergence. The target lift coefficient was set to 0.5 with an estimated angle-of-attack of
 ${2.94^ \circ }$
at one degree side-slip angle and a Mach number of 0.8325. In this figure, the mean and convergence bounds are plotted. Note that Target Coefficient Motion detects the convergence to the target values and automatically stops changing the orientation. The convergence bound is the sensitivity of the coefficient changes due to body rotation. Figure 6 shows that there are large bounds initially which become smaller and eventually vanish as the lift coefficient reaches 0.5. Note that the number of regular iterations were set to 4,500 with 500 initial startup iterations. If the Target Coefficient Motion terminates at a smaller iteration count due to convergence, the CFD simulation continues for the full 5,000 iterations.
(a) Drag and (b) lift convergence for Case 02 using the Medium grid and the SARC turbulence model. CLIFT and CDRAG are in the wind axis.

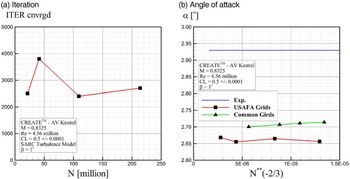
Kestrel reports the time step (or iteration) at convergence of each simulations. The converged iteration values are plotted in Fig. 7(a) for USAFA grids (Tiny to Extra-Fine). Figure 7(a) shows that convergence was achieved for all tested grids to achieve
 ${C_L} = 0.5$
. Figure 7(b) shows the converged angle-of-attack plotted against ONERA’s wind tunnel data using both Common and USAFA grids. Predicted angles of attack from CFD are smaller than the wind tunnel value. Wind tunnel data are about
 ${2.94^ \circ }$
but CFD predicts about
 ${2.7^ \circ }$
. The difference between experiments and USAFA Medium grid and Common Medium grid predictions are 9% and 78%, respectively. Note that grid convergence was achieved with the Medium grid since values did not change significantly for finer grid levels.
(a) Iteration number at convergence and (b) angle-of-attack for Case 02 using USAFA Medium grid and SARC Turbulence model.

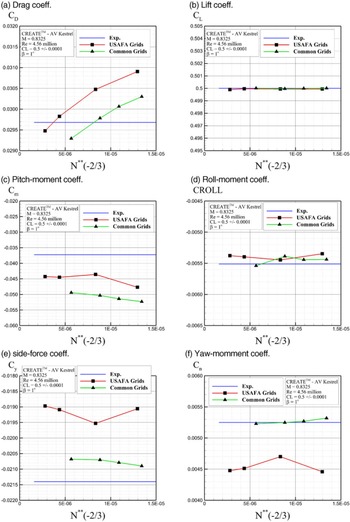
Figure 8 shows the predicted longitudinal and lateral coefficients in the stability axis from the Common and USAFA grids for Case 02. Figure 8(a) shows that drag becomes smaller and gets closer to the experimental values by refining the grids. The convergence rate is better for the Common grids than the USAFA ones. There is about a 10 drag count change between the Medium and Extra-Fine USAFA grids. The difference between experimental drag coefficient and predictions from the USAFA and Common Medium grids is 2.68% and 0.35%, respectively. Figure 8(b) shows that all grids reached
 ${C_L} = 0.5$
. The pitch moment seems to be converged for the Medium grid as shown in Figure 8(c). CFD data, however, underestimate the measured data. USAFA grids match better with wind tunnel data than the Common grids. The difference between the experimental pitch-moment coefficient and predictions from USAFA and Common Medium grids is 17% and 35%, respectively. Figure 8(d) shows that the CFD roll moment predictions match well with experiments. Figures 8(e) and (f) show that the USAFA grids predicted less-negative side-force coefficient and smaller yaw moment coefficient than experimental values and Common grids. The USAFA Medium grid predicts a 1.2% difference in the roll moment coefficient, 8% in the side force coefficient, and 10% in the yaw-moment coefficient. Future S&C workshops are looking at moment predictions to better understand differences seen between predictions and measurements.
Converged force and moment coefficients for Case 02 using SARC Turbulence model. All coefficients are given in the stability axis.

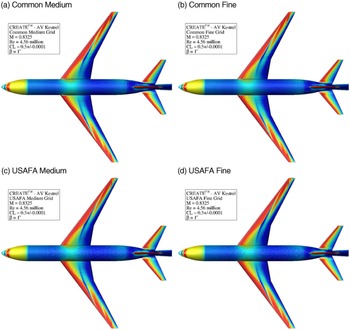
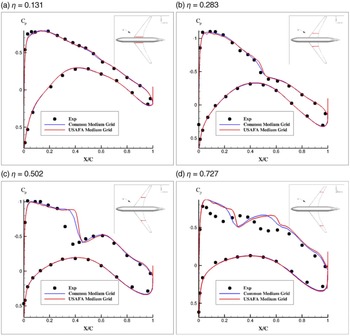
Figure 9 compares the surface skin friction contours for the Medium and Fine grid simulation for Case 02. The figure shows very similar surface data and shock position for all grids. In particular, Fig. 10 compares the pressure coefficient data at four starboard spanwise positions with experimental data given by Cartieri et al. [Reference Cartieri21] for one degree side-slip angle at Mach 0.8325. Figure 10 shows that the Common and USAFA Medium grids predict very similar trends for surface pressure data at all locations. The lower surface data match well with experimental data but some discrepancies can be seen on the upper surface. Specifically, CFD shows a further downstream shock position compared with the wind tunnel data for spanwise locations
 $\eta = 0.502$
and
 $0.702$
. Cartieri et al. [Reference Cartieri21] also observed that from
 $\eta = 0.502$
up to the wingtip, the CFD shock is located farther downstream than what is observed in experiments. A possible reason for this discrepancy is the lack of a grid resolution at the shock position. The grids used in this study have a uniform cell size at the wing mid section. Refining the grid at and around the shock position will likely improve the shock location prediction. A grid adaptation method by Hiller and Bozeman [Reference Hiller and Bozeman37] helped to better resolve the shock features on the wing and tail components of the LRM test cases.
Surface skin friction contours for Medium and Fine grids. Case 02 using SARC Turbulence model.

Surface pressure coefficient data for Common and USAFA Medium grids. Case 02 using SARC Turbulence model. Only starboard data are shown.

Next, results are shown for Case 03 in which the objective is to calculate the drag, side force, pitching moment, yawing moment and rolling moment for the CRM with the tunnel mounting sting. Flow conditions are
 $\beta { = 1^ \circ }$
,
 ${\rm{M}} = $
0.7019, 0.8325, 0.8530, 0.8749 and 0.9050, corresponding to Reynolds numbers of 4.24, 4.56, 4.60, 4.62 and 4.70 million, respectively.
 ${C_L}$
is fixed again at 0.5. Both Medium-Level Common and USAFA grids were tested; the Common grid was run for uncorrected Mach numbers (they were specified in the initial workshop documents) and the USAFA grids for the corrected ones. (the corrected values were provided after the workshop). The coefficients were predicted for a
 ${C_L} = 0.5$
and are shown in Fig. 11. Good agreement was found with experimental data for all coefficients. The simulation with the USAFA Medium grid had difficulty to reach the target
 ${C_L}$
value of 0.5 for Mach 0.8749. CFD data show larger negative values for pitch moment and roll moment than those observed in the wind tunnel data. Apart from Mach 0.8749, both grids predicted the trends and values correctly.
Converged force and moment coefficients for Case 03 using SARC Turbulence model. All coefficients are given in the stability axis.

Figure 12 shows the effects of the sting on the pitch moment of the LRM. This corresponds to Case 04 in which the Medium Common grids with and without sting geometry were tested for two scenarios: in the first, simulations were performed for fixed
 ${C_L}$
values of 0.48 and 0.52 at zero side-slip angle. In the second scenario, simulations were performed for given angles of attack of 2.9 and
 ${3.0^ \circ }$
. Figure 12 shows that the sting results in a fixed pitch moment increment of predicted values.
Sting effects on pitch moment predictions for Case 04 using Common PW Medium grid and SARC Turbulence model. All coefficients are given in the stability axis.

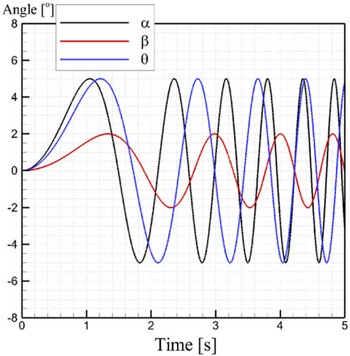
Finally, a system identification technique was tested to predict the LRM stability derivatives using a training manoeuver. The training manoeuver is a 5s chirp motion in which the angle-of-attack, sideslip and pitch angle follow different and independent sinusoidal motions. The motion frequency of these motions increases in time. The amplitude is 5 degrees for angle-of-attack and pitch angle and 2 degrees for the side-slip angle. The training maneuver is shown in Figure 13. This motion was run in CFD using the Medium Common and USAFA grids and then was used to create a regression model using MATLAB. The model was then used to predict the static and dynamic stability data of the LRM at given Mach number and different angles of attack and side-slip.
Chirp input signal.

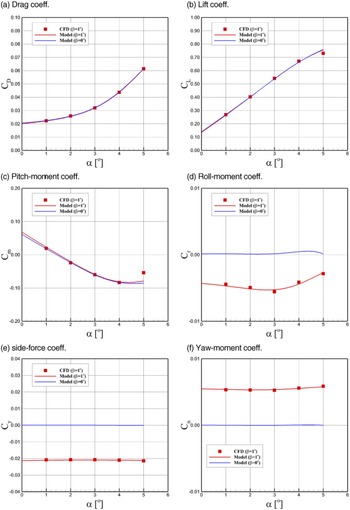
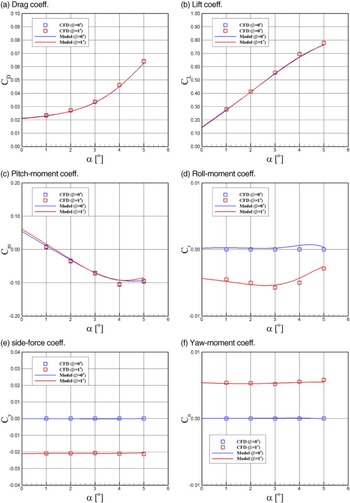
Additionally, Static CFD data were obtained to validate model predictions. The model predictions and static CFD data are shown in Figs. 14 and 15 for the Common and USAFA grids, respectively. Note that the cost of creating the model (simulation of training manoeuver) is approximately equivalent to two static CFD simulations. Figures 14 and 15 show that model predictions match well with static data for the tested conditions and the model predicts the nonlinear behaviour seen at high angles of attack. Additionally, the model was used to predict the pitch-rate derivatives of the LRM using the Common grid; these data are shown in Fig. 16, which shows
 ${C_{Lq}}$
and
 ${C_{mq}}$
changes with the angle-of-attack.
SID predictions of static data compared with CFD data using Common PW Medium grid and using SARC Turbulence model. Mach number is 0.83 and Reynolds number is
 $4.56 \times {10^6}$
. All coefficients are given in the stability axis.

SID predictions of static data compared with CFD data using USAFA Medium grid and using SARC Turbulence model. Mach number is 0.8325 and Reynolds number is
 $4.56 \times {10^6}$
. All coefficients are given in the stability axis.

SID predictions of pitch-rate derivatives.

7.0 Conclusions
This study shows the Kestrel CFD predictions for the test cases of 1st AIAA Stability and Control Prediction workshop. Test cases correspond to a scaled model of the well-known CRM tested at ONERA. Three different cases were considered: (1) fixed
 ${C_L}$
and Mach number to study the grid resolution effects; (2) fixed
 ${C_L}$
at different Mach numbers to investigate the Mach number effects on the stability and control characteristics of the LRM; and (3) models with and without sting to highlight the sting effects. Static CFD data were generated for two set of grids and the predictions were compared with available experimental data.
The results showed that grid convergence was achieved by using the Medium grid refinement level. Kestrel used a pitch motion capability to achieve the target lift coefficient values. The flow features and surface pressure data were detailed and Mach number and sting effects were described.
A system identification technique was adopted to predict S&C characteristics of the LRM for different angles of attack and side-slip at a fixed Mach number. The input signal used to build the model is a chirp motion with independent oscillations of angle-of-attack, side-slip, and pitch. The motion simulation cost is equivalent to two static CFD runs. The model predictions were then compared with static CFD data and very good agreement was found.
Acknowledgments
This material is based in part on research sponsored by the US Air Force Academy under agreement numbers FA7000-17-2-0007 and FA7000-20-2-0014. The U.S. Government is authorized to reproduce and distribute reprints for governmental purposes notwithstanding any copyright notation thereon. The views and conclusions contained herein are those of the authors and should not be interpreted as necessarily representing the official policies or endorsements, either expressed or implied, of the organizations involved with this research or the U.S. Government. The numerical simulations have been performed on HPCMP’s Onyx cluster located at the ERDC DoD Supercomputing Resource Center (DSRC). Tecplot pictures were generated using the HPCMP’s Secure Remote Desktop utility on centennial. The authors would like to thank Dr. Andrew Lofthouse of AFLCMC and Dr. David McDaniel of HPCMP CREATE for helping us to set up the Kestrel simulations for these cases.