Introduction
The National Climatic Data Center1 estimates that economic losses from drought and heat waves cost the USA more than $180 billion from 1980 to 2009, with a majority of losses incurred in the agricultural sector. The State of Nebraska's agricultural drought losses alone topped $1.2 billion in 2002, which was the peak of a multi-year drought from 1999 to 2007Reference Hayes, Svoboda, Knutson and Wilhite2. These numbers illustrate the high vulnerability of conventional US agriculture to recurrent drought.
Drought becomes a disaster when it overwhelms the capacity of people and the environment to accommodate adverse conditionsReference Wilhite and Wilhite3. The characteristics of populations, activities and the environment that make them susceptible to the effects of drought, referred to as vulnerabilities, are related both to biological/physical and social factorsReference Liverman4. Biological and physical factors, such as soil type, soil biodiversity, availability of surface or groundwater for irrigation and probability of seasonal crop moisture deficiency, affect a farm's vulnerability to droughtReference Wilhem and Wilhite5. These relationships are fairly straightforward. However, social factors (e.g., the influence of the farmer and the farming system) may be as or more important to a farm's vulnerability to drought, and are less well understoodReference Luersa, Lobella, Sklard, Addamsa and Matsona6. The literature on natural hazards vulnerability proposes that human factors or coping abilities, such as a farm's asset base, labor capacity, community resources or social capital and manager knowledge may help to lessen an agricultural operation's vulnerability and associated drought impactsReference Wilhite, Buchanan-Smith and Wilhite7.
Along this line of reasoning, it is argued that sustainable agriculture systems may be less vulnerable to climate risk than conventional systems. ‘Sustainable agriculture’ is defined by the United States Department of Agriculture as ‘an integrated system of plant and animal production practices that satisfies food and fiber needs, enhances environmental quality and natural resources, integrates, where appropriate, natural biological cycles and controls, and sustains the economic viability of farm operations’8. Another dimension of sustainable agriculture is added by scholars who propose that ‘… sustainable agriculture is not just a set of practices but a process requiring skills of adaptability’ (see Wall and SmitReference Wall and Smit9, p. 116). In general, the linkages between adaptive capacity in sustainable agriculture systems and reduction of drought risk are not well understood.
In this paper, we explore the effect of sustainable agricultural systems and practices, as well as farm policies and programs, on farm vulnerability to drought. Our research questions include:
• How do producers use sustainable practices as drought mitigation tools?
• Do farmers who use sustainable practices see significant benefits during drought?
• How do insurance and federal farm programs affect the use of sustainable practices to mitigate drought?
• What barriers do producers perceive in using sustainable practices to mitigate drought?
A better understanding of how some agricultural producers use sustainable agriculture practices to mitigate drought will help more producers and advisors better address drought vulnerability in agriculture.
Literature review
Research on organic farming methods demonstrates the connections between improved soil structure, increased organic matter and drought vulnerability. Research trials have shown that organic farming methods can produce higher yields during drought years than conventional (non-organic) farming methodsReference Lotter, Seidel and Liebhart10, Reference Sahs and Lesoing11.
Increased levels of organic matter and improved soil structure, including soil aggregation, have been demonstrated under organic fertility-building schemes, rotation cropping and conservation tillage methods, resulting in greater soil water-holding capacity and infiltrationReference Sullivan12–Reference Zibilske and Bradford14. Residue left on the soil surface (through reduced tillage, mulching or use of groundcovers) has been shown to improve drought resilience by decreasing evaporation rates, increasing water infiltration, and reducing raindrop impact and runoff velocityReference Blevins, Lal, Doran, Langdale, Frye, Pierce and Frye15, Reference Unger, Sharpley, Steiner, Papendick, Edwards, Pierce and Frye16. Minimum tillage has also been shown to improve plant-rooting conditions, increasing water-use efficiencyReference Sullivan12.
Soil biodiversity, including mycorrhizal associations, has been shown to positively impact water-use efficiency of plants and help plants deal with drought stressReference Lotter, Seidel and Liebhart10, Reference Brussaard, de Ruiter and Brown17. Organic farming techniques support biologically active soil; minimum tillage techniques can also increase soil biodiversityReference Altieri18. Genetic and crop diversity, in the form of crop rotations, intercropping or integrating livestock, have been shown to benefit producers in drought-stressed areas by including genotypes, crops or animals that are less sensitive to the stress or that minimize risk under different types of weatherReference Jackson, Pascual and Hodgkin19–Reference Di Falco and Chavas21.
Farm adaptability has also been proposed as an important link between sustainable agriculture and drought vulnerabilityReference Wall and Smit9, Reference Niggli, Earley and Ogorzalek22, Reference Borron23. Adaptation, defined by Smidt and SkinnerReference Smidt and Skinner24 (p. 6) as ‘adjustments in ecological–social–economic systems in response to actual or expected climatic stimuli, their effects or impacts’, is multi-dimensional. For example, adaptations to drought may be carried out in anticipation of, concurrently with, or in response to a drought event. Adaptations may be undertaken for a short-term duration or a long-term durationReference Smidt and Skinner24, Reference Bradshaw, Dolan and Smit25.
Smidt and SkinnerReference Smidt and Skinner24 argue that in order to help agriculture adapt to climate-related risks such as drought, research should focus on increasing the adaptive capacity of producers rather than prescribing specific adaptation measures. Economic conditions and farm programs and policies are two social factors that may positively or negatively impact farmers’ ability to adapt to drought. A recent study of organic farmers’ views of risk management highlighted an ambivalent relationship between organic producers and federal crop insuranceReference Hanson, Dismukes, Chambers, Greene and Kremen26. More research is needed to better understand the adaptive potential of farmers to drought in the context of real-world settings.
Research methods
To explore the relationship between sustainable agriculture practices, farmer adaptation and drought, members of two sustainable agriculture organizations in Nebraska were surveyed and interviewed during the spring and summer of 2005. During this time, producers were still experiencing the lingering effects of a multi-year drought that had begun in 1999 and peaked during 2002, which was the third driest year in Nebraska's recorded history (only 1934 and 1936 were drier). Although causing significant losses and hardship, the severe drought offered an important opportunity to investigate producers’ perceptions about impacts to their operations, and how their farming and livestock production methods did or did not lessen the effects of drought.
Producer responses were obtained through a mail survey and follow-up personal interviews drawn from the survey sample. The survey sample included ‘mailing list members’ of two Nebraska sustainable agriculture organizations: the Nebraska Sustainable Agriculture Society and the Nebraska Organic Crop Improvement Society. The Nebraska Sustainable Agriculture Society is a non-profit membership organization whose mission is to ‘promote agriculture and food systems that build healthy land, people, communities and quality of life for present and future generations’ by promoting ‘farming practices which decrease soil erosion, increase soil fertility, reduce the need for off-farm inputs, protect natural resources and encourage a diverse landscape’27. The Nebraska Organic Crop Improvement Association is a local chapter of OCIA International, a non-profit, member owned, international organic certification agency. OCIA International defines organic agriculture as ‘farming that maintains and replenishes soil fertility without the use of pesticides and chemical fertilizers’28. Since there is no comprehensive list of farmers in Nebraska who practice sustainable agriculture, it was felt that these mailing lists would represent a good coverage of those producers committed to implementing sustainable practices.
A prototype of the survey instrument was drafted and subsequently tested by a group of ten sustainable farmers and advisors in November of 2004. Once their comments were incorporated and the final survey instrument was completed, it was mailed to the 230 mailing list members across the State of Nebraska, USA, during March of 2005. Thirty of the surveys were either returned as undeliverable or respondents reported it did not apply to them since they were retired or only a supporting member of the organization. This resulted in a sample pool of 200 mailing list members. Of the 200 members, 42 returned the survey for an aggregate response rate of 21%. Thirty-eight of the surveys were considered to be valid because the respondents met the USDA and U.S. Census Bureau definition of a ‘farmer’ (producing over US$1000 worth of commodities per year), and the survey was adequately completed. This resulted in a return rate of 19%, although an accurate response rate is difficult to quantify because additional people on the mailing lists may also be retired or merely urban financial contributors to the organizations (M. Kleinschmidt, Center for Rural Affairs, personal communication, June 2006). Therefore, the actual response rate may have been larger.
Because the focus of this paper is on crop farming techniques, the authors analyzed a subset of returned surveys from producers who said that they grew crops, excluding those who said that they only grew forage for livestock. This article focuses on the 32 valid surveys returned from those identifying themselves as crop farmers. These producers were asked a mix of open-ended, yes/no, and ranking questions on the following themes:
• What practices have been implemented that would be considered ‘sustainable'?
• What practices have been implemented specifically to reduce the effects of drought?
• How effective are these practices in reducing the effects of drought?
• What role do insurance and federal farm programs play in determining management methods during drought years?
• What barriers do sustainable producers experience in attempting to mitigate and respond to drought?
Standard statistical analysis of yes/no and ranking questions was done using Predictive Analysis Software (PASW) Statistics 18. Binomial tests were used to determine significance of respondents ‘yes/no’ answers to questions about changes during drought and perceptions of the effectiveness of their practices. Paired samples tests were used to determine the significance of differences between reported barriers to using sustainable practices. We used an alpha level of 0.05 for all statistical tests. The responses to open-ended questions were coded by two researchers to identify overarching themes, and compared to ensure inter-coder reliability.
To further explore issues that arose in the survey results, the investigators also conducted personal interviews within the same pool of producers who received the survey. Along with the mail survey, a postcard was mailed to the survey sample, asking them to return the postcard if they were willing to participate in a face-to-face interview. As a result, 15 producers were interviewed between June and August of 2005. The interview process followed a semi-structured format. This technique calls for a general list of open-ended questions to be asked, but is flexible enough to allow the interviewer or informant to follow new leadsReference Bernard29. During the interviews, producers were asked to expound on ideas mentioned in the previous mail-back survey, including practices they implemented to reduce the effects of drought, the effectiveness of these practices and what barriers they encounter. The interviews were tape recorded, transcribed and hand coded to highlight themes in the responses. Themes are recurrent and distinctive features of participants’ accounts, characterizing particular perceptions and/or experiences, which the researcher sees as relevant to the research questionReference King and Horrocks30. In a standard cross-case analysis, participant responses to each question were compared to identify major themes and relevant quotes. The interview results are used in this paper to provide contextual depth and specific examples to help explain the survey results.
Survey and Interview Results
Population sample characteristics
Survey respondents ranged from small specialty crop producers to commercial farm operations. Landholdings ranged from under 0.8 ha (2 acres) to 485 ha (1200 acres), with a median size of 67 ha (165 acres). Respondents were between 31 and 88 years of age, with an average age of 52. They reported an average of 27 years of farming experience, with a range of 1–55 years. Twenty-two respondents (69%) held at least a bachelor's degree, a higher percentage than rural Nebraska as a whole (16.9% holding at least a bachelor's degree in 2000)31.
Gross sales by farm/ranch also varied considerably, with the mode being US$10,000–49,000 (31% of respondents), followed by US$175,000–249,999 (19% of respondents). Respondents’ farm/ranch income as a percentage of total household income was evenly distributed from 10 to 100%. Fifty-nine percent of respondents were full owners of their property, similar to Nebraska's statewide average in 2007 (50% of Nebraska farmers were full owners)31.
Of the 32 valid surveys returned, 14 (44%) of the surveys were from producers who raise only grain or vegetable/fruit crops, and 18 (56%) of the surveys were from producers who raised both crops and livestock. Twenty-one (66%) of the respondents produced organic commodities. Crops grown by respondents included corn (Zea mays L. var. indentata), blue corn (Z. mays L. var. amylacea), popcorn (Z. mays L. var. everta), soybeans (Glycine max L.), barley (Hordeum vulgare L.), alfalfa (Medicago sativa L.), spring wheat (Triticum aestivum L.), winter wheat (T. aestivum L.), oats (Avena sativa L.), clover (Trifolium), fruits, vegetables and flowers, demonstrating a diversity of crop choice. Livestock raised included cattle, chicken, swine, turkey, sheep and bison.
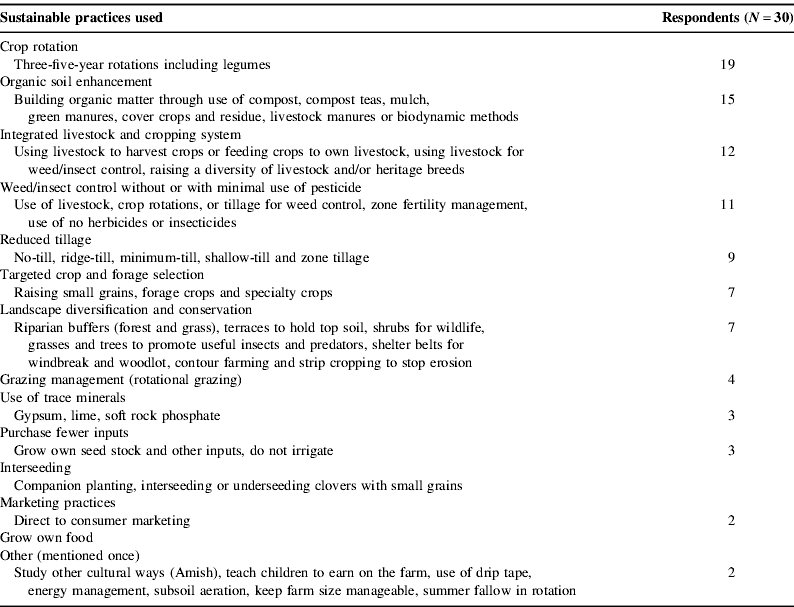
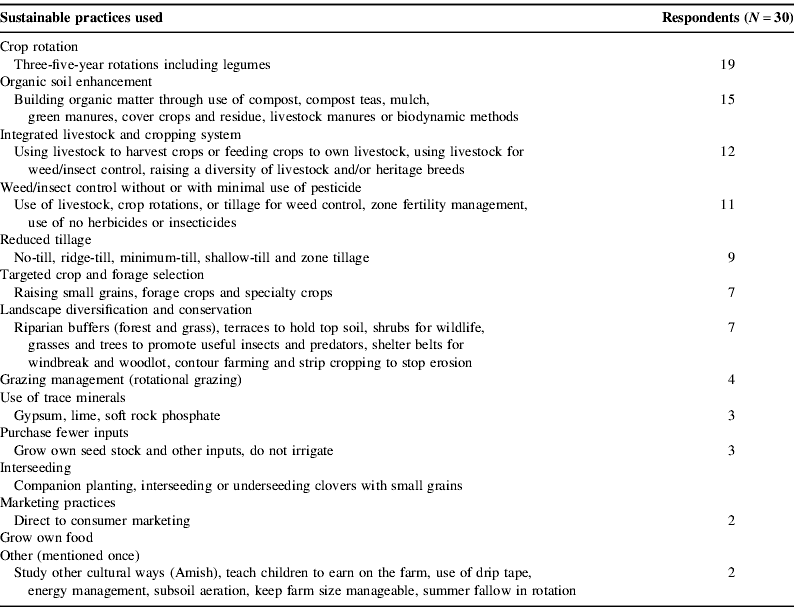
As shown in Table 1, when asked what practices they had implemented that they would consider ‘sustainable’, producers reported a wide range of practices that are compatible with the previously cited definitions of sustainable agriculture, such as the use of crop rotations (63% of respondents), organic soil enhancement methods (50%), integrated livestock and cropping systems (40%), minimizing or eliminating chemical insect and weed control (37%), reduced tillage (30%), targeted crop and forage selection (23%) and landscape diversification and conservation practices (23%). Table 1 also provides a list of practices mentioned by 10% or less of the surveyed producers. Although these practices were not mentioned as frequently, they were seen as important sustainable practices.
Practices respondents have used that they would consider sustainable.
Practices that reduce the effects of drought
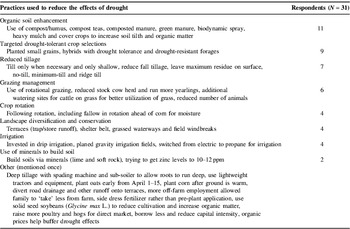
Producers were also asked to report on the types of actions they have implemented with drought risk reduction in mind (Table 2). Eleven respondents (35%) listed organic soil enhancement methods such as the use of compost, mulch, cover crops and green manures to reduce the effects of drought. One producer interviewed said, ‘I plant rye [Secale cereal L.] into corn [Z. mays L. var. indentata] and oats [A. sativa L.] into soybeans [G. max L.] as “green manure”. I also use a combination of dry and liquid products, which I apply before planting to add minerals and nutrients to the soil. This type of practice helps during drought because you build up the soil allowing more water-holding capacity’.
Practices used specifically to reduce the effects of drought.

The use of specific (more drought tolerant) crops was listed by nine respondents (30%), and another four (13%) specifically mentioned using their crop rotation to reduce drought risk. For example, a producer noted during the interview that ‘small grains have helped us tremendously. Typically, small grains aren't affected as much in drought. You'll have a yield loss, but not a catastrophic yield loss’. Another person said, ‘One thing I find is that you need diversity. In a dry year you may lose some on corn [Z. mays L. var. indentata], but the small grains will get you through. The diversity and rotation pulls you through the dry years’. A producer also described how crop choice helps their grazing system, saying ‘I know that if we run out of grass, I'll find someplace else to graze. We can use some of our crops. I think when you're options are open, that's your best insurance’.
Seven survey respondents (23%) mentioned reduced tillage to minimize the effect of drought. Several different types of tillage strategies and equipment were described during the personal interviews, all used with the goal of minimizing ground disturbance. One producer described their use of a chisel plow, explaining, ‘A chisel plow under-cuts the vegetation to leave residue on top to act like a blanket to hold in the moisture. With the chisel plow you don't have to go as deep. I use wide sweeps to cut out the root crown’. Another producer preferred a blade plow, saying ‘It just goes under the bottom of the soil and it leaves all the trash and everything on top’. Another used a harrow, saying, ‘I prefer larger chunks on the top so that the water can soak in quicker, so what I use is a harrow with long spring tines on it that sort of vibrate and stir the soil around. It loosens the big clods and pushes the soil right up against the bean plants’.
One producer described using several tillage techniques, saying ‘I use a ridge till sometimes, a conventional till sometimes, and make use of no-till on a limited basis … I'd say I kind of use a tillage rotation. I like to use the ridge till because it uses less tilth. Using a ridge till moves last year's weed seeds out of the row, but it does this while maintaining the residue structure. It keeps the residue on top instead of incorporating it so that little moisture is lost during the process. On the dry land though, I keep the ridges lower because you lose less water when the ground is relatively flat’. Another farmer described using zone tillage, explaining, ‘with zoned tillage you skip a tillage operation on a hill with low residue to reduce moisture loss and avoid reducing what little residue is there’. Summarizing the goal of minimizing soil disturbance, one producer stated that they ‘just cut under the surface. We leave the trash on top. We don't like to disk it deep or work the ground to death … We use a no-till planter because we have a lot of trash there … You want to keep the moisture in the soil’.
Six producers (19%) said that they used their grazing system or reduced stock numbers to mitigate drought impacts. For example, one producer described during their interview how their grazing system helped them, saying,
Ten years ago when we weren't rotational grazing, it was just ‘turn them in the pasture [in late Spring] and come get them in October’. Drought in that situation … you're feeding hay continuously, not to mention the damage you do to the grass. It would take several years of herbicide treatment to control your outbreaks of thistles and weeds, and that sort of thing. [With] rotational grazing… they're in there for 30 days of grazing before we have to pull them off grass and start grazing corn and that kind of thing … Consequently, we didn't have to go in and spray our pasture for several years … That's where I benefit more with a rotational system.
Two other sets of practices were mentioned by four respondents (13%), including: conservation practices such as creating windbreaks or establishing grassed waterways or terraces to trap and store runoff, and focusing more attention on irrigation practices that use less water (drip irrigation) or alternative sources of energy (e.g., propane). Table 2 lists a wide variety of additional practices that were mentioned two times or less in survey responses.
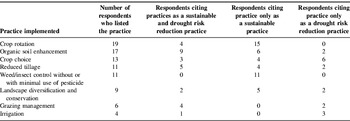
Table 3 compares the number of times a practice was listed by a producer as either a sustainable practice, a drought risk reduction practice or as both a sustainable practice and a drought practice. The use of crop rotations and minimizing pesticide use were named primarily as sustainable practices. Irrigation was mentioned primarily as a drought risk reduction practice. Most practices, though, including organic soil enhancement, crop choice, reduced tillage, grazing management and landscape diversification/conservation practices were mentioned fairly evenly as both ‘sustainable practices’ and ‘practices that reduce drought risk’. These practices may be implemented by sustainable farmers as general ‘sustainable’ practices or ‘best management practices’, while also having benefits during drought. As stated by one producer with respect to building soil organic matter, ‘We don't really do it because of planning for a drought, we do it because it's just a really good practice, and it works’.
Comparison of survey responses citing implemented practices such as sustainable and/or drought risk reduction activities.

Adapting during drought
Producers were also asked whether they had made any short-term modifications to their cropping systems and tillage systems during recent drought years. Results were inconclusive with approximately half saying they did modify their cropping or tillage systems during recent drought and half saying they did not.
Those who said that they did modify their tillage systems primarily reported reducing their tillage during recent drought years either by reducing the number of field passes or reducing the amount of ground tilled. During interviews, two producers added that a lack of weed pressure during drought enabled them to cultivate less. In describing their tillage strategy, a producer stated that ‘One thing I did different this year, which was specifically because of the drought, was that I disked [only] twice and then chisel plowed the alfalfa [M. sativa L.] to save on moisture and gain residue. Then I planted corn [Z. mays L. var. indentata] into it’. On the other hand, a producer who said that they did not change their tillage system explained that they instead continued to incorporate green manure to build the soil, and thought that was effective enough for retaining soil moisture.
Of the 16 surveyed producers who said that they changed their cropping system during drought, four stated that they planted less corn (Z. mays L. var. indentata) or none at all, and seven more said that they increased their use of small grains, alternative crops and forages, including milo (Sorghum bicolor L. Moench), millet (Panicum miliaceum L.), oats (A. sativa L.) and sunflowers (Helianthus annus L.). In an interview, one producer noted, ‘I made the switch from growing the dryland corn [Z. mays L. var. indentata] to the proso millet [P. miliaceum L.]. I also made some changes in my rotation. On my highly erodible dry land, I changed to a millet [P. miliaceum L.], wheat [T. aestivium L.], and millet [P. miliaceum L.] rotation. This allows me to skip a fallow year which makes for less exposure to wind erosion because you don't have reduced residue’. Another provided a specific example of planning for a drought year by stating, ‘I went to drought meetings with the extension service starting in February because all the predictions were that things were going to be dry. So … we were prepared. We didn't plant some ground to crops. We put them into grazing crops like oats [A. sativa L.] and forage sorghum [S. bicolor L.] and that kind of thing in preparation to keep the cows. That was kind of a primary goal—to keep the cows without having to buy a lot of expensive feed and that kind of thing. So we made it through. It wasn't easy, but we did it’.
While approximately half of respondents reported modifying their cropping systems or rotations during drought, 63% (P=0.10) said that their long-term management goals were not changed. One farmer offered an explanation for not changing during the interview, stating that their long-term goals included preparing for drought, and that they would continue their current rotation to build soils. Another said, ‘I decided that the best way to go is to stick with the current crop rotation. Changing the rotation caused too many problems. I felt that there is enough diversity in the crops that some will have a good year and can make up for the ones which have a bad year. I also felt that it is better to make a long-term commitment to some practice as opposed to changing things for the short-term’.
The 31% of producers who said that their long-term management goals were changed cited a number of long-term adaptations they were considering, including adding livestock into their operation, diversifying crop types, using soil moisture information in selecting crops to plant, adding cover crops, digging additional irrigation wells, keeping debt low and taking a ‘more conservative approach to everything’. For example, one interviewed farmer noted a desire to diversify into cattle, saying,
Something I would like to do, and that I've been thinking about recently, is that I want to one day move my operation into having more livestock …. I feel this for two reasons; nutrient cycling and drought tolerance. The cattle can really help the land if managed right; improve the water holding capacity of the soil because of improved nutrient cycling and biology. Also, livestock provides an extra income stream. Plus, if we have a really bad drought in which the crops are too damaged to sell, we could feed them to the livestock. It wouldn't go to waste!
Effectiveness of practices during drought
In order to explore how sustainable farmers felt their practices helped them during drought, they were asked: (1) whether they felt more or less vulnerable to drought than more traditional agricultural producers; (2) whether they felt the practices they had implemented helped to reduce the impacts of drought during recent years; and (3) how they would prove that their practices helped them.
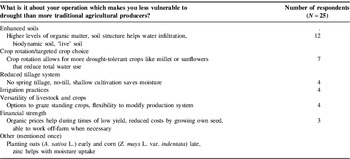
When asked whether they felt more or less vulnerable to drought than more traditional agricultural producers, 90% of producers (P<0.001) felt they were less vulnerable to drought. When asked what it was about their operation that makes them feel less vulnerable, the factor most frequently mentioned (12 comments or 48%) was the health and condition of the soil (Table 4). During their interview, one producer reflected
In 2001, we had a drought year, and I was in a situation where I had to disk in my green manure two times. Now usually, especially if you're conventional, you don't do that because you'll lose so much moisture, but I still came out with a higher yield than my conventional neighbor across the way. I had roughly 58 bushel [3641 kg/ha] corn [Z. mays L. var. indentata] and he had only 50 bushel [3139 kg/ha] corn [Z. mays L. var. indentata]. I realize that there could have been other factors at head, say the heat and what not, but I think it's because my soil is so healthy that I could get away with losing the moisture.
Factors identified by producers that reduced their vulnerability to drought.

Seven other producers (28%) said that their crop rotation made them less vulnerable to drought. As stated by one producer in an interview, ‘There's been a reduction in our water use because we've gone from all corn (Zea mays L. var. indentata) to putting in soybeans (Glycine max L.), alfalfa (Medicago sativa L.) and barley (Hordeum vulgare L.)’. Four (16%) others said that having a no-till or reduced tillage system made them feel less vulnerable to drought, with one elaborating that ‘no-till plus small grain in rotation makes us less vulnerable due to moisture saving’. Four surveyed farmers also credited the flexibility in their farming system that comes from having both crops and livestock. For example, in terms of diversity, one producer noted in an interview that, ‘In a dry year, you may lose some corn (Zea mays L. var. indentata), but the small grains will get you through. My livestock also add diversity and help during a drought. I have a better cushion in a drought year because I have the premium price and diversity’.
When asked if they felt the practices they had implemented helped to reduce the effects of drought during recent years, again, 80% of the producers surveyed (P<0.001) responded positively that the practices they implemented helped to reduce the negative effects of drought. When asked how the practices had helped, nine producers (53%) said that their practices either helped moisture infiltrate into the soil, the soil hold more water, or prevented water evaporation from the soil. Elaborating on this point in an interview, one producer noted ‘The zoned tillage helps me reduce input costs because I don't use as much fuel since I skip passes, and it also helps me conserve water and cover. All of these benefits of zoned tilling are helpful during a drought’. Three producers also said that their practices helped them achieve relatively good yields, and three said that their practices helped them decrease financial risk. Explaining these comments, a producer reported, ‘One thing I really notice is that my yields don't fluctuate as much. I'll have some loss in the dry years, but not nearly as much as the conventional guys. My rotation maintains the fertility in the soil, and I have low inputs. So, at the end of the year, the conventional guys barely make a profit after he pays the chemical guys. Also, I get the organic premium on my products. It really helps’.
For the smaller number of producers (20%) who felt drought impacts were not reduced by their practices, reasons included cover crops that never came up, higher seed costs and less income with small grains, and increased weed pressure. Two producers stated that their practices had not been in effect long enough to yet make a difference during drought.
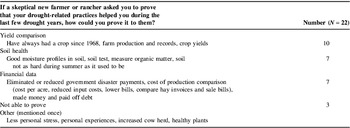
When asked what kind of evidence they could provide if a skeptical new farmer asked them to prove that their drought-related practices helped, 22 producers offered a description of evidence (Table 5). Ten respondents (45%) said that their yields would provide evidence. As described by one producer interviewed, ‘Three years ago, 2002, was a very dry year. I had something like 65 bushel/acre [4080 kg/ha] corn [Z. mays L. var. indentata] while 1.5 miles [2.4 km] southwest of here a conventional friend of mine got 20 bushel/acre [1255 kg/ha] corn [Z. mays L. var. indentata]. I felt like my practices really reduced my impacts during the drought’. Seven respondents (32%) cited their soil health as evidence of drought resilience, as described in an interview by a producer who stated they could ‘show [a] soil test with percent of organic matter. Each percentage point increase in organic matter increases water holding capacity’. Some farmers had a good understanding of the organic matter levels in their fields and measured changes over time. For example, one farmer noted in their interview that the organic matter level of their farm land used to be at 1.2–1.5% but has increased to 4.0–4.7% with changes in their production system over time. Others did not test their organic matter, but said that they could demonstrate evidence of their soil health through visual inspections. For example, one interviewed producer noted, ‘You go past my fields and you don't see water puddles … it soaks in. You go over to the neighbor's chemical [fields] and you'll see water standing in the fields where it can't drain’.
Responses given as ‘proof’ of effectiveness of practices during drought.

Seven respondents (32%) said that they would share their financial records as evidence that their practices helped during drought. They reported that sustainable producers may have less need for government disaster payments and less production costs resulting in a higher net profit per hectare than conventional producers, which could be examined by researchers. Summarizing the financial benefits, one farmer reported in an interview that they responded to skeptics by saying, ‘Go ahead and laugh. I know what I'm taking to the bank’.
Role of insurance and federal farm programs in determining management during drought
Producers were asked what role insurance and federal farm programs play in determining management methods during drought years. The 28 responses to this question were inconclusive, with an even split between insurance and farm programs playing no role in their management during drought (50%) and the producers saying they carried crop insurance (50%). Follow-up interviews helped to clarify this response, with some producers explaining that they either did not enroll in crop insurance or farm programs, and some that they enrolled but did not let them dictate their cropping system. As noted by one producer, ‘I keep up my rotation. I pay no attention to the farm programs’. On the other hand, another producer stated that they participate and some of the farm programs are beneficial, ‘but as far as the direct payments and all that kind of stuff, I just stay up with it—I sign up for it, but I don't make it a part of my decision making’. Specifically in terms of crop insurance, another producer reported that they use the federal crop insurance program because ‘it has gotten better. It also opens up some marketing opportunities because we use forward contracts to market grain, and we feel pretty safe about doing that with federal crop [insurance]’. Similarly, another said ‘Even though I'm organic, I have the subsidized crop insurance, but I take the minimum amount. I don't really change for the insurance’. Others stated ambivalence toward using insurance and federal farm programs, with one saying ‘As far as federal crop insurance, when we start paying that kind of money for rent … . You don't like it, but you just damn near have to use it. Because I borrow money from my banker, too. I'm not going to leave anybody short’.
Overall, in terms of fostering sustainable agriculture and drought readiness, respondents displayed a fairly negative attitude toward federal farm programs. As described by one producer, ‘The structure of the farm payments is hurtful and drives up land prices. Also farmers get careless because they can do whatever they want and still get money out of it. They need to rethink some of the hand-outs. With prices so out-of-control it's hard for someone like me to buy new land and make improvements’.
Barriers to drought mitigation
Producers were asked what barriers prevent them from implementing more strategies to reduce drought impacts and to rate them on a scale from 1 (small barrier) to 5 (larger barrier). As shown in Figure 1, the two largest barriers noted were a ‘lack of capital to improve operations’ and ‘markets/need to maximize production’. Eighty-four percent of respondents identified ‘lack of capital to improve operation’ as a barrier, and gave it a mean ranking of 3.2, which was significantly higher than six other potential barriers. As explained by one producer, ‘Sometimes your cash flow overrides your practicality. If you just expand, and you've got a debt load, that's going to have some control over your actions in a drought’. Eighty-one percent also identified ‘markets and the need to maximize production’ as a barrier and gave it a mean ranking of 2.6, which was significantly higher than four other potential barriers. With regard to maximizing production, one producer noted that ‘In the beginning you really want to establish a good rotation, but it's hard when you're only getting a profit on corn and soybeans because of the low demand on small grains’.
Differences among variables identified by respondents as barriers to implementing drought risk reduction practices (1=low, 5=high). (a) Lack of capital (N=27, mean=3.22, SD=1.31) was ranked higher than (c) P=0.04, (d) P=0.03, (g) P=0.002, (h) P=0.015, (i) P=0.011 and (j) P<0.001. (b) Markets/need to maximize production (N=26, mean=2.58, SD=1.27) was ranked higher than (g) P=0.011, (h) P=0.016, (i) P=0.043 and (j) P=0.002. (c) Lack of drought planning (N=25, mean=2.28, SD=1.24) was ranked higher than (i) P=0.016 and (j) P=0.011. (d) Unreliability of forecasts (N=25, mean=2.2, SD=1.15) was ranked higher than (i) P=0.041 and (j) P=0.001. (e) Federal farm program (N=20, mean=2.15, SD=1.38) was ranked higher than (j) P=0.044. (f) Landlord control over operation (N=15, mean=2.0, SD=1.3) was not significantly different than any other variable. (g) Feel that nothing can be done (N=21, mean=1.81, SD=0.8136). (h) Bank control over operation (N=13, mean=1.77, SD=1.3). (i) Peer pressure (N=16, mean=1.63, SD=1.02). (j) Lack of access to weather data and forecasts (N=23, mean=2.20, SD=1.15).

Producer recommendations for reducing drought risk
When asked what needs to be done to make Nebraska farmers and livestock producers less vulnerable to drought, the four most common recommendations were for producers to increase practices that improve soil health (6 comments; 26%); for producers to increase the use of, and researchers to increase development of, more drought resistant crops and crop varieties (6 comments; 26%); for producers to change tillage practices to better conserve soil moisture (5 comments; 22%), and for producers to diversify what is grown on the farm (5 comments; 22%).
With regard to soil health, one interviewed farmer made the comment that ‘the first thing we have to do is make sure we've got organic content in all of our farm soils up to 5%. … Using the factory farming system with chemicals, they're burning up the organic matter. There are a lot of these fields out here that are less than 2%, some even less than 1%. They can't hold water for drought-proofing’. Another producer described their emphasis on growing drought resistant crops, saying, ‘I feel very strongly that a lot of these, particularly dryland, farmers could do very, very well by looking at other crops than corn [Z. mays L. var. indentata]. We focus on popcorn [Z. mays L. var. everta], which is an extremely valuable crop, which uses one-half to one-third the water. Another good crop we're looking at, because we have the demand for it, is pearl millet [Pennisetum glaucum L. R. Br], which is a drought crop. It's a crop that was developed in droughty areas of Africa. … It has 125% of the feed value of corn [Z. mays L. var indentata]’. Another farmer emphasized the importance of diversifying the rotation saying, ‘This corn [Z. mays L. var indentata] and soybean [G. max L.] rotation is not a rotation. It's two specialties. There [have] to be green cover crops grown. It's an absolute must, whether you irrigate or not’.
Other recommendations listed by three or fewer respondents included making changes to the US Farm Bill and crop insurance programs to encourage conservation and to support organic production through better crop insurance coverage, moving away from agriculture structures that rely on inputs and ‘mine the soil’, limiting reliance on irrigation, changing laws around water resources or taxes, better long-term weather forecasting and drought planning education, increasing grass-based farming and rotation grazing, and investing in cloud seeding to enhance rainfall.
Conclusions
The farmers in this study reported implementing a range of sustainable agriculture practices that reduce drought risk, such as organic soil enhancement methods, the use of more drought tolerant crops and crop rotations, reduced tillage, alternative grazing management and land and water conservation strategies. Although it was reported that some strategies were implemented with drought risk reduction in mind, many of the producers argued that the nature of their system provided long-term adaptation benefits for drought vulnerability reduction. They implement many of these strategies primarily as long-term sustainable practices that allow for adaptation to climate and other fluctuations.
Some long-term sustainable practices also enable farmers to make short-term adaptations during drought. For example, crop rotations are a long-term strategy for building soil health requiring an investment in time toward developing markets or market contacts for a variety of crops, as well as time and money to acquire the necessary knowledge, equipment and experience to raise a variety of crops. These long-term strategies and investments allow producers to make short-term adaptations during drought, such as planting more drought-resistant crops or varieties, because marketing contacts, equipment and agronomic knowledge are already in place. Farmers’ adaptive capacity to drought may be increased through education about using sustainable practices as a long-term adaptation to drought, and about how sustainable strategies might be used to maximize short-term flexibility during drought.
Lack of capital and the need to maximize crop production and/or produce for existing markets, can be large barriers that keep producers from implementing more strategies to reduce the effects of drought. Lower profits associated with small grains, or the uncertainty of the benefits associated with higher costs for drought-resistant seed or cover crops may also limit producers’ implementation of drought strategies. Among other barriers, farm and disaster policies that tacitly encourage farmers not to plan ahead for drought, that financially penalize farmers for taking action to reduce drought impacts, that decrease farmers’ options during drought and that lead to impaired soil health and less farm diversity, were also seen as barriers for reducing drought impacts.
To address these barriers, farmers' adaptive capacity to drought may be increased through research and policy initiatives to improve the economic feasibility of using drought-adapted practices. Research needs may include breeding new drought-tolerant varieties of crops, as well as developing profitable uses for crops that are drought tolerant. Policy needs may include programs that provide financial incentives in the way of capital assistance for drought adaptation, market development for drought-tolerant crops and farm program support for alternative crops and sustainable agriculture techniques. Further research assessing the effects of specific farm and food policies on farmers’ drought-adaptive capacity is required.
In addition to the research needs described above, additional empirical and case studies should be carried out to further investigate issues expressed in comments made by respondents in this study. For example, more research is needed to investigate anecdotal comments on the extent to which sustainable producers’ adaptive capacity helps them during drought events. Comparing the perspectives represented here with those of self-described ‘conventional’ farmers would also add depth to the discussion of farmer adaptability. As our need to increase global food production grows, it becomes even more necessary to investigate a broad range of alternative strategies for fostering viable production systems and the adaptive capacity to adjust to ever-changing conditions.
Acknowledgements
We express our grateful thanks to the Nebraska farmers who gave selflessly of their time to answer our questions, the anonymous reviewers and editor for their useful comments and suggestions, and for funding provided by NOAA's (National Oceanic and Atmospheric Association's) Climate Program Office SARP program.