I. INTRODUCTION
Accurate control of the boron (B) concentration embedded in Si1–xGex in the source/drain regions of p-type metal oxide semiconductor (pMOS) devices is very critical for optimizing device performance. Having a nondestructive, noncontact, and in-line monitoring technique with sufficient sensitivity to B concentration (i.e., low B concentration detection limit) is necessary.Reference Hikavyy, Nguyen, Loo, Ryan, Wormington and Hopkins1, Reference Khater, Adam, Rieh, Schonenberg, Pagette, Stein, Jeng, Ahlgren and Freeman2
Si1–xGex epitaxial layer thickness and Ge content (x value) are typically measured by Auger electron spectroscopy (AES), Rutherford backscattering spectroscopy (RBS), secondary ion mass spectrometry (SIMS), photoluminescence (PL), high-resolution x-ray diffraction (HRXRD), and spectroscopic ellipsometry (SE).Reference Hikavyy, Nguyen, Loo, Ryan, Wormington and Hopkins1, Reference Zhao, Zuo, Cheng, Yu and Wang3–Reference Tzeng, Ku, Chang, Yang, Chern, Lin, Hasuike, Harima, Ueda, Ishigaki, Kang and Yoo7 Destructive analysis techniques such as AES, RBS, and SIMS are not suitable for use as a production monitoring technique. Proper characterization of the optical properties of Si1–xGex layers using PL requires measurement at very low (cryogenic) temperatures, a very time-consuming process, and is not practical for in-line monitoring. HRXRD and standard error offer fast and nondestructive analyses, and are frequently used in Si1–xGex epitaxial layer thickness and Ge content measurement as in-line monitoring techniques. HRXRD is also used to measure the strain level and substitutional B concentration in SiGe epitaxial layers on Si. However, the previously reported detection limit for active dopant concentration using HRXRD was about 2.7 × 1019 cm−3 after interpolation between actual measurement data points.Reference Hikavyy, Nguyen, Loo, Ryan, Wormington and Hopkins1 The desired B detection limit for an in-line monitoring technique is closer to 1.0 × 1018 cm−3. Thus, HRXRD is not sensitive enough as a B dopant concentration monitoring technique for use in production.
Micro-Raman spectroscopy has long been studied, and demonstrated, as a very powerful noncontact and nondestructive stress, strain, and crystallinity measurement technique in element, compound, and alloy semiconductor devices.Reference De Wolf8–Reference Nakashima, Mizoguchi, Inoue, Miyauchi, Mitsuishi, Nishimura and Akasaka10 Micro-Raman spectroscopy of Si1–xGex/Si would be capable of providing accurate information on Ge content and strain in the Si1–xGex layer if an imaging monochromator system was used to improve the common problems (measurement repeatability and stability) in conventional monochromator-based Raman systems with rotating grating(s).Reference Yoo, Ueda, Ishigaki and Kang4–Reference Tzeng, Ku, Chang, Yang, Chern, Lin, Hasuike, Harima, Ueda, Ishigaki, Kang and Yoo7 Additionally, micro-Raman has some ability for depth profiling by selecting excitation wavelengths. The probing depth (penetration depth) of ultraviolet (UV) Raman spectroscopy is less than 10 nm, whereas the probing depth of visible Raman spectroscopy can extend to ~2.5 μm.
In this work, we have investigated the possibility and suitability of micro-Raman spectroscopy as a noncontact, in-line measurement technique for B concentration in ultrathin B-doped Si1–xGex epitaxial layers on Si(100), using a polychromator-based, multiwavelength Raman spectroscopy system.
II. EXPERIMENT
In crystalline Si and Si1–xGex, the presence of strain causes a shift of the Raman peak (phonon peak) positions and deterioration in crystallinity (due to defects and/or dopant concentration increase), which affects the full width at half-maximum (FWHM) of the Raman peak. Spectral resolution and repeatability of measurement in conventional monochromator-based Raman systems are not suitable for the accurate and precise measurements required for characterizing high quality crystalline semiconductor materials due to certain aspects of their system design, including the use of moving parts. For proper characterization and monitoring of high quality crystalline semiconductor materials, very high spectral resolution (typically <0.1 cm−1 before curve fitting), measurement repeatability, and long-term stability of better than <0.1 cm−1 are required. The requirements of such a Raman system for Si-based semiconductors, and the necessity of designing a polychromator-based, long focal length (2.0 m) multiwavelength Raman spectroscopy system are reported by Yoo et al.Reference Yoo, Ueda, Ishigaki and Kang4–Reference Yoo, Ueda, Ishigaki and Kang6 and Tzeng et al.Reference Tzeng, Ku, Chang, Yang, Chern, Lin, Hasuike, Harima, Ueda, Ishigaki, Kang and Yoo7
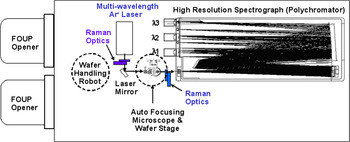
A multiwavelength imaging Raman spectroscopy (MRS-300) system was designed to overcome the aforementioned deficiencies in commercially available conventional micro-Raman systems.Reference Yoo, Ueda, Ishigaki and Kang4–Reference Tzeng, Ku, Chang, Yang, Chern, Lin, Hasuike, Harima, Ueda, Ishigaki, Kang and Yoo7, Reference Yoo, Kang, Ueda and Ishigaki11 Schematic illustration of the MRS-300 system is shown in Fig. 1. Stress/strain and Ge content in Si1–xGex/Si at different depths can be monitored in-line. The MRS-300 was designed with no moving parts and a minimum of optical components for improved stability and repeatability, along with a longer focal length for enhanced spectral resolution. The design concept and performance of the MRS-300 in stressed Si and Si1–xGex/Si characterization applications have been reported by Yoo, et al.Reference Yoo, Kang, Ueda and Ishigaki11, Reference Yoo, Ueda and Kang12
Schematic illustration of multiwavelength Raman spectroscopy (MRS-300) system. (color online)

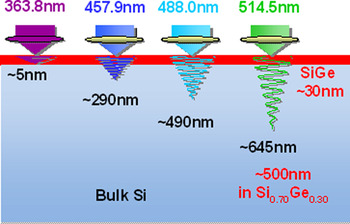
Undoped and B-doped, ultrathin (20~35 nm) Si1–xGex epitaxial layers were grown on 300 mm diameter p −-Si(100) wafers by chemical vapor deposition. The ranges of target Ge content and B concentration in Si1–xGex epitaxial layers were 25 to ~40 at.% and 1.0 × 10¹⁸ ~1.0 × 1021 cm−3, respectively. The Si1–xGex/Si(100) wafers were characterized using micro-Raman spectroscopy under UV and visible wavelengths (363.8, 457.9, 488.0, and 514.5 nm) of Ar+ lasers. The approximate probing depth of these excitation wavelengths in p −-Si is estimated to be ~5, ~290, ~490, and ~645 nm (respectively) based on the light absorption coefficient of Si at these wavelengths. The Raman probing depth was estimated to be one-half of the penetration depth of the excitation wavelength because the Raman signal from the sample attenuates at the same rate as the excitation light, as it escapes from the sample. The probing depth in Si1–xGex becomes shallower as Ge content is increased. In Si1–xGex (x = 0.30), the penetration depth is estimated to be 20% shallower than that in p −-Si. The probing depth dependence of the excitation wavelength for Raman measurements on undoped Si0.70Ge0.30 epitaxial layers on Si(100) is illustrated in Fig. 2.
Excitation wavelength dependence of probing depth of Raman measurement on undoped Si0.70Ge0.30 epitaxial layers on Si(100). (color online)

The Ge content and B concentration in ultrathin Si1–xGex films and the thickness of the Si1–xGex films were measured by SIMS for verification and compared with the Raman measurement results.
III. RESULTS AND DISCUSSION
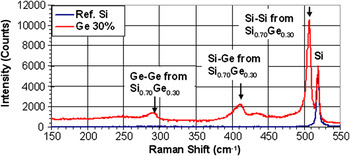
Raman spectra from ~60 nm thick, undoped Si0.70Ge0.30 epitaxial layers on Si(100) and a reference Si(100) wafer in the (150 ~550 cm−1) wave number range under 457.9 nm excitation are shown in Fig. 3. The main peak at 520.3 cm−1 is the Si–Si stretching (optical phonon) mode from the Si wafer. Three other peaks in the ranges of 280~310 cm−1 and 390~450 cm−1, correspond to the Ge–Ge and Si–Ge phonon stretching modes of the Si1–xGex epitaxial layer.Reference Hikavyy, Nguyen, Loo, Ryan, Wormington and Hopkins1, Reference Alonso and Winer13 The shift of the Si–Si peak to the lower wave number side is proportional to the Ge content in the Si1–xGex layer and has been well studied.Reference Hikavyy, Nguyen, Loo, Ryan, Wormington and Hopkins1, Reference Yoo, Ueda, Ishigaki and Kang4–Reference Tzeng, Ku, Chang, Yang, Chern, Lin, Hasuike, Harima, Ueda, Ishigaki, Kang and Yoo7, Reference Alonso and Winer13 From the position of the Si–Si peak of Si1–xGex (i.e., shift of the Si–Si peak of Si1–xGex from the Si–Si peak for a Si wafer), Ge content can be estimated. For accurate Ge content measurement, high spectral resolution (~0.1 cm−1 before curve fitting) is required.Reference Yoo, Ueda, Ishigaki and Kang4–Reference Tzeng, Ku, Chang, Yang, Chern, Lin, Hasuike, Harima, Ueda, Ishigaki, Kang and Yoo7 For thin Si1–xGex epitaxial layers, shorter excitation wavelength Raman measurement results in stronger Raman signals from the Si1–xGex epitaxial layers due to the shallower probing depth. Thus, for thorough and complete analysis, high spectral resolution and multiwavelength Raman measurement capability are necessary.
Raman spectra from ~60 nm thick, undoped Si0.70Ge0.30 epitaxial layers on Si(100) and a reference Si(100) wafer in the wave number range (150~550 cm−1) under 457.9 nm excitation. (color online)

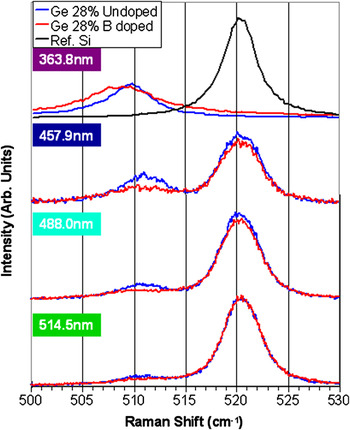
Figure 4 shows Raman spectra from undoped and B-doped Si1–xGex (x = 0.28) under various excitation wavelengths (363.8, 457.9, 488.0, and 514.5 nm). The thickness of Si1–xGex and B concentration of doped Si1–xGex (x = 0.28) were ~60 nm and ~5.0 × 1019 cm−3, respectively. As excitation wavelengths shorten (and probing depth becomes shallower), the Si–Si peak in Si becomes weaker and the Si–Si peak in Si1–xGex becomes stronger. Under the 363.8 nm excitation only the Si–Si peak in Si1–xGex was observed due to the shallow probing depth of the UV light. UV Raman spectra from a reference Si(100) wafer was plotted for comparison. The B-doped Si1–xGex epitaxial layer showed a smaller and broader Si–Si peak compared to that of the undoped Si1–xGex epitaxial layer on Si at all excitation wavelengths. The results are consistent with the previous studies by Pérez-Rodríguez et al.Reference Pérez-Rodríguez, Romano-Rodríguez, Cabezas, Morante, Jawhari and Hunt14 and Yoo et al.Reference Yoo, Ueda, Ishigaki and Kang15 Because the Si1–xGex epitaxial layer is relatively thin (~60 nm), shorter excitation wavelength Raman spectra provides a stronger Si–Si peak from the Si1–xGex epitaxial layer and clearer broadening of the Si–Si peak due to B doping. The shorter excitation wavelength gives a better signal-to-noise (S/N) ratio for the thin Si1–xGex epitaxial layer on Si(100) wafers. Appropriate excitation wavelengths must be chosen on the basis of the structure of samples and desired probing depths.
Multiwavelength (363.8, 457.9, 488.0, and 514.5 nm) Raman spectra from undoped and B-doped (target B concentration = 5.0 × 1019cm−3) Si1–xGex (x = 0.28). (color online)

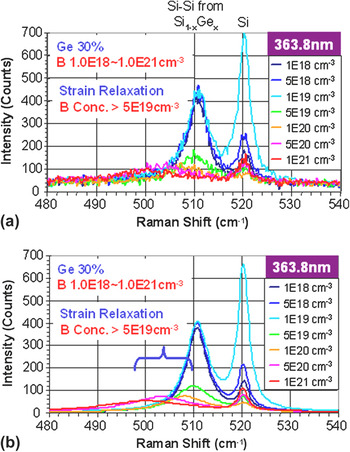
Multiwavelength imaging Raman characterization of B-doped, ultrathin Si1–xGex epitaxial layers on Si(100) wafers was used to find correlation between Raman spectra and B concentration. The thickness of Si1–xGex epitaxial layer was in the range of 20 ~35 nm. Figure 5 shows Raman spectra [(a) as measured and (b) after curve fitting] from ultrathin, B-doped Si1–xGex epitaxial layers with a target B concentration range of 1.0 × 10¹⁸ ~1.0 × 1021 cm−3 under 363.8 nm excitation. The B concentration measured by SIMS ranged from 7.8 × 10¹⁷ to 9.1 × 1020 cm−3. Large intensity variation of the Si peak was observed due to the thickness variations in ultrathin Si1–xGex epitaxial layers and the light absorbance of excitation wavelength at 363.8 nm. The thinner Si1–xGex epitaxial layers resulted in a stronger Si peak from the Si(100) wafer. As B concentration increases, the Si–Si peak from the Si1–xGex epitaxial layers becomes weaker and broader. For Si1–xGex epitaxial layers with B concentration greater than 5.0 × 1019 cm−3, the position of the Si–Si peak from the Si1–xGex epitaxial layer shifted toward the lower wave number side due to strain relaxation. A similar trend was observed under the 457.9 nm excitation Raman measurement. However, the S/N ratio was generally poor due to the weak Si–Si signal from the ultrathin Si1–xGex epitaxial layers. Raman measurements with 488.0 and 514.5 nm excitation did not show reliable measurement of the Si–Si peak from Si1–xGex epitaxial layers due to the nature of the deeper probing depths.
UV Raman spectra (a) as measured and (b) after curve fitting from 20~35 nm thick, B-doped Si1–xGex (x = 0.30) epitaxial layers with various B concentrations. The large intensity variation of the Si peak at 520.3 cm−1 is due to the thickness variations in ultrathin Si1–xGex epitaxial layers and light absorbance at this particular excitation wavelength of 363.8 nm. (color online)

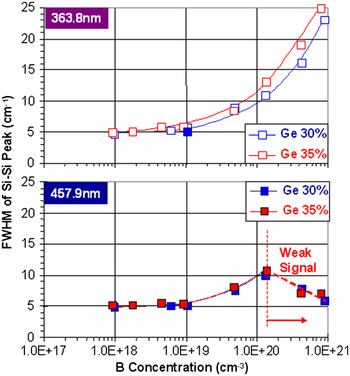
The FWHM of the Si–Si peak from a 20 ~35 nm thick Si1–xGex (x = 0.30 and 0.35) epitaxial layers under 363.8 and 457.9 nm excitation was plotted in Fig. 6 as a function of the B concentration in the Si1–xGex epitaxial layer measured by SIMS. The B doping level was varied from undoped to ~1.0 × 10²¹ atoms/cm3. The FWHM of the Si–Si peak, from ultrathin Si1–xGex epitaxial layers, broadens as B concentration increases, regardless of Ge content. The FWHMs of undoped Si1–xGex epitaxial layers of x = 0.30 and 0.35 are ~4.5 cm−1. At a B concentration of ~5.0 × 10¹⁹ atoms/cm3, the FWHMs of Si1–xGex epitaxial layers for x = 0.30 and 0.35 were ~9.0 cm−1 and 8.7 cm−1, respectively. The FWHM values continued to broaden as the B dopant concentration increased, and almost doubled at a B concentration of ~5.0 × 10¹⁹ atoms/cm3. In this study, the lowest B concentration detected by FWHM broadening was 8.7 × 10¹⁷ atoms/cm−3. Data acquisition times range from a few seconds to a few minutes (per point), depending on film thickness, B concentration, and desired signal to noise and productivity tradeoffs.
FWHM of the Si–Si peak from 20~35 nm thick Si1–xGex (x = 0.30 and 0.35) epitaxial layers as a function of B concentration in the Si1–xGex epitaxial layer (as measured by SIMS). FWHM estimation error during curve fitting is less than 0.2 cm−1. (color online)

Both FWHM curves, plotted against B concentration, under 363.8 and 457.9 nm excitation are nearly identical for B concentration up to ~1.3 × 1020 cm−3. The 457.9 nm excitation FWHM curve begins to deviate from the 363.8 nm FWHM curve beyond this region. We suspect this is caused by the low S/N ratio of 457.9 nm Raman spectra from ultrathin Si1–xGex epitaxial layers and strain relaxation by heavy B doping. We have verified the strain relaxation in heavily doped (B > 7.8 × 1019 cm−3) Si1–xGex epitaxial layers by HRXRD. The HRXRD rocking curve of SiGe layers with higher B concentration (B > 7.8 × 1019 cm−3) become narrower. This indicates strain relaxation in SiGe and matches well with Raman spectra under longer wavelength (457.9 nm or longer) excitation. Although HRXRD gives information on the average characteristic of the film, the multiwavelength feature of the MRS-300 system allows us to compare the film characteristics at various depths.
HRXRD detects the lattice spacing of the Si1–xGex epitaxial layer on the Si wafer. The thickness and Ge content of the Si1–xGex epitaxial layer are estimated from x-ray rocking curve simulations. For a B impurity to cause a change in lattice spacing, a significant quantity of B atoms must occupy substitution sites in the lattice. Due to the lattice mismatch between the Si1–xGex epitaxial layer and Si wafers, the Si1–xGex/Si interface is strained, and the amount of strain is mainly determined by the Si1–xGex epitaxial layer thickness, Ge content, and crystallinity of the Si1–xGex epitaxial layer. The relatively thick Si1–xGex layers on Si, with high Ge content, experience less strain, depending on crystal quality, and result in a decrease of the lattice constant of Si1–xGex perpendicular to the wafer surface. This often causes Ge content to be estimated lower from HRXRD than the actual Ge content.Reference Zhao, Zuo, Cheng, Yu and Wang3 The presence of strain causes two-dimensional lattice distortion and results in changes in lattice spacing. This change in lattice spacing due to strain is significantly larger than that from typical levels (5.0 × 10¹⁸ ~5.0 × 10¹⁹ atoms/cm3) of B doping. For these reasons, it can be impractical to use HRXRD to quantify B dopant concentration and as an in-line B concentration monitoring technique.
On the basis of the lattice constants of Si (a Si = 0.543059 nm) and Ge (a Ge = 0.564613 nm), atomic densities of Si and Ge are calculated to be 5.00 × 10²² atoms/cm3 and 4.42 × 10²² atoms/cm3.Reference Sze16 For Si1–xGex (x = 0.30), the lattice constant and atomic density is estimated to be 0.5490 nm and 4.835 × 10²² atoms/cm3, respectively.Reference Dismukes, Ekstrom, Steigmeier, Kudman and Beers17, 18 The B concentration of 1.0 × 10¹⁸ atoms/cm3 is equivalent to 20.7 ppm. For comparison, the reported HRXRD detection limit is ~2.7 × 10¹⁹ atoms/cm3 (or ~558 ppm) of B concentration in Si1–xGex (x = 0.16). Thus, Raman spectroscopy has a B detection limit that is at least 25 times more sensitive than the B detection limit of HRXRD. In addition, HRXRD requires a relatively large measurement area (~100 μm × 100 μm) and HRXRD can only provide an average value for the entire layer. On the other hand, micro-Raman spectroscopy only requires a measurement area larger than the beam size (1 μm or less) and can provide depth profiling capability when multiple excitation wavelengths are used. To characterize device wafers with multilayer structures, high spatial resolution with depth profiling capability is very useful. The combination of features, including the noncontact and nondestructive nature of micro-Raman spectroscopy, high B concentration sensitivity, high spatial resolution, and depth profiling capability make multiwavelength micro-Raman spectroscopy very attractive for use as an in-line monitoring technique. In-line monitoring examples of Ge content and Si1–xGex epitaxial layer thickness for epitaxial film characterization and Si1–xGex epitaxial process optimization have been reported elsewhere.Reference Tzeng, Ku, Chang, Yang, Chern, Lin, Hasuike, Harima, Ueda, Ishigaki, Kang and Yoo7
Considering the penetration (probing) depth (<5.0 nm) of the 363.8 nm excitation wavelength in Si1–xGex (x = 0.30) and laser beam diameter <0.5 μm, the probing volume and total number of atoms in that probing volume, can be estimated to be <3.9 × 10⁻¹⁵ cm3 and <1.89 × 10⁸ atoms, respectively. Thus, for B concentration of 1.0 × 1018 cm−3 in Si1–xGex (x = 0.30), the total number of B atoms, in the probing volume of 363.8 nm excitation, is ~3900 atoms. The presence of only ~3900 B atoms (~20 ppm) can cause broadening of the Si–Si Raman peak (distribution of optical phonon vibrations) of Si1–xGex (x = 0.30) layer and result in an increase in FWHM. For thicker Si1–xGex epitaxial layers, a combination of UV and visible wavelength excitations for Raman measurements can provide noncontact, nondestructive depth profile information for B concentration, Ge content, strain, and crystallinity.
IV. SUMMARY
We have found a very strong correlation between B content and the nature of the Si–Si Raman peak from Si1–xGex epitaxial layers. As B concentration increased from undoped to ~1.0 × 10²¹ atoms/cm3, the FWHM of the Si–Si Raman peak widened and the peak height became smaller, for a given Ge content. Boron concentration of ultrathin Si1–xGex films, determined by noncontact micro-Raman spectroscopy, was in good agreement with SIMS analysis results. Boron concentration as low as 8.7 × 10¹⁷ atoms/cm3 can be detected by micro-Raman spectroscopy, which is ~30 times lower detection limit than the detection limit (2.7 × 10¹⁹ atoms/cm3) of HRXRD. Multiwavelength Raman measurements are extremely useful as an in-line characterization technique for depth profiling of B concentration, Ge content, strain, and crystallinity of Si1–xGex epitaxial layers. With its unique advantages, multiwavelength Raman spectroscopy has an important place among characterization techniques such as HRXRD, SE, AES, SIMS, and PL.
ACKNOWLEDGMENTS
The authors would like to thank Dr. T.L. Lee, Mr. C.H. Lee, and Mr. Y.H. Cheng of the TSMC R&D Department, and Mr. W.L. Lee and Mr. Amit Vijay Sona of the TSMC Nano CVD/New Technology Section for Si1-xGex epitaxy. They also would like to thank Dr. J.J. Lee, Dr. D. Gui, and Ms. J.Y. Hsieh of the TSMC Surface & Chemical Analysis Department for SIMS analysis and Mr. M.H. Hong and Mr. C.C. Huang of the TSMC Nano CVD Process Section 2 for support in HRXRD analysis.