Implications
Insect meal represents a potential future feed in animal rearing. Among farmed insect, Hermetia illucens is one of the most studied for its easiness to be reared on low cost substrates and due to its low environmental impact. Aquaculture, in order to produce high level products, requires feeds of high nutritional level and often this have a negative effect on the cost and on the environment. Insect meal could be a potential substitute of fish meal in farmed fish, as rainbow trout, with a constant attention to the possible effects on animal performances and chemical characteristics of the final product.
Introduction
During the last decades, several research studies were conducted in order to test alternative and sustainable products to fish meal as protein sources in aquafeed. Nutritional values of several plants were deeply studied and researchers highlighted that plant products are deficient in essential amino acids (as lysine and methionine) and that can only partially replace fish meal as protein substitution (de Francesco et al., Reference de Francesco, Parisi, Pérez‐Sanchez, Gomez‐Réqueni, Médale, Kaushik, Mecatti and Poli2007; Sánchez-Muros et al., Reference Sánchez-Muros, Barroso and Manzano-Agugliaro2014). Recently, a revived attention was given to the development of food and feed with insect as protein base. Insects could be a potential future response to the increasing amount of food/feed required by human population (van Huis et al., Reference van Huis, Van Itterbeeck, Klunder, Mertens, Halloran, Muir and Vantomme2013). Moreover, insects have a high nutritional value: they are rich in proteins with high biological value, vitamins, minerals and lipids (van Huis et al., Reference van Huis, Van Itterbeeck, Klunder, Mertens, Halloran, Muir and Vantomme2013).
One of the most studied insect as protein source in animal nutrition is H. illucens (black soldier fly) for its easiness to be reared on low cost substrates as manure or by-products (as vegetable waste or fish waste) (Charlton et al., Reference Charlton, Dickinson, Wakefield, Fitches, Kenis, Han, Zhu, Kone, Grant, Devic, Bruggeman, Prior and Smith2015). Hermetia illucens showed the capability to reduce nitrogen and phosphorus waste from manure and to transform this matrix into a final product with less environmental impact (Sheppard and Newton, Reference Sheppard and Newton1994). Hermetia illucens prepupae meal represents a valid source of protein and fats and its use as feed was assessed in different animal species with remarkable results and with emphatics in aquaculture (Makkar et al., Reference Makkar, Tran, Heuzé and Ankers2014). Few research studies assessed H. illucens meal as substitute of fish meal (as protein portion) in fish diets; results highlighted that a total or partial replacement of fish meal with H. illucens meal could have a wide range of effect on growth with controversial performances, anyhow a lack of performance increase was highlighted in all the fish species studied (Henry et al., Reference Henry, Gasco, Piccolo and Fountoulaki2015). Moreover, research studies highlighted that inclusion of insect meal in feedstuff of farmed fish could affect chemical composition and sensory characteristics of the fillets (Belforti et al., Reference Belforti, Gai, Lussiana, Renna, Malfatto, Rotolo, De Marco, Dabbou, Schiavone, Zoccarato and Gasco2015; Borgogno et al., Reference Borgogno, Dinnella, Iaconisi, Fusi, Scarpaleggia, Schiavone, Monteleone, Gasco and Parisi2017). Evaluations of the chemical and sensory characteristics are requested by the producers in order to understand if insect meal could change intrinsic properties of the fillets or could add specific modification that lead to the recognisability of the products (both in a positive or negative way) (Henry et al., Reference Henry, Gasco, Piccolo and Fountoulaki2015).
The goal of this research study was to quantify the potential modifications occurred in muscle of rainbow trout fed H. illucens prepupae meal at two different concentrations as substitution of fish meal (25% and 50% of fish meal). In order to highlight relations between diets and edible fish fillet characteristics, proximate composition, colour indexes, fatty acids profiles, volatile organic compounds (VOCs), nucleotides, myofibrillar and sarcoplasmic proteins concentrations were determined.
Material and methods
Diets and samples
Rainbow trout (Oncorhynchus mykiss) were housed in twelve tanks (360 fish, 30/tank, average initial weight of 178.9±9.81 g) in an indoor open water system. Trout were divided in three experimental groups fed twice a day with isoproteic and isolipidic diets, at 1.5% of BW (fish were weighed in bulk every 15 days). Three experimental diets (four tanks per diet) were formulated: one diet including only fish meal as protein source was set as control (C) and two diets presented a substitution of the 25% (Hi25) and 50% (Hi50) of the fish meal with defatted H. Illucens larvae meal (Hi; Hermetia Deutschland GmbH & Co., Baruth/Mark, Germany), as reported by Borgogno et al. (Reference Borgogno, Dinnella, Iaconisi, Fusi, Scarpaleggia, Schiavone, Monteleone, Gasco and Parisi2017). In order to maintain isoenergetic the diets, also fish oil content was reduced in Hi25 and Hi50 diets (−22.2% and −44.4%, respectively) as Hi meal contained more fat than fish meal. Farming condition and chemical composition of the experimental diets were reported elsewhere (Borgogno et al., Reference Borgogno, Dinnella, Iaconisi, Fusi, Scarpaleggia, Schiavone, Monteleone, Gasco and Parisi2017).
At the end of the trial (92 days), four fish for each diet group (one fish per tank; average final weights of 467.5±59.58, 443.8±29.52, 431.5±82.65g, respectively for C, Hi25 and Hi50 group) were slaughtered then filleted and the fillets obtained were vacuum packaged and frozen at −80 °C until analysed. Each fish was individually analysed.
The experimental trial was performed at the experimental facility of the Department of Agricultural, Forest, and Food Sciences (Turin, Italy). Fillet characteristics were determined at the Department of Agri-Food Production and Environmental Sciences (Florence, Italy) and at the Instituto de Investigaciones Marinas IIM-CSIC (Vigo, Spain).
Chemical composition
Proximate composition of trout muscles (dry matter, ash, protein and lipid contents) were determined in triplicate on each sample. Dry matter, ash and protein were determined accordingly to AOAC (2012) methods (950.46, 920.153 and 976.05, respectively); lipid content was determined gravimetrically after extraction following the Bligh–Dyer method (chloroform:methanol 1 : 2; 200 μl of chloroform layer evaporated at 60°C in triplicate; Bligh and Dyer, Reference Bligh and Dyer1959).
Trout sample carbohydrate content was quantified as reported by DuBois et al. (Reference DuBois, Gilles, Hamilton, Rebers and Smith1956). A calibration curve of glucose (0 to 0.12 mg/ml) was plotted and results were expressed as percentage of glucose.
Colour analysis
Colorimetric measurement was carried out by ImageJ software provided with Color Inspector 3D plug-in (Rasband, Reference Rasband2012). Images of all fillets were captured by a digital camera (DMC-TZ20; Panasonic, Kadoma, Japan) placed at a fixed distance from the target. The luminous intensity was controlled by a photo-radiometer (HD 2302.0; Delta Ohm s.r.l., Padua, Italy) to ensure that all the pictures were captured in the same lighting conditions. A manual selection on the picture of fillets was made to discriminate them from the background. Then, the selections were cropped and saved as different files and analysed with the Color Inspector 3D ImageJ plug-in (Rasband, Reference Rasband2012) in order to obtain the RGB colour histogram. The programme assigns each pixel to an RGB colour and returns a table with each colour and its relative frequency. Afterward, the RGB colour was converted to CIELab system. The average of the CIELab value of each pixel was calculated in order to obtain the fillet average colour. Hue* value, which represents how we perceive colour, and Chroma value, which represents saturation, were also calculated. Moreover, the colour distance (ΔE) was calculated as proposed by Sharma and Bala (Reference Sharma and Bala2002).
Nucleotides
Nucleotides were determined as proposed by Secci et al. (Reference Secci, Parisi, Dasilva and Medina2016). Nucleotides (hypoxanthine (Hx), inosine (Ino), inosine monophosphate (IMP), adenosine monophosphate (AMP), ADP and ATP) were detected by HPLC (lliance® HPLC Model 2695; Waters, Milford, MA, USA) equipped with Zorbax Eclipse XDB-C8 column (4.60×75 mm, particle diameter 3.5 μm; Agilent Technologies, Santa Clara, CA, USA) maintained at 35°C. The injection volume was 10 μl and detection was monitored at 254 nm. The total separation time was 12 min with a rate flux of 1 ml/min. The results were expressed as mM nucleotides/g muscle, and they were used to calculate K-value=((Hx+Ino)/(Hx+Ino+IMP+AMP+ADP+ATP))×100 as reported by Karube et al. (Reference Karube, Matsuoka, Suzuki, Watanabe and Toyama1984).
Fatty acid profiles
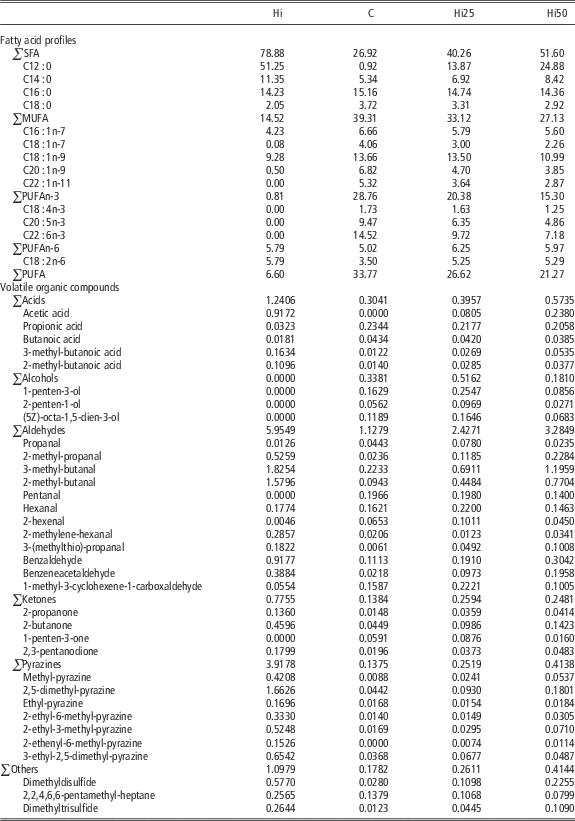
Lipids were extracted from fish muscle according to the method of Bligh and Dyer (Reference Bligh and Dyer1959), then the extracted lipids were methylated according to the method of Lepage and Roy (Reference Lepage and Roy1986). Nonadecanoic acid (C19 : 0) was used as internal standard and fatty acid methyl esters were analysed according to the method of Christie (Reference Christie1982), with a gas chromatograph Perkin Elmer Clarus 500 capillary (Perkin–Elmer, Shelton, CT, USA) equipped with a split/splitless injector (8 : 1) and a fused silica capillary column SP-2330 (0.25 mm i.d.×30 m; Supelco Inc., Bellefonte, PA, USA) programmed from 140°C to 205°C at 1.0°C/min. Nitrogen at 10 psig. was the carrier gas and a flame ionisation detector set at 250°C was used. Fatty acids were identified and quantified by comparison with retention times, and response factors provided by a mixture of fatty acid methyl esters standards. Fatty acids profile of Hi and experimental diets are reported in Table 1.
Fatty acid profiles (% of total fatty acids) and volatile organic compounds (mg/kg of sample) of Hermetia illucens larvae meal (Hi) and experimental diets

C=control diet; Hi25=25% substitution of fish meal with Hi; Hi50=50% substitution of fish meal with Hi; SFA=saturated fatty acids; MUFA=monounsaturated fatty acid; PUFA=polyunsaturated fatty acids.
The fatty acids C14 : 1n-5, C15 : 0, C17 : 0, C17 : 1n-7, C18 : 3n-3, C20 : 0, C20 : 1n-11, C20 : 2n-6, C20 : 3n-6, C20 : 4n-3, C20 : 4n-6, C22 : 1n-9, C24 : 1n-9 and C22 : 5n-3 were detected but not listed in the table because below 1.5%. All the mentioned fatty acids have been utilised for calculating the sums of the lipid fractions.
Volatile organic compounds
Volatile solid-phase extraction was performed as reported by Iglesias and Medina (Reference Iglesias and Medina2008) and modified by Fratini et al. (Reference Fratini, Lois, Pazos, Parisi and Medina2012). Minced muscle, 5 g, was homogenised with 10 ml of ultrapure water saturated in NaCl (over 36 g/100 ml of water). The mixtures were centrifuged at 4°C for 20 min at 3500 r.p.m. (Allegra®X-12R; Beckman Coulter Inc., Brea, CA, USA) and 6 ml of the supernatants were pipetted in 20 ml glass vials fitted with a silicone septum. A quantity of 50 µl of 3-metil-3-buten-1-ol (50 ppm in ultrapure water) was added to each sample as internal standard. CarboxenTM/Polydimethylsiloxane (75 μm) (CAR-PDMS; Supelco Inc.) fibres were used for the absorption of volatile compounds in the headspace of the vial. Vials were maintained at 60°C for 30 min in order to allow a better absorption of the fibres under continuous magnetic stirring. Volatiles were desorbed from the fibre at 260°C for 10 min in the gas chromatograph injection.
The determination of the VOCs was performed as reported by Fratini et al. (Reference Fratini, Lois, Pazos, Parisi and Medina2012). A Thermo Finnigan ThermoQuest (San Jose, CA, USA) gas chromatograph, equipped with a split/splitless injector and coupled with a trace quadrupole mass detector was used. Helium with a constant flow of 1 ml/min was employed as carrier gas. The initial temperature was set at 35°C and held for 3 min, followed by an increase of 4°C/min to 140°C; then an increase of 20°C/min to the final temperature of 260°C hold for 7 min.
Volatile compounds were separated in a capillary column (30 m×0.250 mm×1 μm film thickness, fused silica DB-1701; Folsom, CA, USA). Splitless mode was set on the injector and the temperature of both injector and transfer line was maintained at 250°C. Electron impact mode was set in the quadrupole mass spectrometer (source temperature 200°C). Selected ion monitoring mode was used to acquire data after a full scan mode (mass range: 10 to 200 amu and scan rate: 0.220 s/scan). Ionisation energy was set at 70 eV, filament emission current at 150 μA and the electron multiplier voltage at 500 V.
Wiley 6, Mainlib and Replib libraries and comparison with mass spectra and retention times of commercial standards were used for the identification of the components. Method of internal standard calibration was used to determinate quantitatively the ratio between the area of the sample’s compound and the internal standard (3-methyl-3-buten-1-ol). Results were expressed as mg of volatile compound/kg of sample.
Volatile organic compounds of experimental diets (C, HI25 and HI50) and Hi are reported in Table 1.
Separation of sarcoplasmic and myofibrillar proteins
Sarcoplasmic (low-salt-soluble) and myofibrillar (high-salt-soluble) proteins were isolated as reported by Pazos et al. (Reference Pazos, Pereira, Rocha, Roepstorff and Rogowska-Wrzesinska2011). Protein concentrations were determined in both fractions by bicinchoninic acid assay (Smith et al., Reference Smith, Krohn, Hermanson, Mallia, Gartner, Provenzano, Fujimoto, Goeke, Olson and Klenk1985) and contents were expressed as g/kg of muscle.
Polyacrylamide gels laboratory-made at a concentration of 12.5% with upper stacking gel at 4% were loaded with 25 µg of protein per lane. Both sarcoplasmic and myofibrillar proteins of each trout were analysed three times. Gels were run in a Mini-Protean 3 cell (Bio-Rad, Hercules, CA, USA) with an aqueous running buffer (1.44% (w/v) glycine, 0.67% Tris-base and 0.1% SDS). Thermo Scientific PageRuler Unstained Protein Ladder (Thermo Fisher Scientific, Rockford, IL, USA) was used as standard size marker (10 to 200 kDa). Gels were stained overnight with the Coomassie dye and then were scanned. Densities of bands were quantified by Gel Analyzer 2010a software (Gel Analyzer, 2010) and the relative band density was calculated as a percentage ratio between density of each band and total band density (sum of all band densities) of each lane.
Statistics
Data obtained from quantification of fillet proximate composition, colour indexes, fatty acids profile, VOCs, nucleotides, myofibrillar and sarcoplasmic proteins quantification were analysed with the following linear model:
 $$Y_{{iz}} \,{\equals}\,\mu {\plus}\alpha _{i} {\plus}e_{{iz}} $$
where Y iz is the dependent variable of the zth observation; µ the overall mean; α i the effect of the diet (i=C, Hi25, Hi50) and e iz the random error. One-way ANOVA was conducted, and the data are reported as the mean of the diet effect; the variability was expressed as root mean square error. The statistically significant level of 5% was set (P<0.05) and the differences were assessed using Tukey’s test (P<0.05).
Principal components analysis (PCA) was performed on colour parameters (lightness (L *), redness (a *) and yellowness (b *) indexes), nucleotides (Hx, Ino, IMP, AMP and ADP), fatty acids profile, VOCs of the trout muscle; all the data were mean centred and scaled to a unit standard deviation before analysis. R free statistical software was used (R Core Team, 2015).
Results
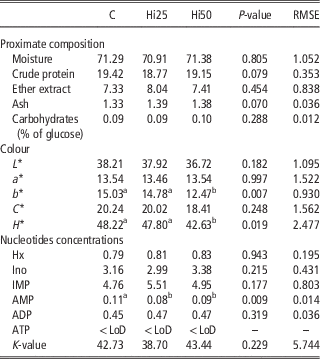
Fish (C, Hi25 and Hi50) showed that were not affected in their proximate composition (P>0.05, Table 2) by the three different diets they were fed. Moreover, nor percentage of glucose in the muscle was affected by the diet (P>0.05, Table 2).
Proximate composition (%), colour and nucleotides concentration (µmol/g sample) of fillets of rainbow trout fed experimental diets

C=control diet; Hi25=25% substitution of fish meal with Hermetia illucens meal; Hi50=50% substitution of fish meal with H. illucens meal; RMSE=root mean square error; Hx=hypoxanthine; Ino=inosine; IMP=inosine monophosphate; AMP=adenosine monophosphate; <LoD=below limit of detection.
a, b Values in the same row indicate significant differences between samples (P<0.05).
On the contrary, yellowness (b*) and hue (H *) indexes were modified by the partial substitution of fish meal with H. illucens meal (Table 2). Trout fed Hi50 diet showed lower value of b* index and, as consequence, lower value of hue than trout fed the other two diets (P<0.01 and P<0.05, respectively, for b* and H*). Colour differences (ΔE) between C and Hi25 trout (ΔE value=0.39) showed to be lower than the threshold of a noticeable level of difference (set for the human eye to 2.30); instead ΔE values calculated between C and Hi50 or between Hi25 and Hi50 fillets showed higher values than the threshold (2.96 and 2.60, respectively).
No significant effect of diet was observed for nucleotides concentrations, except for AMP with lower values in fillet of fish fed Hi25 and Hi50 diets than in fillets of the control ones (P<0.01, Table 2).
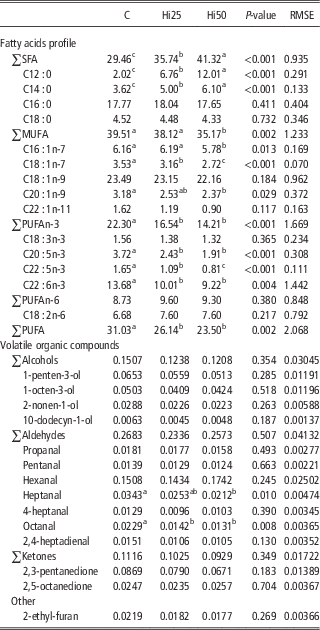
Fatty acids profiles of rainbow trout were largely modified by the diets (Table 3). Sum of saturated fatty acids (SFA) showed a significant increment of percentage in relationship with the percentage of inclusion of the insect meal (P<0.001). This modification is the consequence of the higher values of C12 : 0 and C14 : 0 in Hi50 than Hi25, as well as, of the higher value of Hi25 than C (both P<0.001). Monounsaturated fatty acids (MUFAs) and C16 : 1n-7 percentages were not significantly different between C and HI25, whereas Hi50 showed the lowest values (P<0.01 and P<0.05, respectively). Moreover, C18 : 1n-7 and C20 : 1n-9 percentages showed inverse relationship with the presence of Hi (P<0.001 and P<0.05, respectively).
Fatty acid profile (% of total fatty acids) and volatile organic compounds (mg/kg of sample) rainbow trout of fillets fed experimental diets

C=control diet; Hi25=25% substitution of fish meal with Hermetia illucens meal; Hi50=50% substitution of fish meal with H. illucens meal; RMSE=root mean square error; SFA=saturated fatty acids; MUFA=monounsaturated fatty acid; PUFA=polyunsaturated fatty acids.
The fatty acids C14 : 1n-5, C15 : 0, C17 : 0, C17 : 1n-7, C18 : 4n-3, C20 : 0, C20 : 1n-11, C20 : 2n-6, C20 : 3n-6, C20 : 4n-3, C20 : 4n-6, C21 : 0, C22 : 1n-9, C22 : 1n-11 and C24 : 1n-9 were detected but not listed in the table because below 1.5%. All the mentioned fatty acids have been utilised for calculating the sums of the lipid fractions.
a,b,c Values in the same row indicate significant differences between diet treatments (P<0.05).
Inclusions of Hi induced decreases of n-3 polyunsaturated fatty acids (PUFA) and total PUFA (P<0.001 for PUFAn-3 and P<0.01 for total PUFA). No statistical differences of C20 : 5n-3 and C22 : 6n-3 contents were shown between Hi25 and H50 fish groups with lower amounts than fish fed C diet (P<0.001 and P<0.01, respectively) whilst the percentages of C22 : 5n-3 showed to decrease with the presence of Hi (P<0.001).
Results of VOCs showed minimum differences in fillets characteristics between fish fed the different experimental diets (Table 3). Two molecules, heptanal and octanal, both belonging to the aldehydes classification showed to decrease their concentrations as function of the presence of Hi in the diet. In fillets of fish fed Hi25 diet the concentration of heptanal was intermediate between the highest value of fish fed C and the lowest value showed by fish fed Hi50 diet (P=0.01). Octanal concentration was lower in fillets of both fish fed Hi25 and Hi50 than in those of fish fed C diet (P<0.01).
Sarcoplasmic concentration was not influenced by diet (P>0.05); results of fish fed C, Hi25 and Hi50 diets were 0.26±0.04, 0.30±0.02 and 0.31±0.02 mg of sarcoplasmic protein on g of muscle, respectively.
On the other hand, a significant reduction of myofibrillar concentration was observed in fish fed Hi50 diet (P<0.01). Myofibrillar proteins concentration in fillets of fish fed Hi50 was 0.47±0.02 mg on g of sample, whereas, C and Hi25 diets induced concentrations of 0.53±0.05 and 0.58±0.04 mg/g, with no statistical difference between C and Hi25.
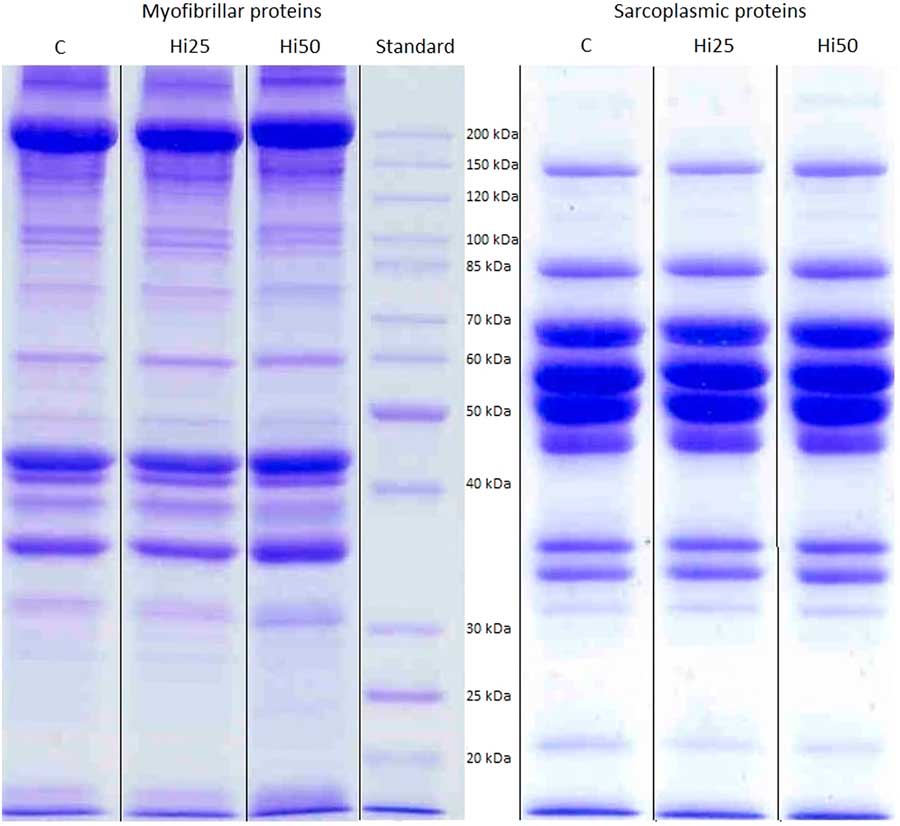
Polyacrylamide gels of myofibrillar and sarcoplasmic proteins showed no modifications of protein patterns among fish fed the three different experimental diets (Figure 1). Moreover, the relative band density percentage ratios did not show differences between diets (data not showed).
Polyacrylamide gels of myofibrillar and sarcoplasmic proteins in muscle of rainbow trout fed the experimental diets (example of one sample of each diet; SDS-PAGE 12.5%; 25 µg of protein per lane). Full gels are shown in the Supplementary Figures S1 and S2. Hi=Hermetia illucens larvae meal; C=control diet; Hi25=25% substitution of fish meal with Hi; Hi50=50% substitution of fish meal with Hi.

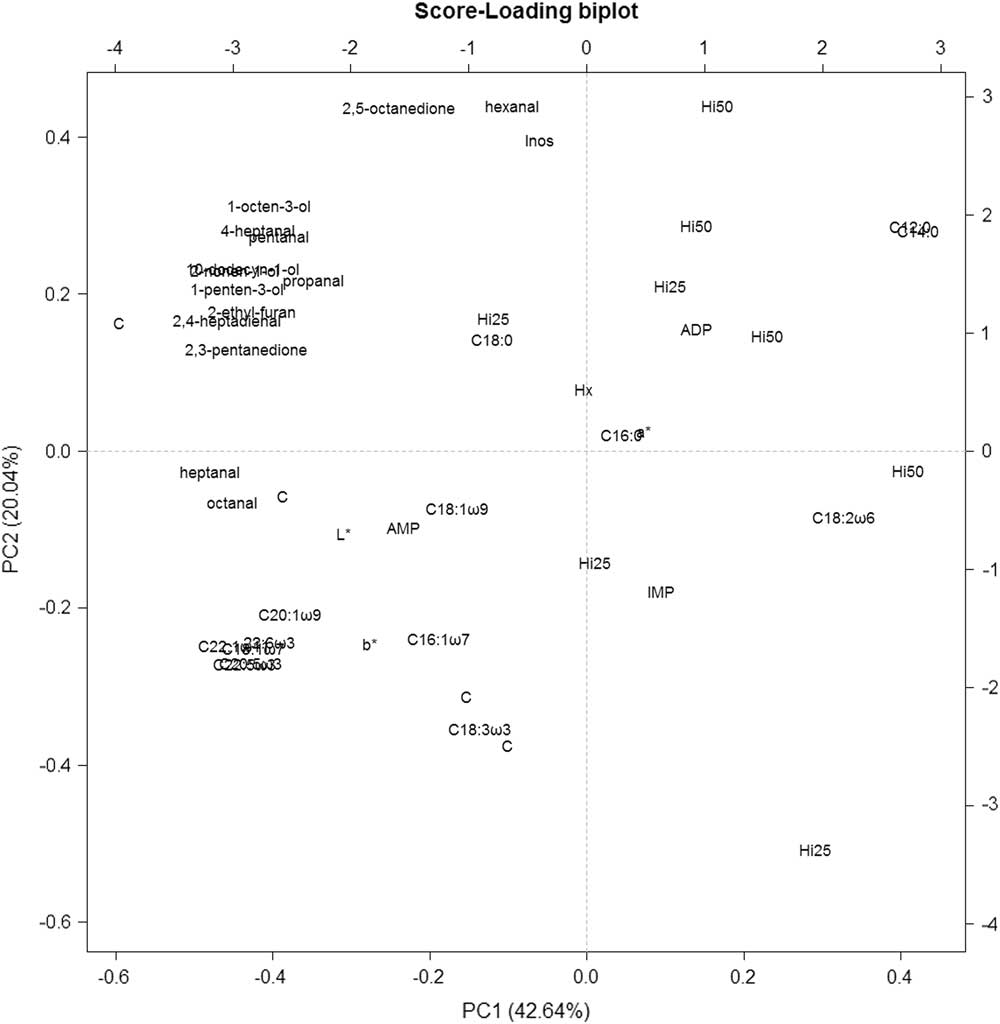
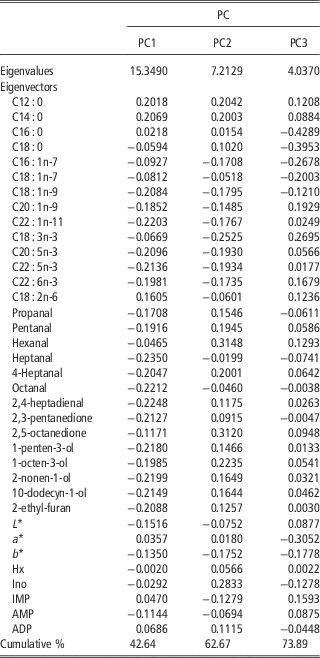
Principal component analysis of colour parameters (L*, a* and b*), nucleotides (Hx, Ino, IMP, AMP and ADP), FA profiles and VOCs was performed in order to detect the principal components that better describe the modifications highlighted (Figure 2). Eigenvalues, eigenvectors and cumulative % of the first three principal components were reported in Table 4.
Biplot of principal component (PC) analysis of rainbow trout muscle characteristics.

Eigenvalues and eigenvectors of the first three principal components (PC) of principal components analysis conducted on fatty acids profile, volatile organic compounds, colour parameters and nucleotides of fillets of rainbow trout fed experimental diets

Hx=hypoxanthine; Ino=inosine; IMP=inosine monophosphate; AMP=adenosine monophosphate.
Discussion
Researches on the effect of dietary Hi in rainbow trout reported that substitution of fishmeal up to 50% did not statistically affect growth performances, weight gain and feed conversion ratio even if trends of reductions were shown (St-Hilaire et al., Reference St-Hilaire, Sheppard, Tomberlin, Irving, Newton, McGuire, Mosley, Ronald and Sealey2007; Makkar et al., Reference Makkar, Tran, Heuzé and Ankers2014). Moreover, digestibility trials (Renna et al., Reference Renna, Schiavone, Gai, Dabbou, Lussiana, Malfatto, Prearo, Capucchio, Biasato, Biasibetti, De Marco, Brugiapaglia, Zoccarato and Gasco2017) reported that apparent digestibility coefficients (ADC) of ether extract and gross energy were affected by the diets, whereas ADC of dry matter and CP were higher in Hi25 if compared with Hi50.
On the other hand, chemical composition of fillets could vary due to diet formulations and percentage of Hi inclusions. St-Hilaire et al. (Reference St-Hilaire, Sheppard, Tomberlin, Irving, Newton, McGuire, Mosley, Ronald and Sealey2007), using not isoproteic and isolipidic diets, reported decreases in moisture and lipid contents in fish fed diet containing Hi. In the present study, no significant modification in proximate compositions was detected. This lack of modification might be attributable to the adjustment of fish oil content done in the diets Hi25 and Hi50 in order to reach isoenergetic diets (Borgogno et al., Reference Borgogno, Dinnella, Iaconisi, Fusi, Scarpaleggia, Schiavone, Monteleone, Gasco and Parisi2017).
Colour of whole fillet, calculated using digital images, showed to be affected by diets only in the yellowness index and, as a consequence, on hue calculated value. Fillets of rainbow trout fed with the 50% of substitution of fish meal with Hi meal showed a paler colour (greyer) than the other fillets, with differences in colour (ΔE) noticeable by human eye. Modifications in rainbow trout colour were also detected by D’Souza et al. (Reference D’Souza, Skonberg, Stone and Brown2006) in fish fed experimental diet where fish meal was partially replaced with soybean but not in yellowness index. Several studies reported a decrease in yellowness index in correlation with a decrease of astaxanthin muscles deposition. Nickell and Bromage (Reference Nickell and Bromage1998) observed how low lipid content diet affected b*, as well as L*, a* and C*. In our study the decrease of b* index was in concomitance with a higher content of SFA and lower content of PUFA in Hi50 group than the other two diet groups.
Nucleotides quantification showed that only AMP concentration was affected by the diet. It is widely accepted that nucleotides could influence fish taste and flavour, most of all IMP is related with the umami taste and AMP could play a role as flavour-enhancing (Shirai and Kikuchi, Reference Shirai and Kikuchi2002; Tejada, Reference Tejada2009). This decrease of AMP in Hi25 and Hi50 might attenuate the normal taste and flavour of trout and promote the perception of secondary compounds (as metallic taste) leading to a more complex sensory profile (Borgogno et al., Reference Borgogno, Dinnella, Iaconisi, Fusi, Scarpaleggia, Schiavone, Monteleone, Gasco and Parisi2017).
Interestingly, several modifications were shown in the FA profile of rainbow trout fillets as a consequence of the experimental diets. If on one hand the inclusion of Hi in the diet modified gradually the increased portions of SFA (both C12 : 0 and C14 : 0) and the decreased portions of C18 : 1n-7 and C22 : 5n-3, on the other hand, Hi25 diet did not statistically modify total MUFA (as well as the individual C16 : 1n-7 and C20 : 1n-9 percentages). Moreover, both the inclusions of Hi (Hi25 and Hi50) decreased the contents of PUFAn-3 (individually C20 : 5n-3 and C22 : 6n-3 percentages) and total PUFA. The trends showed in trout FA profiles could be ascribed to the FA profiles of the diets.
Reductions in PUFA and particularly in PUFAn-3 were reported in other research studies about insect meal as fish feedstuff (Belforti et al., Reference Belforti, Gai, Lussiana, Renna, Malfatto, Rotolo, De Marco, Dabbou, Schiavone, Zoccarato and Gasco2015; Gasco et al., Reference Gasco, Henry, Piccolo, Marono, Gai, Renna, Lussiana, Antonopoulou, Mola and Chatzifotis2016).
Hermetia illucens is one of the most studied insect for future feed purposes, both for its easiness to be reared in different and low-cost material (such as waste or manure) and for its relatively short time of production (van Huis et al., Reference van Huis, Van Itterbeeck, Klunder, Mertens, Halloran, Muir and Vantomme2013). Although fatty acid composition of some insects could vary with the composition of the diet used to rear the larvae (Makkar et al., Reference Makkar, Tran, Heuzé and Ankers2014), it was shown that H. illucens metabolises a large proportion of fatty acids to C12 : 0, as final form of biological storage (Oonincx et al., Reference Oonincx, van Broekhoven, van Huis and van Loon2015). Indeed, Hi meal reported to be high in SFA, mostly C12 : 0, and this composition modified consequently the FA profile of the experimental diets (Hi25 and Hi50 diets were richer in C12 : 0 and C14 : 0 and poorer in MUFA and PUFA than C diet).
These modifications in feedstuff affected the concentrations of the main FAs of the fillets, principally of fish fed Hi50; if all the samples showed highest values of C18 : 1n-9, followed by C16 : 0, Hi50 fillets reported C12 : 0 as third FA more present instead of C22 : 6n-3. Moreover, the value of C12 : 0 in Hi50 fillets was double than in Hi25 and six time than in C fillets.
Hi meal and experimental diets showed a large number of different VOCs. Hi meal showed several molecules probably related to the nature of the meal and to the industrial process; various aldehyde and ketone molecules might be derived directly from the insect base, in addition to secondary modification occurred during the industrial process; as well as, pyrazines probably derived mostly from the industrial process. As aldehydes, ketones and pyrazines concentrations were largely represented in Hi, and consequently, in Hi25 and Hi50 diets.
Hi volatile profile was mainly characterised by the presence of 3-methyl-butanal, 2,5-dimethyl-pyrazine, 2-methyl-butanal, benzaldehyde and acetic acid. These molecules were partially represented in C feedstuff and increased their contents in Hi25 and Hi50 as a consequence of the substitution of fish meal with Hi. However, the presence of these compounds was not detected in fillets corresponding to Hi25 or Hi50. No acids or pyrazines, shown in the feedstuffs, were detected in the fillets, even in the Hi50 where the concentrations in the feed were the highest. These absences in dietary-derived VOCs in the fillets could be related to a degradation of the molecules by the digestive tract of the fish, as well as, to a lack of muscle deposition. On the contrary, only two molecules showed different concentrations in the rainbow trout fillet VOCs profile.
Heptanal and octanal are both described as green-fruity odour, and are commonly detected in rainbow trout muscle (Selli et al., Reference Selli, Rannou, Prost, Robin and Serot2006) and in general in fish and seafood products (Fratini et al., Reference Fratini, Lois, Pazos, Parisi and Medina2012; Wang et al., Reference Wang, He, Wang, Tao, Wu, Wang, Qiu and Ma2016). In all the samples, octanal concentration was higher than the odour detection threshold (ODT) (0.46 ppb; Cometto-Muñiz and Abraham, Reference Cometto-Muñiz and Abraham2010), instead heptanal of Hi25 and Hi50 fed rainbow trout was lower than the respective ODT (2.80 ppb; Wang et al., Reference Wang, He, Wang, Tao, Wu, Wang, Qiu and Ma2016). Heptanal, as well as octanal, is related to fishy flavour (Selli and Cayhan, Reference Selli and Cayhan2009); the decrease of specific compounds (associated with the decrease of AMP) could modify sensory perception and evaluation, as reported in Borgogno et al. (Reference Borgogno, Dinnella, Iaconisi, Fusi, Scarpaleggia, Schiavone, Monteleone, Gasco and Parisi2017) where fish fed Hi25 and Hi50 showed an increased intensity of metallic flavour.
The first two principal components (PC1: 42.64% and PC2: 20.04%) of colour parameters, nucleotides, FA profiles and VOCs differentiate fillets, since C samples are located all in the left squares and Hi25 and Hi50 closely each other (Figure 2).
Positives eigenvectors collocate C12 : 0 and C14 : 0 in the upper right square, closely to Hi25 and Hi50 samples. Monounsaturated fatty acids and PUFA, that showed statistical different concentrations between diets, were all located in the lower left square (both negatives eigenvectors), showing to be more correlated to the C samples. Heptanal and octanal were divided from the other VOCs as more related to the C samples and significantly affected by Hi inclusion. Moreover, also AMP and b* values showed negative eigenvectors and were plotted closely to the C samples.
As result of the new axes plotting, all the parameters that showed a statistical significance were plotted in the upper right or the lower left squares (both eigenvectors positives or negatives).
The observations reported above suggest that PC1 and PC2 were both a part of the diet effect related to the amount of replacement of the fish meal and to the level of unsaturation of fillets’ fatty acids (strictly associated to the formation of the VOCs).
A residual percentage of variance (11.21%) was expressed also by PC3; this principal component was mostly related to several parameters that were not affected by the diet, as the highest eigenvectors for PC3 (as absolute values) were shown by C16 : 0, C18 : 0 and a*. All P values of these parameters were highly not statistical significant for the diet factor. Thus, PC3 might be associated to some intrinsic factors of the rainbow trout.
Myofibrillar proteins content was affected by the substitution of the 50% of fish meal with insect meal. This modification might affect sensory characteristics of fillets. Indeed, analysis on temporal dominance of sensations conducted by Borgogno et al. (Reference Borgogno, Dinnella, Iaconisi, Fusi, Scarpaleggia, Schiavone, Monteleone, Gasco and Parisi2017) on rainbow trout fed Hi highlighted a decrease of fibrousness in the first part of the evaluation with the increase level of Hi substitution. This modification in fillet characteristics could be ascribable to the chitin content of the larvae meal and its adverse effects on the digestibility of nutrients (Rust, Reference Rust2002). No modifications in proteins pattern were shown nor for sarcoplasmic and myofibrillar proteins. This statement suggests that the modification in the concentration of myofibrillar fraction of protein was ascribable to a general lower amount of digestible protein and not to a lack of nutrients.
Other studies on channel catfish, blue tilapia, rainbow trout and turbot fed insect meal showed, at least, a trend to a decrease of growth when the substitution/inclusion of this type of meal was near to 50%, as the diets did not provide sufficient dry matter or protein intake (Makkar et al., Reference Makkar, Tran, Heuzé and Ankers2014).
In conclusion, substitution of fish meal with H. illucens meal could be a potential future solution in order to decrease the quantity of fish meal used in aquafeeds. Moreover, the possibility to rear insect on by-product or waste could influence the cost of the product and the future acceptability of insect as feed/food. Anyhow, modifications in the feedstuff might affect the chemical and sensorial characteristics of the final products. Results of this work highlighted the influence of insect meal on the rainbow trout fillets mostly on fatty acids profile. These modifications were related to the chemical composition of the H. illucens meal and to the percentage of inclusion in the diet. Further research studies might be focused on the rearing stage of H. illucens in order to modify its fatty acids composition and its yield of SFA when used as feedstuff. Volatile organic compounds were partially modified but without the appearance of new compounds related to the insect meal.
Acknowledgements
The authors gratefully acknowledge the Erasmus+ traineeship for Simone Mancini’s and Ana Basto’s grant. Lorena Barros and María Jesús González from IIM-CSIC are gratefully acknowledged for their help and technical supervision. The research was funded by University of Florence, Ateneo Research Project (2014).
Supplementary material
To view supplementary material for this article, please visit https://doi.org/10.1017/S1751731117003421