INTRODUCTION
Atlantic waters off Guinea-Bissau belong to the tropical West African region, situated between Cape Blanc in Mauritania (20°50′N) and Cape Frio in Northern Namibia (18°30′N) (Le Loeuff & Von Cosel, Reference Le Loeuff and Von Cosel1998), which is characterized by a specific marine fauna. The Guinea-Bissau marine ecosystem is strategically situated between two large marine ecosystems (LME): the southern limit of the Canary Current LME and the western limit of the Guinea LME, both being considered as highly productive (Heileman, Reference Heileman, Sherman and Hempel2009; Heileman & Tandstad, Reference Heileman, Tandstad, Sherman and Hempel2009). In the tropical West African region, the combination of a number of climatic and hydrological factors contributes to the existence of an exceptional environment, even more marked in Guinea-Bissau due to the great extension of its continental shelf, which has encouraged the presence of foreign industrial fleets for decades.
Extensive literature reviewing the effects of fishing on benthic habitats makes the case that essentially all trawling impacts the benthic environment (see reviews of Stevenson et al., Reference Stevenson, Chiarella, Stephan, Reid, Wilhelm, McCarthy and Pentony2004; Løkkeborg, Reference Løkkeborg2005). Continuous otter trawling has been shown to have a significant, negative effect on benthic fauna abundance, biomass and species richness. It has also led to changes in community composition of benthic fauna (Thrush et al., Reference Thrush, Hewitt, Cummings, Dayton, Cryer, Turner, Funnel, Budd, Milburn and Wilkinson1998; Thrush & Dayton, Reference Thrush and Dayton2002; Hinz et al., Reference Hinz, Prieto and Kaiser2009), which may have further implications for the integrity of marine food webs (Hinz et al., Reference Hinz, Prieto and Kaiser2009). Therefore, studies on macrobenthic communities have been traditionally carried out to evaluate the trawling effects on marine ecosystems, as changes in macrobenthic species composition are good indicators of fishing pressure.
Decapod crustaceans constitute one of the dominant groups of megabenthic invertebrates on the Atlantic continental shelf and slope (Haedrich et al., Reference Haedrich, Rowe and Polloni1975; Wenner & Boesch, Reference Wenner and Boesch1979; Macpherson, Reference Macpherson1991; Bianchi, Reference Bianchi1992a,Reference Bianchib; Fariña et al., Reference Fariña, Freire and González-Gurriarán1997). Furthermore, interest in their study is greater, considering the fact that they constitute a key taxon linking lower and higher trophic levels (Wenner & Boesch, Reference Wenner and Boesch1979; Cartes, Reference Cartes1998). Although decapod crustacean assemblages have been intensively studied in Mediterranean waters (Abelló et al., Reference Abelló, Valladares and Castellón1988, Reference Abelló, Carbonell and Torres2002; Cartes & Sardà, Reference Cartes and Sardà1993; Maynou et al., Reference Maynou, Conan, Cartes and Company1996; Maynou & Cartes, Reference Maynou and Cartes2000; Company et al., Reference Company, Maiorano, Tselepides, Politou, Plaity, Rotllant and Sarda2004; Politou et al., Reference Politou, Maiorano, D'Onghia and Mytilineou2005; Ungaro et al., Reference Ungaro, Marano, Ceriola and Artino2005; Fanelli et al., Reference Fanelli, Colloca and Ardizzone2007; García Muñoz et al., Reference García Muñoz, Manjón-Cabeza and García Raso2008), in proportion fewer studies have been carried out in Atlantic waters, most of them being conducted in the North Atlantic (Haedrich et al., Reference Haedrich, Rowe and Polloni1975; Wenner & Boesch, Reference Wenner and Boesch1979; Wenner et al., 1982; Fariña et al., Reference Fariña, Freire and González-Gurriarán1997; Wicksten & Packard, Reference Wicksten and Packard2005; Cartes et al., Reference Cartes, Serrano, Velasco, Parra and Sánchez2007). However, most published decapod crustacean studies carried out in West African Atlantic waters have traditionally focused on taxonomic aspects of the species (i.e. Crosnier & Forest, Reference Crosnier and Forest1973; Kensley, Reference Kensley1980; Anadón, Reference Anadón1981; Macpherson, Reference Macpherson1983, Reference Macpherson1988). Further information on decapod crustaceans in West African waters can be obtained from more global studies of demersal assemblages developed in waters off Namibia (Lleonart & Roel, Reference Lleonart and Roel1984), Angola (Bianchi, Reference Bianchi1992b), Congo and Gabon (Bianchi, 1992a). Research on macrobenthic communities has been undertaken in shallow waters of the continental shelf of Guinea (Le Loeuff, Reference Le Loeuff1993) and Côte d'Ivoire (Le Loeuff & Intès, Reference Le Loeuff and Intès1999). More specific works on different aspects related to the biogeography or community structure of decapod crustaceans have been carried out in waters off Namibia (Macpherson, Reference Macpherson1991) or South Africa (Kensley, Reference Kensley2006). However, the decapod crustacean communities on the Guinea-Bissau coast are greatly unknown, in spite of their important ecological role within the megabenthic assemblages.
This study constitutes a first contribution to the knowledge about the ecology of the decapod crustaceans in waters off Guinea-Bissau. Its first aim is the description of the decapod faunal composition on the trawlable bottoms of the continental shelf and slope off the Guinea-Bissau coast. Furthermore, it contributes to the knowledge of the ecology of decapod crustacean communities by describing their bathymetric and geographical distribution, by quantifying their abundance and diversity, and by defining the main decapod assemblages in the area.
MATERIALS AND METHODS
Study area
Guinea-Bissau is located at the southern limit of the Canary Current System and the western limit of the Gulf of Guinea System. The Guinea-Bissauan continental shelf is the largest in Western Africa, with a width of more than 75 miles in the north, 60 miles in the south, and an extension of about 10,800 m2 (Ramos et al., Reference Ramos, Sobrino, García and Fernández1991). In the southern area, the shelf reduces its extension to an effective width of 30 miles due to the presence of the Bijagos Islands. The coasts are deeply cut out by the numerous rivers that open into the sea in this area (Domain, Reference Domain1980). It contains one of the biggest estuarine areas and one of the most extensive mangrove zones in West African coastal waters (Binet et al., Reference Binet, Le Reste and Diouf1995).
Three main zones can be distinguished depending on the sediment's nature and bathymetry. There is a shallow area (20–75 m depth), with soft bottoms (mud and sand) in the northern area (mainly related to the river mouth), and with hard bottoms from Bijagos to the Guinean border in the south, externally associated with coral reefs and crossed by numerous submarine canyons and valleys (McMaster et al., Reference McMaster, Lachance and Ashraf1971). At bottoms deeper than 200 m, deposits vary from soft (mud and sand) to hard (rubble, gravel and rocks). At depths between 400 and 600 m, sediments are all soft.
The Guinea-Bissau ecosystem is characterized by strong seasonal variations of oceanographic conditions (Berrit & Rebert, Reference Berrit, Rebert and Berri1977), with higher productivity during the dry season (Longhurst, Reference Longhurst1983) due to the upwelling events that mainly occur from January to February. Characteristically warm and salty tropical waters dominate from May to June. With the progression of the rainy season, the intrusion of warm, low salinity inner waters tend to dominate. As a result of upwelling events and the input of organic matter from river run-off, primary productivity is relatively high in the area (Berrit & Rebert, Reference Berrit, Rebert and Berri1977). The coastal areas are also under the influence of strong currents and occasional strong winds.
Data collection
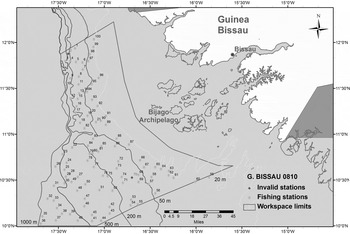
The decapod crustaceans examined in this study were collected in a research survey along the Guinea-Bissauan coasts (central-eastern Atlantic), in the context of a scientific collaboration framework between Spain and Guinea-Bissau. The survey ‘GUINEA-BISSAU 0810’ was carried out on-board the RV ‘Vizconde de Eza’ during 22 days in October–November 2008 (the transition period between the wet and dry season). The survey area covered 19,847 km2, from 12°22′N to 10°00′N (Figure 1). A total of 98 valid hauls were carried out during daytime at depths ranging between 20 and 1000 m. A random stratified sampling design based on four bathymetric strata (<50 m, 50–200 m, 200–500 m and 500–1000 m) was used. Hauls of standard 30 minutes' duration were conducted using a ‘Conakry’ otter bottom trawl (‘baka’ type).
Map of the study area and positions of trawl stations in the survey ‘GUINEA BISSAU 0810’.

Decapods taken in each haul were sorted and keyed as specifically as possible to the lowest taxonomic level, then counted and weighed. In order to check and complete the species identification, specimens of all the species caught during the survey were preserved and transported to the laboratory, where they were exhaustively reviewed.
Data analysis
Species abundance (number of individuals/haul) was calculated and species biomass (tonnes) was estimated by the swept area method (Sparre & Venema, Reference Sparre and Venema1998). Occurrence (as the frequency of appearance of the species in the valid hauls) and bathymetric ranges were calculated for each species.
Diversity measures, such as species richness and the Shannon–Wiener diversity index were calculated by haul. Average values were estimated by depth strata and total area. Patterns of distribution were analysed for each depth stratum.
To identify species assemblages and its relationship to different factors, cluster analysis was applied to the decapod crustacean abundance-hauls matrix, after performing a fourth-root transformation. Those species appearing with both low frequency (<10% of the hauls) and low abundance (<30 individuals/haul) were removed, as well as those hauls of only one species. Similarity levels between hauls were calculated by means of the Bray–Curtis index (Clifford & Stephenson, Reference Clifford and Stephenson1975). The environmental variables included were depth and bottom type. Regarding the bottom type, the area under study was divided according to the nature of sediment, at the latitude 11°30′N, following the criterion of previous works (Amorim et al., Reference Amorim, Mané and Stobberup2002). A two-way crossed analysis of similarities (ANOSIM) was performed to test for statistically significant differences in macrofaunal assemblage structure between samples.
Non-metric multidimensional scaling (MDS) was conducted on the same matrix of decapod crustacean abundance-hauls to place the samples (hauls) in a two-dimensional ordination space. The similarity percentages (SIMPER) procedure was used to characterize the species assemblage by calculating the contribution of each species to the similarity (typical species) and dissimilarity (discriminating species) between groups of samples belonging to the same depth stratum (Clarke & Warwick, Reference Clarke and Warwick2001). The above mentioned analyses were computed with the software package PRIMER (Plymouth Routines In Multivariate Ecological Research) version 6 (Clarke & Warwick, Reference Clarke and Warwick2001).
RESULTS
Species composition and diversity
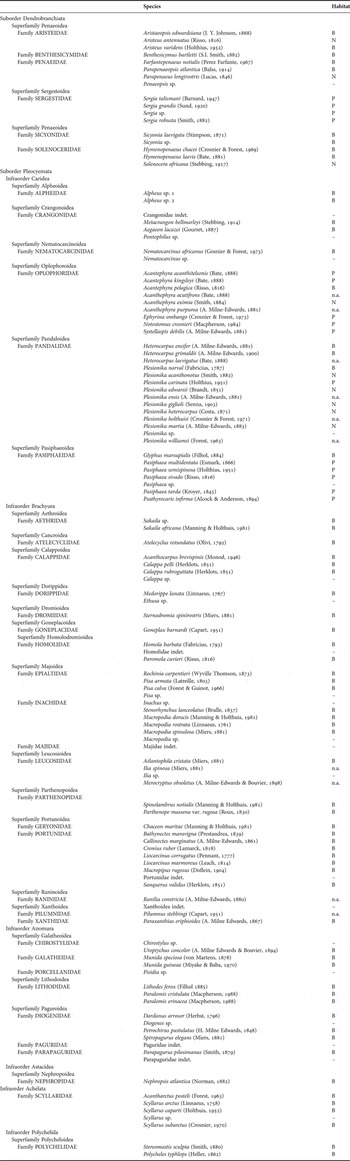
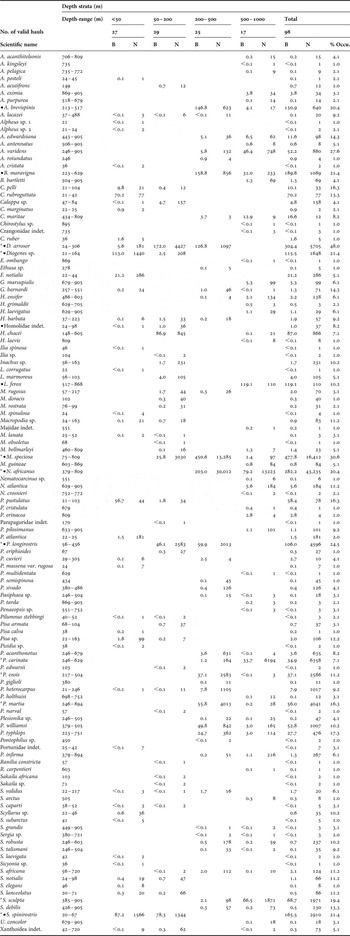
A total of 122 decapod species, belonging to 39 families were identified. Table 1 shows the taxonomic list of the species. Regarding their relative location in the water column, species were classified as pelagic, nectobenthic (those swimming or hovering above the sea bottom) and benthic (those that live on or in the sea bottom). Table 3 summarizes the bathymetric range of occurrence of each species. It is worth noting that certain observations made in the current work increase the bathymetric range of some species in Atlantic waters in relation to those cited in the literature for Atlantic waters (García-Isarch, personal communication).
Decapod crustacean species collected by trawling off Guinea-Bissau (north-west Africa). B, benthic species; P, pelagic species; N, nectobenthic species; n.a., not available.

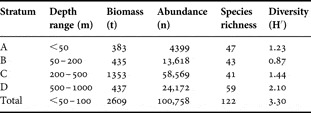
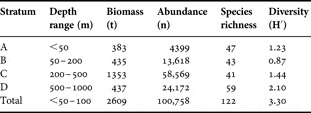
Average values of species richness and diversity (Shannon–Wiener diversity index, H′) by stratum (Table 2) generally increased with depth, the deepest stratum (500–1000 m depth) being the one with the highest number of decapod species (59) and the greatest diversity (H′ = 2.1). The lowest diversity value (H′ = 0.87) was found in the 50–200 m depth stratum, possibly due to the presence of one single species in some trawls (always the left-handed hermit crab Dardanus arrosor).
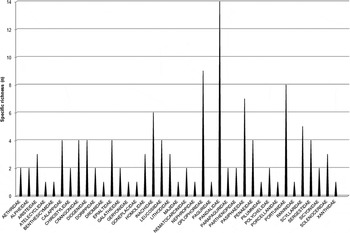
The most important families in terms of species richness (Figure 2) were Pandalidae, (with 14 different species), followed by Oplophoridae (with 9 species), Portunidae (8 species), Pasiphaeiade (7 species), Inachidae (6 species) and Scyllaridae (5 species). The rest were families represented in the area by fewer than 5 species. Species families with a high commercial value such as Aristeidae, Penaeidae and Geryonidae were amongst the lowest in specific richness.
Specific richness per family in the whole sampled area.

Abundance, biomass and frequency of occurrence
Total crustacean biomass estimated in the survey area was near 2609 t, while the abundance was around 100,700 individuals. Table 2 shows the total biomass and total abundance of the decapod species by depth stratum and total area. The shallowest stratum (<50 m) showed the lowest biomass and abundance in the study area. Both biomass and abundance increased with depth, reaching the greatest values at the 200–500 m depth stratum and then decreasing between 500 and 1000 m.
Mean values of total biomass (in tonnes, t), total abundance (in number of individuals, n), species richness and diversity (Shannon–Wiener index, H′) for decapod crustaceans by depth stratum and total area. Strata diversities are average values, while diversity in the whole area (Total) corresponds to a total value.
In Table 3 are presented for the decapod species overall depth-range, biomass and abundance within each depth stratum, as well as percentages of occurrence in the total area. The left-handed hermit crab D. arrosor was the most common species in the survey area, present in 48% of the hauls and appearing in a depth-range from 24 to 306 m. The second most frequent species was the squat lobster Munida speciosa (occurrence 30.6%), followed by the striped red shrimp A. varidens (occurrence 27.6%), the deep-water rose shrimp Parapenaeus longirostris (occurrence 24.5%), Bathynectes maravigna, one undeterminated species of Diogenes (Diogenes sp.), and the sponge crab Sternodromia spinirostris (all with occurrence 21.4%). Many species (30% of the total), most of them Brachyura, only appeared in one station.
Depth-range (m); B, total biomass (t); N, abundance (number of individuals) and occurrence (%) for the different species collected by depth stratum in the survey area (•, ten species of higher biomass; *, ten species of higher abundance).

The species with the highest biomass were the squat lobster M. speciosa (478 t), the left-handed hermit crab D. arrosor (304 t), the African spider shrimp Nematocarcinus africanus (282 t), the crab B. maravigna (190 t), the sponge crab S. spinirostris (166 t) and A. brevispinis (151 t). Other abundant species were: the deep-sea fierce king crab Lithodes ferox, the hermit crab Diogenes sp. and the deep-water rose shrimp P. longirostris, the three species with biomasses between 100 and 120 t.
The African spider shrimp N. africanus was the most abundant species in number (more than 43,000 individuals) followed by the squat lobster M. speciosa (near 16,500 individuals) and the pandalid shrimp P. carinata (6300 approximately). Other abundant species were: the left-handed hermit crab D. arrosor (5705 individuals); the deep-water rose shrimp P. longirostris and the golden shrimp Plesionika martia (with 4000–5000 individuals); the sponge crab S. spinirostris and Plesionika ensis (2000–3000 individuals); S. sculpta, Diogenes sp., B. maravigna and the pandalids Plesionika heterocarpus and Plesionika williamsi (between 1000 and 1700 individuals).
Bathymetric patterns
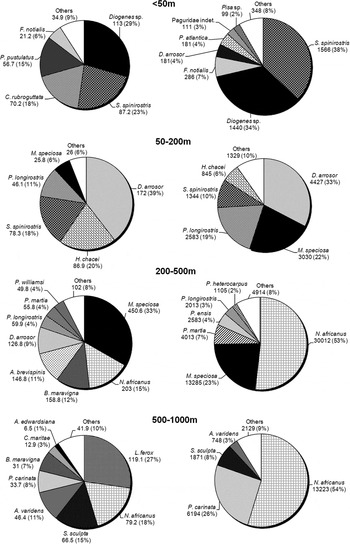
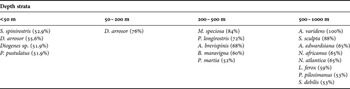
Figure 3 shows biomass (left) and abundance (right) percentages of the dominant decapod species (accounting for 90% of the total) per bathymetric stratum. The other 10% of the species were grouped in ‘others’. Those species with occurrence percentages higher than 50% by depth strata are shown in Table 4. Dominant species clearly differed among depth strata, as well as their biomasses and abundances.
Relative biomass (left) and abundance (right) of crustacean decapod species per depth stratum in the sampled area.

List of the decapod crustacean species with frequency of occurrence (%) higher than 50%, by depth stratum.

Only 5 species accounted for 90% of the biomass in the shallowest stratum of the coastal shelf (<50 m) (Figure 3). These included Diogenes sp. (29%), the sponge crab S. spinirostris (23%) (also the most frequent species in this stratum), the box crab Calappa rubroguttata (18%) and the big diogenid crab Petrochirus pustulatus (15%). The fifth most abundant decapod species (in terms of biomass) on the coastal shelf (21 t) was the southern pink shrimp Farfantepenaeus notialis, caught in 5% of the fishing stations, all of them between 22 and 44 m depth (Table 3). The most abundant species in this stratum was S. spinirostris (38% in number of individuals) closely followed by Diogenes sp. (34%), the southern pink shrimp F. notialis (7%), the left-handed hermit crab D. arrosor (4%), Parapenaeopsis atlantica (4%), Paguridae indet. (3%) and Pisa sp. (2%).
Dardanus arrosor, Hymenopenaeus chacei and S. spinirostris were the most representative species of the 50–200 m stratum, accounting for 75% of the total biomass (Figure 3 left). Only D. arrosor accounted for 39% in biomass and 33% in number (Figure 3 right), being the most frequent species in the stratum (76% of occurrence) (Table 4). The following species in biomass were H. chacei (20%), S. spinirostris (18%), P. longirostris, (10%) and M. speciosa (6%). This last species was the second in abundance (22%), followed by the deep-water rose shrimp P. longirostris, the sponge crab S. spinirostris and H. chacei with 19%, 10%, and 6%, respectively.
The greatest biomass by stratum (1353 t) was estimated for the upper slope (200–500 m), which was also the stratum with the most abundant species in the whole prospected area (M. speciosa, N. africanus, B. maravigna and A. brevispinis). The squat lobster M. speciosa was the dominant species in this stratum both in terms of biomass (33%) and occurrence (84%). The following species in biomass were N. africanus (15%), B. maravigna (12%), A. brevispinis (11%), D. arrosor (9%), P. longirostris and P. martia (both with 4%). In spite of their relative low biomass in this stratum, P. longirostris, A. brevispinis, B. maravigna and P. martia appeared with a frequency of occurrence higher than 50% (Table 4). The African spider shrimp N. africanus was the most abundant species in number of individuals, accounting for more than 50% of the stratum abundance (Figure 3 right). Other abundant species were the squat lobster M. speciosa (23%), the golden shrimp P. martia (7%), P. ensis (4%), the deep-water rose shrimp P. longirostris (3%) and the arrow shrimp P. heterocarpus (2%).
Although the biomass decreased at the deepest stratum (500–1000 m), the diversity was maximal at these depths (Table 2). Typical deep water species with high biomass were L. ferox (27.2%), N. africanus (18%), S. sculpta (15%) and A. varidens (11%). These four species, which were also very frequent in this stratum, accounted for 75% of the biomass at these depths. The striped red shrimp A. varidens (11%) was present in 100% of the stations between 500 and 1000 m depth (Table 4). Other representative species in terms of biomass were P. carinata (8%), B. maravigna (7%), Chaceon maritae (3%) and Aristaeopsis edwardsiana (1.5%). The African spider shrimp N. africanus was also the most abundant species in this stratum (54%), followed, in this case, by P. carinata (26%), S. sculpta (8%) and A. varidens (3%).
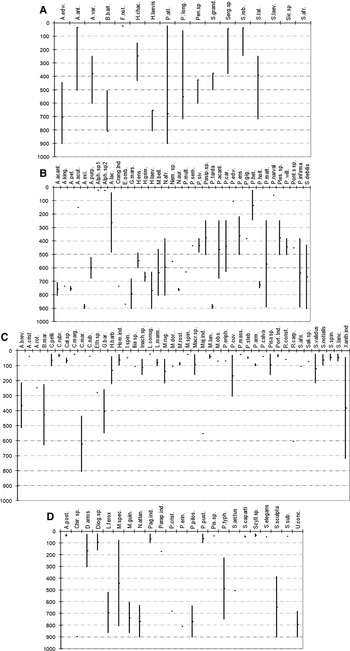
Clear differences are observed between the depth occurrence patterns among the main groups of decapods (Figure 4). The group of Dendrobranchiata (Figure 4A) was composed of few species with scarce occurrence. Some of them were only present on the continental shelf (as is the case for F. notialis, P. atlantica and Sicyonia laevigata). The deep-water rose shrimp P. longirostris has its average depth in the upper slope, although it appeared from 56 to 436 m, both in the continental shelf and the upper slope. Hymenopenaeus chacei, Sergia robusta and Sergia talismani occurred in both the upper and middle slope while Penaeopsis sp. and Sergia sp. exclusively appeared in the middle slope. Other species such as A. edwardsiana, Aristeus antennatus, Benthesicymus bartletti and Sergia grandis occurred in the middle and deep slope. Hymenopenaeus laevis only occurred at depths around 800 m, in the deep slope. Solenocera africana and the striped red shrimp A. varidens were the species of larger bathymetric occurrence within this group, appearing from 56 to 720 m and 249 to 905 m, respectively.
Bathymetric distribution of the decapod crustaceans collected during the ‘GUINEA BISSAU 0810’ survey, ranked according to their mean depth of occurrence. (A) Dendrobranchiata; (B) Caridea; (C) Brachyura; (D) Anomura, Astacidea and Polichelida.

Caridean shrimps (Figure 4B) showed a broad depth of occurrence and clearly were species of the continental slope, both the upper and the middle slope. Only six species occurred exclusively on the continental shelf: Plesionika edwardsii, Plesionika narval, Acantephyra acutifrons, an undetermined Crangonidae and two undetermined species of the genus Alpheus. Some species such as Pasiphaea semispinosa, Pasiphaea sivado, P. ensis, Plesionika giglioli, P. williamsi and Pontophilus sp. were mainly distributed in the upper and middle slope (217–500 m), while several species of the genus Acanthephyra (A. kingsleyi, A. pelagica and A. purpurea), Notostomus crosnieri, Plesionika holthuisi; two species of the family Crangonidae; and one of the genus Nematocarcinus, exclusively appeared in the deep slope (approximately 500–800 m). The caridean species with deeper distribution were Acanthephyra eximia, Ephyrina ombango, Pasiphaea tarda and several species of the genus Heterocarpus. The rest of the species within this group had wider depth-ranges, especially species such as Aagaeon lacazei, reported from 37–448 m (shelf and upper slope), P. martia, Psathyrocaris infirma and Systellaspis debilis (upper, middle and deep slope).
Brachyura (Figure 4C) constitute a typical continental shelf group. There were some species that appeared on the shelf and upper slope (Paromola cuvieri, Homola barbata, Macropipus rugosusand Sanquerus validus); on the shelf, upper and middle slope (one undetermined xanthoid crab); upper slope (Atelecyclus rotundatus and Ethusa sp.); upper and middle slope (A. brevispinis, G. barnardi and B. maravigna) and typical deep-sea species such as C. maritae, R. carpentieri and undetermined Majidae, that inhabit the middle–lower slope. The remaining 31 taxa of Brachyura identified were exclusively found on the continental shelf.
Hermit crabs and squat lobsters (Anomura) and scampi (Astacidea) were represented by 15 and 6 species respectively, while only 2 species of deep-sea lobsters (Polychelidae) were found (Figure 4D). The two most abundant and most frequent species in the area (the squat lobster M. speciosa and the left-handed hermit crab D. arrosor) were anomuran crabs. The group Anomura included coastal species only occurring on the continental shelf, as one undetermined species of Paguridae and the other of Parapaguridae, three species of Diogenidae (Spiropagurus elegans, P. pustulatus and Diogenes sp.), and one species of the genus Pisidia; deep water families, such as Lithodidae (the fierce king crab L. ferox, Paralomis cristulata and Paralomis erinacea), Parapagurus pilosimanus, Chirostylus sp., Munida guineae and Uroptychus concolor; species with an intermediate distribution between the continental shelf and the upper slope (D. arrosor); and species with a wide depth-range such as M. speciosa which appeared from the continental shelf (75 m) to the deep slope (809 m). Astacidea were represented by both coastal water and deep water species. Four coastal water species, all belonging to the family Scyllaridae (Acantharctus posteli, Scyllarus subarctus, Scyllarus caparti and an undetermined species of Scyllarus) appeared on the continental shelf at depths up to 65 m. One species of Nephropidae (Nephropsis atlantica) was the only deep-water species of Astacidea. The infraorder Polychelida was represented by two deep-water species (Steromastis sculpta and Polycheles typhops).
Assemblage structure
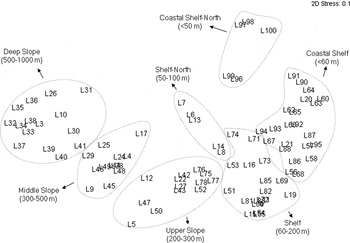
A two-dimensional MDS plot was generated taking into account the pre-defined grouping to depth in order to observe the effect of this variable (Figure 5). The resulting plot demonstrates that the variation in terms of decapod crustacean species composition is strongly influenced by depth. The resulting MDS ordination stress value is 0.1.
Two-dimensional multidimensional scaling ordination plot of average abundance data of decapod crustaceans obtained during the ‘GUINEA BISSAU 0810’ survey.

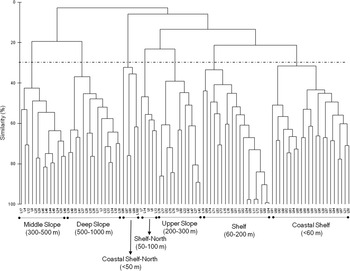
The dendrogram of similarities among stations (Figure 6) shows that different faunal groups can be clearly defined along the bathymetric gradient. A first branching of a low similarity level (below 5%) discriminates two main groups: a shelf–upper slope group and a middle–deep slope group. At a level of similarity of about 30% the similarity tree clearly discriminates between seven groups: (1) a group composed of 22 strictly coastal hauls down to 60 m depth (‘coastal shelf’); (2) a group made up of 19 hauls essentially ranging between 60 and 200 m depth, corresponding to most of the hauls on the middle shelf (‘shelf’); and (3) the ‘upper-slope’ group, made up of 12 hauls between 200 and 300 m. Furthermore, there are two shelf groups restricted to the northern area: (4) a group of 5 coastal stations (<50 m) (‘coastal shelf-north’); and (5) another shelf group of hauls at depths between 50 and 100 m (‘shelf-north’). These five groups (1 to 5) are included in the ‘shelf–upper slope’ main branch. The two remaining groups (6 and 7) belong to the slope: (6) a group of 13 stations between 300 and 500 m (‘middle slope’); and (7) another group of 14 stations between 500 and 1000 m (‘deep slope’).
Dendrogram of trawl stations using group-average clustering from Bray–Curtis similarity measures on average abundance of decapod crustaceans obtained during the ‘GUINEA BISSAU 0810’ survey. L, station.

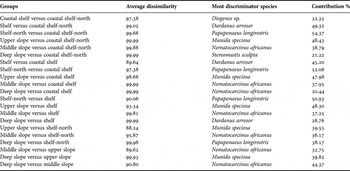
The SIMPER analysis showed that the average dissimilarity between the seven assemblages ranged from 88.24% to 99.99%. These differences were due to the different contribution of species in each group. Table 5 shows those species responsible for the intergroup dissimilarities.
Most important species, in terms of percentage contribution to the group dissimilarity (similarity percentage analysis), listed for each group resulting from the cluster analysis.

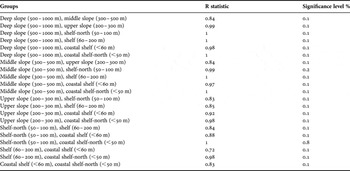
Although many species occurred in more than one group, each faunal assemblage was characterized by its own distinctive species composition. The pair-wise comparisons between groups (Table 6) defined by the ANOSIM showed high separation between the seven groups, with a global R value of 0.91.
Analysis of similarities performed on the seven assemblages identified by the cluster analysis. Sample statistic (Global R), 0.911; significance level of sample statistic, 0.1%; number of permutations, 999 (random sample from a large number); number of permuted statistics greater than or equal to Global R, 0.

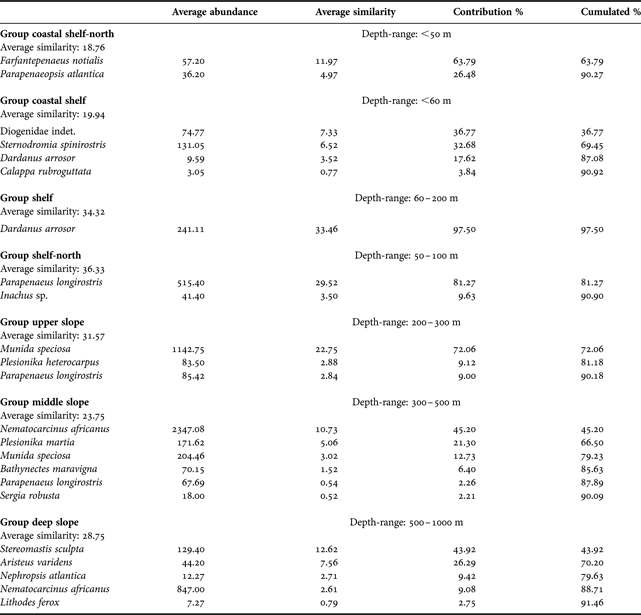
The mean abundance, similarity percentage of contribution and cumulative percentage of each species in the seven assemblages are shown in Table 7, recapitulating the differences in the dominant species between the seven aforementioned main assemblages (SIMPER analysis).
Most important species, in terms of percentage contribution to the group similarity (similarity percentage analysis) listed for each group resulting from the cluster analysis (cut-off for low contribution, 90.00%).
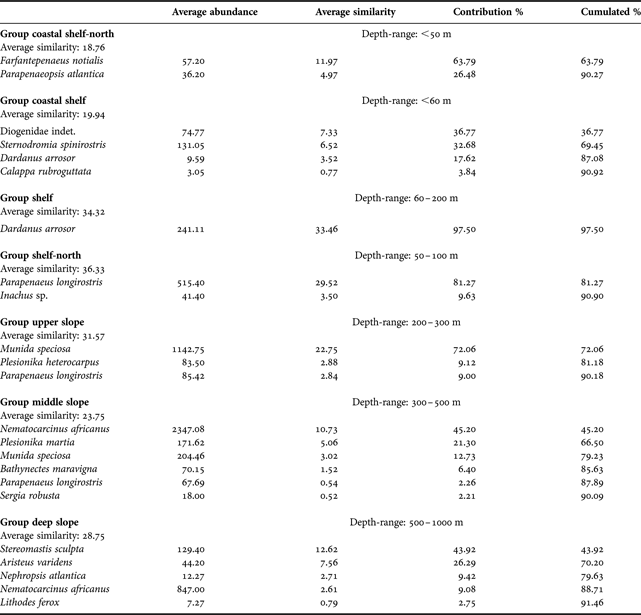
The coastal shelf assemblage is mostly characterized by S. spinirostris, Diogenes sp., D. arrosor and C. rubroguttata with decreasing abundance, while F. notialis and P. atlantica typify the coastal shelf–north assemblage.
The hermit crab D. arrosor is the discriminating species of the shelf assemblage, with a contribution higher than 97% within the group. However, the shelf–north assemblage is characterized by the deep-water rose shrimp P. longirostris, with a small contribution of Inachus sp.
Three species, M. speciosa, P. longirostris and P. heterocarpus typified the group corresponding to the upper slope, M. speciosa being the most abundant and the main contributor species within this group. The middle slope assemblage is characterized by six species, being in order of abundance: N. africanus, M. speciosa, P. martia, B. maravigna, P. longirostris and S. robusta. The deepest assemblage (deep slope), is typified by five species: N. africanus, S. sculpta, A. varidens, N. atlantica and L. ferox in order of decreasing abundance.
DISCUSSION
This study provides valuable information on the faunal composition of decapod crustaceans in waters off Guinea-Bissau. Several observations have extended the bathymetric and geographical distribution-ranges cited in the literature for certain species in Atlantic waters (García-Isarch, personal communication). In addition, our results show clear patterns in diversity, abundance and biomass of decapod crustaceans on the continental shelf and slope waters of the Guinea-Bissau EEZ, highly related to depth. Different depth-ranges, occurrences, biomasses and abundances among depth strata demonstrate the differences in the crustacean distribution due to bathymetry. Decapod biomass and abundance increased with depth, reaching maxima values in the upper slope (200–500 m depth) and minimum ones in the shallowest stratum. Over 500 m, the decapod abundance and biomass exhibited the typical decrease with depth observed in the deep-sea environment (Cartes & Sardà, Reference Cartes and Sardà1992; Company et al., Reference Company, Maiorano, Tselepides, Politou, Plaity, Rotllant and Sarda2004; Politou et al., Reference Politou, Maiorano, D'Onghia and Mytilineou2005; Cartes et al., Reference Cartes, Serrano, Velasco, Parra and Sánchez2007). As the environmental conditions are relatively constant in deep waters, this reduction in waters deeper than 500 m may be due to low trophic resource availability. The increase of decapod biomass with increasing depth has been described in North Atlantic waters (Fariña et al., Reference Fariña, Freire and González-Gurriarán1997; Cartes et al., Reference Cartes, Serrano, Velasco, Parra and Sánchez2007), and Amorim et al. (Reference Amorim, Mané and Stobberup2002) found similar results with demersal fish in Guinea-Bissau. In tropical waters, however, the general assumption is that higher biomasses are found in shallow and suprathermocline waters (Longhurst & Pauly, Reference Longhurst and Pauly1987). The explanation for lower biomass in coastal areas may be that Guinea-Bissau waters do not belong to the typical tropical type, as its environment is characterized by strong seasonal variations of oceanographic conditions (Berrit & Rebert, Reference Berrit, Rebert and Berri1977), mainly due to seasonal upwelling events. Thus, seasonal variations are probably responsible for the deviations in the distribution of demersal biomass, as observed in waters off Gabon and Congo (Bianchi, Reference Bianchi1992a).
A total of 122 species of decapod crustaceans were identified from coastal waters to depths up to 1000 m off Guinea-Bissau. This species richness is very high in comparison to those recorded in similar bathymetric ranges of other Atlantic (Macpherson, Reference Macpherson1991; Serrano et al., Reference Serrano, Sanchez and Garcia-Castrillo2006) or Mediterranean waters (e.g. Abelló et al., Reference Abelló, Valladares and Castellón1988, Reference Abelló, Carbonell and Torres2002; Cartes & Sardà, Reference Cartes and Sardà1992; Maynou et al., Reference Maynou, Conan, Cartes and Company1996; Biagi et al., Reference Biagi, Sartor, Ardizzone, Belcari, Belluscio and Serena2002; Massutí & Reñones, Reference Massutí and Reñones2005; Ungaro et al., Reference Ungaro, Marano, Ceriola and Artino2005; Abad et al., Reference Abad, Preciado, Serrano and Baro2007; Fanelli et al., Reference Fanelli, Colloca and Ardizzone2007). In decapod crustaceans, species richness is affected by latitude, being highest in tropical and subtropical regions compared to temperate and cold ones, where a significant decrease of species richness is observed (Abele, Reference Abele and Bliss1982). In this study, the average diversity increased with depth, reaching a maximum over the deep slope strata. This tendency of increasing decapod diversity with depth, reaching maxima values between 1000 and 2000 m, has already been described for other areas (Haedrich et al., Reference Haedrich, Rowe and Polloni1980; Abelló, et al., Reference Abelló, Valladares and Castellón1988; Cartes & Sardà, Reference Cartes and Sardà1992; Fariña et al., Reference Fariña, Freire and González-Gurriarán1997; Politou et al., Reference Politou, Maiorano, D'Onghia and Mytilineou2005; Cartes et al., Reference Cartes, Serrano, Velasco, Parra and Sánchez2007; Fanelli et al., Reference Fanelli, Colloca and Ardizzone2007). Diversity in benthic marine communities may be linked to many factors such as productivity, trophic relationships and biological interactions, which vary in importance according to depth (Rex et al., Reference Rex, Etter, Stuart, Ormond, Gage and Angel1997). The increasing diversity with depth can be explained by the greater environmental stability of the slope zone, which allows a more mature and thus, a more diverse community to develop (Haedrich et al., Reference Haedrich, Rowe and Polloni1980; Abelló et al., Reference Abelló, Valladares and Castellón1988). The presence of steep bottoms favours the coexistence of pelagic and nectobenthic species with the strictly benthic species, resulting in an increased diversity (Abelló et al., Reference Abelló, Valladares and Castellón1988). In addition, a very low oxygen zone (<1 ml O2/l) was detected in the Guinea-Bissau continental slope (Sánchez-Leal, personal communication), a factor that has been also related to higher occurrence of crustacean species (Mincks et al., Reference Mincks, Bollens, Madin, Horgan, Butler, Kremer and Craddock2000; Hendricks, Reference Hendrickx2001).
The dendrogram of similarities among hauls has shown the existence of seven main groups that may correspond to seven different faunal assemblages: coastal or shallower shelf (<60 m), shelf (60–200 m), upper slope (200–300 m), middle slope (300–500 m), deep slope (500–1000 m), coastal shelf–north (<50 m at the northern area) and shelf–north (50–100 m, in the northern area). These assemblages are mainly sorted by depth, although type of sediment (as a function of latitude) also affected the subdivision in the coastal shelf and shelf assemblages in the northern shallow area, characterized by soft bottoms (mud and sand) mainly related to the river mouth (McMaster et al., Reference McMaster, Lachance and Ashraf1971; Domain, Reference Domain1980).
In the cluster analysis, some species serve as indicators of the assemblages when they are more frequent and abundant in a series of samples than in others. Thus, benthic species such as brachyurans (Sternodromia spinirostris and Calappa rubroguttata) and left-handed hermit crabs (Diogenes sp. and D. arrosor) are indicators in the shallowest assemblage (coastal shelf) located at depths below 60 m. Coastal strata were very favourable habitats for the pagurid crabs (Le Danois, Reference Le Danois1948; Serrano et al., Reference Serrano, Sanchez and Garcia-Castrillo2006). The most abundant species in the coastal assemblage was the sponge crab S. spinirostris, which has also been cited as one of the characterizing species of the macrobenthic community in the same bathymetric range off Guinea (Le Loeuff, Reference Le Loeuff1993). It has also been described in the coastal waters of Côte d'Ivoire (Le Loeuff & Intès, Reference Le Loeuff and Intès1999). Diogenes sp., which always appeared associated with a zoanthid was the main contributor to the similarity within the group. The typifying species varies if we consider the coastal shelf faunal subgroup assemblage in the northern area. Two penaeid species (Farfantepenaeus notialis and Penaeopsis atlantica) characterized this subgroup, located in the northernmost eastern area of the prospected zone, at depths below 50 m, with the southern pink shrimp F. notialis being the main species of this assemblage. It is worth mentioning the commercial value of the southern pink shrimp in this area, which is one of the target species for both artisanal and industrial fleets (Sobrino & García, Reference Sobrino and García1992). This species has been described as belonging to other shallow water assemblages in West African waters of Guinea (Le Loeuff, Reference Le Loeuff1993), Congo and southern Gabon, with an average depth of 21 m (Bianchi, Reference Bianchi1992a) and another from northern Angola to Benguela, with an average depth of 24 m (Bianchi, Reference Bianchi1992b). Penaeopsis atlantica has been described together with F. notialis in the same shallow water assemblages of Guinea (Le Loeuff, Reference Le Loeuff1993), Congo and Gabon, (Bianchi, Reference Bianchi1992a). Furthermore, the species has been cited in shallow coastal waters of Guinea (Le Loeuff, Reference Le Loeuff1993), Côte d'Ivoire (Le Loeuff & Intes, 1999) and Angola (Bianchi, Reference Bianchi1992b).
The typifying species of the shelf assemblage (60–200 m) is D. arrosor. This left-hand hermit crab, very well known in European waters, is also very common on continental shelf bottoms of West Africa, having been sighted in waters off Morocco (Maurin, 1968; García Raso, Reference García Raso1996), Mauritania (Maurin, 1968), Guinea (Le Loeuff, Reference Le Loeuff1993), Côte d'Ivoire (Le Loeuff & Intès, Reference Le Loeuff and Intès1999) and Namibia (Macpherson, Reference Macpherson1991). Like other invertebrates, this species shows a tropical submergence phenomenon and lives at greater bathymetric levels in West African waters than in Europe, in order to avoid warmer waters (Le Loeuff, Reference Le Loeuff1993). There is a clearly different shelf assemblage in the northern area, characterized by the deep-water rose shrimp Parapenaeus longirostris. This assemblage is composed of muddy bottom stations between 50 and 100 m depth in the northern zone of the survey area (Domain, Reference Domain1980), located below the thermocline (Sánchez-Leal, personal communication). The small size of the shrimps caught (García-Isarch, personal communication) may indicate a recruitment zone for the species in the area.
The indicator species of the upper slope assemblage (from 200–300 m depth), are, in order of decreasing abundance, the squat lobster Munida speciosa, the deep-water rose shrimp P. longirostris and the arrow shrimp P. heterocarpus. Munida speciosa is the discriminator species of the assemblage, accounting for 72% of the sample similarity. It has also been the most abundant species (in number and biomass) in the survey. This species has been found at similar depths in slope assemblages of northern Namibia (Macpherson, Reference Macpherson1991) and in waters off River Congo, Equatorial Guinea and Senegal (Miyake & Baba, Reference Miyake and Baba1970). Parapenaeus longirostris and Plesionika heterocarpus contribute to the similarity of the assemblage with similar percentages (around 9% in each case). The deep-water rose shrimp is a typical deep shelf–upper slope species, which has also been described as belonging to shelf–upper slope assemblages in Atlantic waters of northern Namibia (Macpherson, Reference Macpherson1991), Angola (Bianchi, Reference Bianchi1992b), Congo and Gabon (Bianchi, Reference Bianchi1992a), Morocco, Mauritania and Senegal (Maurin, 1968) and in the Mediterranean Sea (Abelló et al., Reference Abelló, Valladares and Castellón1988, Reference Abelló, Carbonell and Torres2002; Maynou & Cartes, Reference Maynou and Cartes2000; Biagi et al., Reference Biagi, Sartor, Ardizzone, Belcari, Belluscio and Serena2002; Company et al., Reference Company, Maiorano, Tselepides, Politou, Plaity, Rotllant and Sarda2004; Massutí & Reñones, Reference Massutí and Reñones2005; Politou et al., Reference Politou, Maiorano, D'Onghia and Mytilineou2005; Abad et al., Reference Abad, Preciado, Serrano and Baro2007; Fanelli et al., Reference Fanelli, Colloca and Ardizzone2007). This species characterized two assemblages in waters off Guinea-Bissau. On one hand, as explained above, it was the typifying species of the coastal shelf assemblage located in the northern muddy bottoms below the thermocline, and mainly constituted by recruits. On the other hand, it is the second species in abundance in the upper slope assemblage. Similarly, P. longirostris has also been described in two different assemblages, one coastal and another in the upper slope in waters off Congo, Gabon and Angola (Bianchi, Reference Bianchi1992a,Reference Bianchib). In all cases the coastal faunal groups were subthermocline assemblages over soft bottoms of mud, and mud–sand (at average depths of 79 m in Congo, 70–140 m in northern Angola and 50–100 in Guinea-Bissau) almost identical in species composition, with deep-water rose shrimps not very abundant but quite frequent. In the upper slope assemblages, P. longirostris was more abundant and found at average depths of 219, 256 and 200–300 m in Congo–Gabon, Angola and Guinea-Bissau, respectively. The deep-water rose shrimp is the target species of industrial shrimper fleets fishing in Guinea-Bissau waters, such as the Spanish fleet, for which it makes around 75% of the landings (Sobrino & García, Reference Sobrino and García1992). The arrow shrimp P. heterocarpus is a typifying species of other slope communities in African waters (Macpherson, Reference Macpherson1991). It has been found at similar depths (150–300 m) in north-west African waters (Maurin, 1968; Anadón, Reference Anadón1981) and North Atlantic waters (Fariña et al., Reference Fariña, Freire and González-Gurriarán1997), while its presence in the Mediterranean covers a wider depth-range between 45 and 468 m (Abelló et al., Reference Abelló, Carbonell and Torres2002).
The middle slope assemblage (between 300 and 500 m) was dominated by benthic or nectobenthic species such as Nematocarcinus africanus, M. speciosa, Plesionika martia, Bathynectes maravigna, P. longirostris and Sergia robusta. The typifying species of this community were N. africanus, M. rutllanti and P. martia accounting together for almost 80% of the similarity within the group. The African spider shrimp N. africanus was the most characteristic species of the slope community, being the most abundant and the one with the highest contribution in the group. Furthermore, as described below, this species also typifies the deep slope assemblage. Nematocarcinus africanus has been described in slope communities of other areas of West African coasts (Macpherson, Reference Macpherson1991; Bianchi, Reference Bianchi1992a). It is, together with the black hake Merluccius polli, the indicator species of the slope assemblage of quite similar depths in waters off Congo, Gabon and Angola (Bianchi, Reference Bianchi1992a, Reference Bianchib). The golden shrimp P. martia, which is the third species in abundance in the middle slope community, has a worldwide distribution in tropical and temperate ocean waters and has been described as a typical deep Mediterranean decapod, being one of the most frequent or abundant species at depths of over 350–400 m (Abelló et al., Reference Abelló, Valladares and Castellón1988, Reference Abelló, Carbonell and Torres2002; Maynou et al., Reference Maynou, Conan, Cartes and Company1996; Maynou & Cartes, Reference Maynou and Cartes2000; Biagi et al., Reference Biagi, Sartor, Ardizzone, Belcari, Belluscio and Serena2002; Maiorano et al., Reference Maiorano, D'Onghia, Capezzuto and Sion2002; Company et al., Reference Company, Maiorano, Tselepides, Politou, Plaity, Rotllant and Sarda2004; Massutí & Reñones, Reference Massutí and Reñones2005; Politou et al., Reference Politou, Maiorano, D'Onghia and Mytilineou2005; Abad et al., Reference Abad, Preciado, Serrano and Baro2007; Fanelli et al., Reference Fanelli, Colloca and Ardizzone2007; Moranta et al., Reference Moranta, Quetglas, Massutí, Guijarro and Díaz2008). Its presence has also been referenced in slope communities of South Atlantic waters (Macpherson, Reference Macpherson1991) and in the North Atlantic (Maurin, 1968; García Raso, Reference García Raso1996; Fariña, 1997; Cartes et al., Reference Cartes, Serrano, Velasco, Parra and Sánchez2007), where it is much less frequent. Another typical species of the middle slope community was the crab B. maravigna, usually recorded on the upper continental slope deeper than 250 m (Abelló et al., Reference Abelló, Ungaro, Politou, Torres, Roman, Rinelli, Maiorano and Norrito2001), and very abundant in deep water decapod assemblages of the North Atlantic (Fariña et al., Reference Fariña, Freire and González-Gurriarán1997; Cartes et al., Reference Cartes, Serrano, Velasco, Parra and Sánchez2007) and the Mediterranean (see review in Abelló et al., Reference Abelló, Ungaro, Politou, Torres, Roman, Rinelli, Maiorano and Norrito2001). Even though Morocco and the Canary Islands were the southern distribution zone limit of the species (Abelló et al., Reference Abelló, Ungaro, Politou, Torres, Roman, Rinelli, Maiorano and Norrito2001), this study demonstrated its presence at southern latitudes, in waters off Guinea-Bissau. The sergestid shrimp S. robusta has been described in depth assemblages at 400–500 m, 500–800 and below 600 m in Mediterranean waters (Abelló et al., Reference Abelló, Valladares and Castellón1988; Maynou & Cartes, Reference Maynou and Cartes2000), where it has been recorded in a depth-range from 300 to more than 1500 m (Abelló et al., 1998, Reference Abelló, Carbonell and Torres2002; Company et al., Reference Company, Maiorano, Tselepides, Politou, Plaity, Rotllant and Sarda2004). In North Atlantic waters, S. robusta is a typifying species of deep slope assemblages around 600–1000 m (Cartes et al., Reference Cartes, Serrano, Velasco, Parra and Sánchez2007).
Nematocarcinus africanus, Stereomastis sculpta and Aristeus varidens typified the deep slope-assemblage (500–1000 m), accounting together for around 80% of similarity within the group. Nematocarcinus africanus is the most abundant in this assemblage and, as described above, it is a typical slope species in African waters (Macpherson, Reference Macpherson1991; Bianchi, Reference Bianchi1992a). However, S. sculpta and A. varidens provide more similarity to the group, being the discriminating species of the deep slope assemblage. Stereomastis sculpta is a typical deep water species, described in the Mediterranean Sea at depths between 800 and 2800 m (Company et al., Reference Company, Maiorano, Tselepides, Politou, Plaity, Rotllant and Sarda2004). The striped red shrimp A. varidens is one of the target species of the crustacean industrial fleet in waters off Guinea-Bissau (Sobrino & García, Reference Sobrino and García1992). This species has been described as belonging to deeper continental slope assemblages in waters off Congo, Gabon and Angola (Bianchi, Reference Bianchi1992a, Reference Bianchib), Mauritania (Maurin, Reference Mourin1968) and to a slope/bathyal assemblage in Namibian waters (Macpherson, Reference Macpherson1991). The scarlet lobsterette Nephropsis atlantica and the fierce king crab Lithodes ferox are other species characterizing this assemblage, as it occurs in slope/bathyal assemblages of Namibia (Macpherson, Reference Macpherson1991).
Although similarities can be found with other decapod assemblages, especially with those of Western African coasts or with deeper assemblages of other seas (like the Mediterranean), any assemblage significance is strictly local and related to the taxocenosis studied (Haedrich & Merret, Reference Haedrich and Merrett1990; Maynou & Cartes, Reference Maynou and Cartes2000). However, within an environmentally homogeneous area the composition of crustacean decapod assemblages scarcely varies (Maynou & Cartes, Reference Maynou and Cartes2000). Numerous decapod species appearing in waters off Guinea-Bissau are common in Mediterranean and European Atlantic waters, a fact also underlined in benthic faunal studies of other African areas. Palaeogeographical studies have shown that there is a strong similarity between the present West African fauna and the Pliocene fauna of Southern Europe (Le Loeuff & Zabi, Reference Le Loeuff, Zabi, McGlade, Cury, Koranteng and Hardman-Mountford2002).
In our study, the dominant species differed among depth strata, confirming the importance of depth in structuring crustacean decapod communities, as it has been described in other areas of the South Atlantic (Lleonart & Roel, Reference Lleonart and Roel1984; Macpherson, Reference Macpherson1991; Bianchi, Reference Bianchi1992a,Reference Bianchib); North Atlantic (Fariña, 1997; Serrano et al., Reference Serrano, Sanchez and Garcia-Castrillo2006) and Mediterranean (Abelló et al., Reference Abelló, Valladares and Castellón1988, Reference Abelló, Carbonell and Torres2002; Maynou & Cartes, Reference Maynou and Cartes2000; Fanelli et al., Reference Fanelli, Colloca and Ardizzone2007). The structure of decapod crustacean assemblages on the continental margins in different geographical areas is largely determined by spatial differences in environmental and oceanographic conditions, and in particular: depth; nature of the substrate; and characteristics of the water masses (e.g. Haedrich et al., Reference Haedrich, Rowe and Polloni1975, Reference Haedrich, Rowe and Polloni1980; Abelló et al., Reference Abelló, Valladares and Castellón1988; Macpherson, Reference Macpherson1991; Bianchi, Reference Bianchi1992a, Reference Bianchib; Cartes & Sardà Reference Cartes and Sardà1993; Fariña et al.; 1997; Cartes et al., Reference Cartes, Serrano, Velasco, Parra and Sánchez2007). Food supply (Maynou & Cartes, Reference Maynou and Cartes2000; Massutí & Reñones, Reference Massutí and Reñones2005) and climatic seasonal variations (Le Loeuf & Intes, 1999; Soto et al., Reference Soto, Manickhand-Heileman, Flores, Licea, von Vaupel Klein and Schram1999) have also been identified as contributing factors in the variations of benthic communities. Therefore, it can be concluded that demersal faunal associations are probably determined by a combination of both abiotic (in particular bottom structure and type, and dynamic of the water masses) and biotic (competition, resource availability and food web structure) factors (Moranta et al., Reference Moranta, Quetglas, Massutí, Guijarro and Díaz2008).
In this study having not analysed other possible contributing factors, depth was the main factor influencing the structure of decapod crustacean assemblages. The decapod crustacean community in shelf and slope waters off Guinea-Bissau presented a zonation effect, with clear bathymetric boundaries. Main faunal discontinuities were located at depths of 60, 200 and 500 m. The 60 m boundary could be attributed to the position of the thermocline as thermal stratification has been related to demersal groupings in shallow West African waters (Bianchi, Reference Bianchi1992a, Reference Bianchib). The faunal discontinuity found at 200 m may be located where the continental shelf ends and begins the slope zone (shelf break), as described for fish assemblages in the same area (Amorim et al., Reference Amorim, Mané and Stobberup2002). The 500 m boundary may correspond to the transition between a middle-slope fauna and a strictly bathyal fauna, which is in general accordance with faunal studies in other areas, where this transition depth has been located around 400–500 m (Abelló et al., Reference Abelló, Valladares and Castellón1988; Macpherson, Reference Macpherson1991; Fanelli et al., Reference Fanelli, Colloca and Ardizzone2007).
This work has contributed to obtaining the first decapod crustacean faunal list in Guinean-Bissauan waters, as well as to determining inter-specific relationships between these organisms. Knowledge about the crustacean communities inhabiting Guinea-Bissauan waters is of great importance both for assessing possible changes in the structure of the ecosystem as a consequence of strong trawling pressure in the area, and for the establishment of ecosystem-based-management strategies. For the first, our study may constitute a reference point for further research focused on the possible changes in the Guinea-Bissau decapod assemblages, biomass or densities, as a result of fishing pressure. For the second, this study could contribute to the establishment of an ecosystem-based management approach to fisheries, which takes into account all living organisms and the environment, with special emphasis on habitats, communities and the effect of inter-specific relationships on the species abundance and distribution (Garcia et al., Reference Garcia, Zerbi, Aliaume, Do Chi and Lasserre2003; Pikitch et al., Reference Pikitch, Santora, Babcock, Bakun, Bonfil, Conover, Dayton, Doukakis, Fluharty, Heneman, Houde, Link, Livingston, Mangel, McAllister, Pope and Sainsbury2004). For ecosystem-based fishing management purposes, we recommend the implementation of long term monitoring programmes that could detect possible changes in the structure, biomass and diversity of benthic assemblages resulting from trawling. In conclusion, this study provides new information about composition, distribution, abundance and structure of decapod assemblages in Guinea-Bissau that may be useful for future studies aiming to quantify the effect of the trawling pressure in the area.
ACKNOWLEDGEMENTS
We thank the Secretaría General de Pesca Marítima (SGPM, General Secretariat for the Sea) of the Ministerio de Medio Ambiente, Rural y Marino (MMARM, Spanish Ministry of the Environment and Rural and Marine Affairs) for their useful contribution in the realization of the survey ‘GUINEA-BISSAU 0810’. We greatly appreciate the assistance of all the participants in the survey as well as the crew of the RV ‘Vizconde de Eza’. Special thanks to Dr Enrique Macpherson, Dr Pere Abelló and Dr Enrique García Raso for their help in the identification of some of the specimens.